Reposted from Dr Roy Spencer’s webite
June 3rd, 2019 by Roy W. Spencer, Ph. D.
The Version 6.0 global average lower tropospheric temperature (LT) anomaly for May, 2019 was +0.32 deg. C, down from the April, 2019 value of +0.44 deg. C:

Various regional LT departures from the 30-year (1981-2010) average for the last 17 months are:
YEAR MO GLOBE NHEM. SHEM. TROPIC USA48 ARCTIC AUST
 2018 01 +0.29 +0.51 +0.06 -0.10 +0.70 +1.39 +0.52
 2018 02 +0.25 +0.28 +0.21 +0.05 +0.99 +1.21 +0.35
 2018 03 +0.28 +0.43 +0.12 +0.08 -0.19 -0.32 +0.76
 2018 04 +0.21 +0.32 +0.09 -0.14 +0.06 +1.01 +0.84
 2018 05 +0.16 +0.38 -0.05 +0.01 +1.90 +0.14 -0.24
 2018 06 +0.20 +0.33 +0.06 +0.12 +1.11 +0.76 -0.41
 2018 07 +0.30 +0.38 +0.22 +0.28 +0.41 +0.24 +1.49
 2018 08 +0.18 +0.21 +0.16 +0.11 +0.02 +0.11 +0.37
 2018 09 +0.13 +0.14 +0.13 +0.22 +0.89 +0.23 +0.28
 2018 10 +0.20 +0.27 +0.12 +0.30 +0.20 +1.08 +0.43
 2018 11 +0.26 +0.24 +0.28 +0.45 -1.16 +0.67 +0.55
 2018 12 +0.25 +0.35 +0.15 +0.30 +0.25 +0.69 +1.20
 2019 01 +0.38 +0.35 +0.41 +0.36 +0.53 -0.15 +1.15
 2019 02 +0.37 +0.47 +0.28 +0.43 -0.02 +1.04 +0.05
 2019 03 +0.34 +0.44 +0.25 +0.41 -0.55 +0.96 +0.59
 2019 04 +0.44 +0.38 +0.51 +0.54 +0.50 +0.92 +0.91
 2019 05 +0.32 +0.29 +0.35 +0.39 -0.61 +0.98 +0.39
The UAH LT global anomaly image for May, 2019 should be available in the next few days here.
Lower Troposphere: http://vortex.nsstc.uah.edu/data/msu/v6.0/tlt/uahncdc_lt_6.0.txt
Mid-Troposphere: http://vortex.nsstc.uah.edu/data/msu/v6.0/tmt/uahncdc_mt_6.0.txt
Tropopause: http://vortex.nsstc.uah.edu/data/msu/v6.0/ttp/uahncdc_tp_6.0.txt
Lower Stratosphere: http://vortex.nsstc.uah.edu/data/msu/v6.0/tls/uahncdc_ls_6.0.txt
And just what are the damages these last 40 years from this very slight ‘Global Heating’? If someone can credibly quantify this and prove it, then maybe we should look at solutions, but from what I saw the last 40 years, things have just been a little more stable and benign overall which has led to 7.6 billion people with a surplus of food on the good Earth. So much so, that we burn perfectly good food for fuel. There sure doesn’t appear to be any climate emergency to me. Rarely does the planet experience such a moderateration in the last 2-3 million years. The climate always changes, usually in some cyclical nature and that should be a given.
“So much so, that we burn perfectly good food for fuel.”
Corn starch is not good food. It’s horrible to the GI tracts of bovines and chickens. The solution is to grow vast amounts of corn, extract the digestible fractions of that corn (30 or so percent, lipids, proteins etc.) and convert it into Porterhouse steaks and roasted chicken with rosemary and the like. The waste starch is then converted to ethanol to support this process financially. The Iowa, Nebraska, S. Dakota farmers are not phony planet-savers. It is actually a food industry. How many effing times do I have to post this?
Nah. Te “… Corn starch is not good food… “ Cattle can utilize carbohydrate from grains as an energy source perfectly well when properly managed, and can show good improvements in growth rates when so supplemented.
Pigs and chickens and humans thrive on the stuff, and the economics and practicality of grain sourced alcohol as a fuel remain extremely questionable.
“…energy sources’ comprising grains of high and low ruminal starch degradability (barley and sorghum) and a highly fermentable sugar source (molasses), with all diets adjusted for rumen-degradable nitrogen and mineral content. Unsupplemented steers gained 0.08 and 0.15 kg/day, in Experiments 1 and 2, respectively.
Growth of steers increased linearly with intake of ‘energy source’ supplements in increasing order of molasses, sorghum and barley (all differences P < 0.05).
https://www.publish.csiro.au/an/an15659
Ethanol produced in the US from fermented mash of not less than 51 percent corn and stored in charred new oak barrels at not more than 160 proof, and bottled at not more than 125 proof is Bourbon Whiskey. It is proof that God loves us and wants to be happy.
The only question about the economics comes from the Persian Poet who asked what is it that the wine sellers buy, that is half so precious as the goods they sell.
In a recent trip to Minnesota from Arizona and back, I learned it I use non ethanol fuel I gained 10 to 20 percent more miles per gallon. Why are we wasting corn for fuel when the net is a total loss?
Agree with you Mark. I, too, realized my mileage was worse with ethanol “enhanced” gasoline and wonder if the extra fuel burned per mile results in more “pollution” than standard non-ethanol fuel.
Ethanol is good. Just because it may be wasted on vehicular transport doesn’t mean it’s not viable. There is energy being wasted in all things. Personally, I seek out the meat that gets fed the remnants of ethanol plants. I have noticed a much better quality of meat that the Vegans don’t get to enjoy. Japan is now buying American beef again. There should be a separate market for this livestock because it just tastes better. If something like this would happen and make the whole “food quality enhancement” possible without subsidies, lovely.
To have better efficiency in the transport world, vehicles need to be adapted with “forced air induction systems” with the proper computer controlled management systems. At this time, there is a multitude of vehicles that do not meet this requirement. Schidt.
Maybe this energy could be used elsewhere more efficiently. I would like to see it used.
Best practice calls for ethanol to be added judiciously to barbeque and baseball in the form of lemonade, hard cider, ale and mixed drinks
Mike Lewis
If the fuel has 15% less gasoline in it and you use 15% more of it, or .9gal of gas and .862 of EToh.
say 5gal/100 mi. 20mpg(a marketing figment) or 5.75 gal/100mi = 17.4mpg.
ALL (virtually) of the carbon in that 5.75 gal is turned into CO2, so using ethanol produces 15% more CO2 than straight gasoline. That’s a 13% drop if fuel economy.
In other words, there is no economic or environmental good being done. This is especially true of newer cars, they produce much less pollution of CO, NOx, and other real pollutants. Just 15% plus more of your dollars going for fuel, instead of perhaps food you need or would enjoy more.
Even Al Gore has stated that ethanol for fuel is a bad idea and that he should have voted against it.
My dogs cannot handle any dog food with corn in it. As they have aged, the subsequent sugar low they get causes them to become nauseous and throw up bile. Switching to food high in protein without starchy grains and veggies as filler has helped. Finally grass fed beef with corn in strict moderation, including when finishing yearlings for slaughter, makes for better beef flavor. I have ordered and eaten farm slaughtered beef. The grass fed one was way better in flavor than the corn fed one.
Now for me, I love corn on the cob! But in moderation.
“Corn starch is not good food.” Try telling that to Guatemalans. When we were there several years ago we noticed several women making dozens of tortillas every morning. We later asked our bus driver how many tortillas he ate per day. His answer was “21, occasionally with a little beans and maybe a bit of meat on them.”
I lived among Mayan Indians in Chiapas, Mexico for six months back in the late 70s. Tortillas every day, and tortillas like you’ve never tasted, delicious and hot off the grill; probably a dozen a day. And with black beans and hot sauce. The Indians also ate tortillas with beans, although probably not as much beans as they should have. Other things we put on tortillas included snails–think escargot–and green leafs. (I was very careful to cook the green leaves…)
+1 At some point the people will come to realize that all the “Extreme Weather” we’re supposed to be experiencing not only isn’t extreme but it can’t be caused by AGW because the global temperature has been fairly stable.
Earthling2:
GOOD THOUGHTS.
It would be interesting to see what the graphing would actually look like, if the Russians fed the data in from their stations, which I believe we’re taken out of the mix sometime after the collapse of the
Soviet State. (Sort of a push back cause they were p.o’d.).
Of course with the data from these stations gone,. (not reported to the public of course by Western Media).,
This then began to skew the global data higher than it normally should have been.
This was used by unscrupulous folks with an agenda. They of course knew what the real deal was but why mess up a good thing !!!
As Siberian oil search and production facilities expanded during cold war years USSR inflated temperatures in order to show that Siberia is habitable, introducing a +0.3C lift in the global temperatures.
http://www.vukcevic.co.uk//69-71.htm
Did the USSR dispose of nuclear spent fuel in the Barents Sea? Most of the “missing” ice is near Russian ports
Yet, there is another story that Russian towns exaggerated how cold they were so they could get more fuel allocation, causing a temperature “rise” after the fall of the iron curtain and the termination of those stations in the temperature record. So who do we believe?
UAH is satellite derived. Russian politics have no effect.
Yes, I’m well aware of that, I was responding to the
“if the Russians fed the data in from their stations” pointing out that data from russian stations were unreliable anyway.
Jarrett. What are you on about? Russian data has no relevance to this dataset
“The climate always changes, usually in some cyclical nature”
Usually, but not this time. The last 40 years is just the very early stage of abrupt climate heating caused by dumping ever more CO2 into the atmosphere – now pushing 40Gt/year. We’ve baked more unavoidable temperature rise in too because of the lag and momentum shows no sign of reversing, on the contrary CO2 concentration is still rising exponentially.
“There sure doesn’t appear to be any climate emergency to me.” Said the guy passing the 12 floor…”
“then maybe we should look at solutions”, lol, too bad you didn’t think a parachute was going to be required.
Yes, it is always 20, 40, 50 or 100 years in the future when the tipping point will be reached.
That has been the story since they switched from Ice Age to Hot House.
And you believe it ROFL.
In response to the following pile-on here are some links to the research I’m basing my comments on. Amazing how many different reasons for this research being wrong (before it was even checked) :
“duped”
“astrologist?”
“how “abrupt” can it be”
“panic monger doomsday catastrophist”
“the 1930’s were hotter”
“obviously no tipping point”
“here is no baked in temperature rise”
“in 100 years it will be 1 degree cooler than it is now”
For those who think its all a hoax, sorry to lose you. For those who understand the science and for who it is a just a matter of where the ECS and TSR land, you might find this link interesting:
“we find the median time between an emission and maximum warming is 10.1 years, with a 90% probability range of 6.6–30.7 years”
Ricke, Caldeira (2014)
Others say is longer, “between 25-50 (~37.5) years”.
Hansen et al (2015)
So calling it a 10 year lag is being conservative. Not duped, actually conservative.
Loydo
Only way to make world warmer/warming today is to “adjust” the past cooler. And they are not even trying to hide their manufactured daydream. They are openly p*****g your eyes, and you willfully ask for more please.
Stop being stupid.
Loydo – What correct predictions have the alarmists made in the past 30 years that might cause you to believe the nonsense they’re peddling now?
When the masses realize our governments have duped us it may be too late. The more we allow them to control us the less freedom we have.
Claims Loydo the climate seers or is it climate astrologist?
Yes and yes + brainwashed clairvoyant.
If
how “abrupt” can it be?
Guess what Loydo?
Assertions are not science, and assuming you know what will happen is as unscientific as anyone can possibly be.
You are not correct because you believe something to be true.
Evidence is how scientists determine what is true and what is not.
The evidence is that you are a panic monger doomsday catastrophist.
Just like every other doomsday nutbag in the past several thousand years.
+100!
Loydo have very serious Obelix-syndrome.
** The last 40 years is just the very early stage of abrupt climate heating caused by dumping ever more CO2 into the atmosphere – now pushing 40Gt/year. We’ve baked more unavoidable temperature rise in too because of the lag and momentum shows no sign of reversing, on the contrary CO2 concentration is still rising exponentially. **
Nonsense as usual. The 1930’s were hotter.
Since the earth has been hotter than this for most of its existence, and the concentration of CO2 has been three or four times as high in the atmosphere, I don’t see that you have a scientific basis for concern. There is obviously no tipping point or the earth would have passed it about 3 billion years ago. The fundamental fact is that we don’t have enough accurate data to justify impoverishing or further impoverishing the world by denying them inexpensive energy just when they need it the most. I am happy to switch over to nuclear for everything except long-distance transportation. Will you support this non-CO2 emitting source of energy?
Loydo, glad you made it to this site. Now you are at least starting to undo the indoctrination you have suffered at the hand of CAGW Alarmist and CO2 worshipers. CO2 is not the control lever now, nor has it ever been in the history of this planet. There is no baked in temperature rise. Thanks for the good laugh today.
Yep Loydo, that 0.0001% increase of CO2 this year into the atmosphere is going to break the Earth’s thermostat and we are all doomed (do I need /sarc?) Try looking for another crisis – there are plenty out there.
Ah yes, the old, it’s gonna kill us one of these days, argument.
A pretty pathetic attempt to explain away the fact that CO2 has had pretty close to no impact over the last 40 to 60 years.
Loydo- just where and how is the “baking in” taking place, and what is the mechanism. You need the data from an observed mechanism, not a climate model.
Don’t bother to look. None of the big names in climate science have discovered any mechanism that causes a small amount of CO2 to cause a large amount of warming. They only use models that run way too hot.
There was a post here a few days ago about a careful examination of the effect of CO2 on the standard atmosphere model, which has proven highly accurate since it was first calculated in 1958. The newest study showed that the effect of CO2 was insignificant- 3rd decimal place or so.
The standard atmosphere model uses physical chemistry, gravity, and height and the concentration of the gases to calculate the pressure using the Gas Law, which has proven bullet proof as a physical calculation can get.
Loydo, you’ve got it completely wrong. In 100 years it will be 1 degree cooler than it is now. I am so sure of that fact that I will bet you $1,000,000 on it. Meet me on the observation deck of the Empire State Building at 6 pm on June 4th, 2119 and we’ll settle up. I’ll be the man wearing one red shoe with a briefcase.
Why would your red shoe need a briefcase?
There is no proofs that cyclical change is no more. This 40 years we have been climbing up from iceage hysteria, which was very real in 70´s. And if you look AMO´s cycles, very soon iceage is again.
This global warming with “unavoidable temperature rise” is very confusing crisis. We can´t feel it, the nature is not collapsing. Everything looks great, the planet is greening, climate isn´t furious armageddon, so no worries at all. But we must be have faith, because climate high priests demand to believe their message.
Demand is not enough to convince us to fear some kind of imaginary horror, because it´s NOT WARMING.
There´s two “drivers” which control climate:
1. Sun, and its cycles.
2. Oceans, and their cycles + they are THE thermostat which keep temperatures in quite narrow range.
CO2 is not the thermostat. It´s just THE effect of warming. Climate”science”woodoo can´t switch causality.
You might want to look up Le chateliers principle. https://en.m.wikipedia.org/wiki/Le_Chatelier's_principle
Global warming feedback is in violation of Le chatelier’s principle and thus in violation of the 2nd law of thermodynamics. Unless you think atmospheric chemistry has nothing to do with chemistry and thermodynamics.
I have researched numerous records that relate to CET and the UK dating back to 1086AD. I would agree that we are currently in a rather benign and stable climate regime as regards weather events although we are at the top end of the temperature range, which has been rising in fits and starts for some 300 years.
some of the past weather events we can trace back certainly were far more dramatic than the ones we tend to get these days.
We are actually at the cold end of the Holocene. The Minoan, Roman, and Medieval warm periods were all warmer though each has been successively colder
And despite all this “unexpected” and “extreme” warming we are still in 6000 years cooling trend.
nobody ever said burning fossil fuel in itself was a bad thing .. though it did kill millions of people by poisoning the air with toxic fumes and substances…
It clearly helped the biggest development and economic growth of the last two centuries.
Nothing wrong with that.
However, we are smart individuals and can see that the level of CO2 in the atmosphere has been raising 10’000 faster than in any previous period, going back 65 millions years.
We also know that the link with global temperature is very solid.
SO, you know, 1 + 1 = 2
All we need to do is simply SWITCH TO A SMARTER NON CARBON BASED energy source.
It’s a very difficult task, but SCIENCE … you know, the thing that got humans on the moon, gave you nuclear power and weapons, quantum physics and in fact computer , gave you antibiotics, and vaccines that saved your ass and are now not saving many kids of young white rich moms, because they are literally stupid … all those thing that makes 99.99% of the daily aspects of your life … yeah that science is telling us … this isn’t going well and isn’t going well very fast.
So, since WE ARE NOT STUPID, ARE WE? we will just switch to better form of energy and make a ton of cash in the process.
I am not sure why you climate change denialists are so freaked up about throwing away an amazing $5T opportunity …
Then again, you don’t sound very smart to start with … perhaps it has to do with it
“though it did kill millions of people by poisoning the air with toxic fumes and substances”
Where and when?
I suggest that you take a look a any Life Expectancy Graph for any Developed Country to realise that is complete rubbish.
It is those very Carbon Based Fuels that have brought about that increase in life expectancy and would do the same for all the undeveloped coutries as well.
So you don’t sound even a smidgen smart.
“though it did kill millions of people by poisoning the air with toxic fumes and substances”
Where and when?
I suggest that you take a look a any Life Expectancy Graph for any Developed Country to realise that is complete rubbish.
It is those very Carbon Based Fuels that have brought about that increase in life expectancy and would do the same for all the undeveloped countries as well.
So you don’t sound even a smidgen smart.
1) Killing millions? Where, when?
2) 10,000 times faster? Considering the fact that most of those proxies have resolutions in the 1K to 100K range, how would you know?
3) Even if 2 was true, which it isn’t, you still haven’t demonstrated that more CO2 in the atmosphere is a problem.
4) What’s smart about replacing a safe, reliable, clean and affordable energy source, with one that is none of those?
5) Denialists? Why don’t you just hang a sign around your neck advertising your inability to actually think for yourself?
“””So, since WE ARE NOT STUPID, ARE WE?”””
Yes, you believers are stupid. There´s nothing to be worried about climate. But you, as a believer, should check your mental health, because you are seeing things which are not related to reality.
Nobody here is climate change denier.
You are science denier. Your daydreams are not science. Your preachers has put redgreen religion in your head, and you accept all propaganda as truth.
SO, you know, science denier + stupid = 2.
That´s how science works.
In the Cretaceous , the CO2 was about 6x what it is today. Vostock ice cores show higher Temperatures in the past and Crabon Dioxide lags temperature. Yes climate varies, the Pleistocene proves it as does the various warm periods and little ice ages in the Holocene.
Comuter modelling has not accurately predicted temperature since 1998. Anyone involved in modelling the natural environmment knows the problems.
Carbon provides cheap reliable and storable energy . What kills people is bad sanitation leading to disease. Coal powered pumps removing sewage from London saved lives. The construction of canls , then railways to move caol and then ships and pipelines to move has reduced the cost of food and warmed people. I suggest people read G M Trevlyan’s Social History of England to see how cheap cheap coal supplied by canals enabled the poor to warn themselves when firewood had become scarce.
At this rate, 100 years of warming will be wiped out in 10 months. Maybe the world will not end in 11 years after all.
Might take a little longer than 10 months though as a fairly strong El Nino is currently building and will surely have an effect on the temps for the next several months
So we had a pretty cold May here in North America, and Australia was having a cold May, and Europe was having a cold start to May too…but somehow the rest of the world made up for it…right…
I bet you get your sense of the size of the USA and australia from a mercator projection
Mosher, stop behaving like a little child
Asking a leopard to change his spots?
The US and Australia are made to look smaller in the Mercator projection. Canada / Russia / Greenland look bigger.
Just the latest fact free denigration from Steven Mosher.
steven mosher
What size your sense is? Pinpoint perhaps?
Well, a nitpicker anyway.
The detailed data showed that “USA48” was at -0.61 C, which would reflect the fact that May seemed unusually cold and wet in many areas of the United States. It’s possible that there was unusually warm weather over the oceans or the poles, where few people would notice.
Steve Z
“It’s possible that there was unusually warm weather over the oceans or the poles, where few people would notice.”
What about starting with USA49 in a few days, when Roy Spencer publishes the data?
https://www.nsstc.uah.edu/data/msu/v6.0/tlt/uahncdc_lt_6.0.txt
You could then continue with the surface data for lots and lots of countries, ‘where some more people’ would notice:
ftp://ftp.ncdc.noaa.gov/pub/data/ghcn/daily/
Pete,
So a re you saying UAH is wrong…. too?
May was not cold in Australia.
“May was warmer than average for Australia as a whole, with the national mean temperature 0.65 °C above average.”
Look NASA has the exact same numbers as Roon Spicer on there site
https://climate.nasa.gov/
Down 0.12 from April.
Remind me again, how close to the 1.5 degree C warming that the alarmists claim will trigger a point of no return.
After 4 decades of UAH we are running at about +1.3C per century.
Enjoy it while it lasts.
Somehow that suppose to be a the end of the world, do the CAGW crowd not understand it will it the present trend continues it will take three centuries to get to the temperature the world was at eight thousand years ago.
Did you just make that up?
It’s climate science ™ … all facts are made up.
Just because it’s not in this weeks talking points memo doesn’t mean it isn’t true.
Why do you have the need to show your ignorance in every comment? Is it just pure obsession to point your stupidity to everyone?
Not everyone seems to agree that this was an up year:
https://realclimatescience.com/2019/06/coolest-wettest-october-may-in-us-history/
Depends where you want to pick a site, or if you are a climate witch-doctor you just take an average which is meaningless.
That’s USA only, and using dubious calculations.
UAH shows the October – May average anomaly for the USA48 as -0.11°C, which makes it the 18th coolest such period since 1979.
This has been the coldest wettest Spring where I live in Michigan ever recalled in my mind.
We may even have a crop crisis; barely anything is growing if it was planted. Most fields are still heavy mud.
DRoberts
I just downloaded GHCN daily again, thus having March, April and May on stock.
Here is the ‘cold’ top 30 of a trace from all MI station anomalies wrt 1981-2010 since 1950 for these three months:
MI_SANDUSKY___________________ : 1980 3 -8.56
MI_KENT_CITY_2_SW_____________ : 2014 3 -8.50
MI_COPPER_HARBOR_FT_WILKINS___ : 1976 5 -8.19
MI_TAHQUAMENON_FALLS_SP_______ : 2014 3 -7.96
MI_HERMAN_____________________ : 2014 3 -7.82
MI_CHARLEVOIX_________________ : 2014 3 -7.77
MI_GAYLORD____________________ : 2018 4 -7.71
MI_WATERSMEET_________________ : 1984 3 -7.51
MI_FLINT_BISHOP_INTL_AP_______ : 1960 3 -7.44
MI_MUNISING___________________ : 2014 3 -7.39
MI_GULL_LAKE_BIOLOGICAL_STN___ : 1960 3 -7.38
MI_VASSAR_____________________ : 2014 3 -7.23
MI_NILES______________________ : 2018 4 -7.12
MI_BAD_AXE____________________ : 1960 3 -7.10
MI_PETOSKEY___________________ : 2014 3 -7.10
MI_EAU_CLAIRE_4_NE____________ : 1960 3 -7.05
MI_NILES______________________ : 2014 3 -7.03
MI_KALKASKA___________________ : 2014 3 -7.02
MI_GAYLORD____________________ : 2014 3 -7.00
MI_IRONWOOD___________________ : 1980 5 -6.95
MI_DETOUR_VILLAGE_____________ : 2014 3 -6.92
MI_LANSING_CAPITAL_CITY_AP____ : 1960 3 -6.91
MI_BERGLAND_DAM_______________ : 2014 3 -6.89
MI_ALBERTA_FORD_FOR_CTR_______ : 2014 3 -6.87
MI_BALDWIN____________________ : 2014 3 -6.87
MI_VANDERBILT_11ENE___________ : 2014 3 -6.84
MI_COPPER_HARBOR_FT_WILKINS___ : 2014 3 -6.78
MI_BIG_RAPIDS_WTR_WKS_________ : 2014 3 -6.77
MI_KENT_CITY_2_SW_____________ : 2018 4 -6.71
MI_ADRIAN_2_NNE_______________ : 1980 4 -6.68
2014 is by far the most referred year in the list.
The first value for 2019 appears at position 57:
MI_ALBERTA_FORD_FOR_CTR_______ : 2019 4 -6.26
But indeed that was, with over 6 °C below a 30 year average, cold enough 🙂
Well here in Ottawa we are having another COLD summer and lots of spring floods and we had another tornado and the media is yapping on about global warming er … climate change.
Robert message me on Twitter
Don’t forget: actual snow on the ground in Algonquin Park this weekend…
In Ironwood, Michigan (46°27’56.2″N 90°11’21.1″W), May 1980 was about 6 °C lower than the 1981-2010 average. That’s a lot 🙂
well guys if you look at the 2019 data -kindly posted in the article – you can see the USA is down .
It has gone down. Just like climate does. It gets warmer then colder.
Comparing all of the Months of May in the LT record, US48, this was the 6th coldest.
In order, coldest up:
Year Anomaly
1983 -1.5
1995 -.92
1990 -.88
1979 -.72
1981 -.7
2019 -.61
Unless you have done a fair bit of work on those numbers, they are “wrong” – note the anamoly for this May uses the average to 2010, which us obviously a different average for tears before 2010.
Phoenix44: Sorry, nice try. The anomaly figures for the entire UAH dataset are calculated (by UAH) using the ’81-’10 baseline. I did not do any work on the numbers at all, other than to select the months of may, and to sort them low-to-high. You can duplicate the analysis with the tables provided in the initial post.
That’s stupid comment. All anomalies are calculated from a reference point or baseline. If you change the baseline (to earlier years, or whatever), all it does is move the baseline “up” or “down.” The anomaly value will change, but the relative order and difference between the listed anomalies will remain the same.
Comment in reply to Phoenix44, not Steven Fraser.
USA corn and soybean planting lagging waaaay behind average for 2019, due to cold, wet weather.
See corn planted % by state for June 2 2019 here: https://www.agweb.com/corn-planting-map/
See soybean planted % by state for June 2 2019 here: https://www.agweb.com/soybean-planting-map/
Thanks for that. Off to a slow start.
It is starting to get serious. The fields have been and many still are are just too wet. Heck, I have been having a hard time keeping up on mowing my lawn because it’s been too wet. It seems that the majority of fields in N. Indiana and Ohio have yet to be cultivated, let alone planted, based on what this truck driver has been seeing during my recent runs and here where I live here 30 Mi NNE of Indianapolis. Usually by this time I’m seeing corn sprouts but very few fields show anything sprouting. Later planting skews the planting towards more soybeans and less corn being planted.
It’s worst up here 110 miles north of Indy and with the forecast wet coming from the TD in the Gulf later in the week it ain’t going to get better anytime soon. I’m wondering where all the corn for ethanol is going to come from this year…..
It’s worst up here 110 miles north of Indy and with the forecast wet coming from the TD in the Gulf later in the week it ain’t going to get better anytime soon.
Saturday I drove the whole N-S length of Lower Michigan and there isn’t much planted or sprouted there either.
I’m wondering where all the corn for ethanol is going to come from this year…..
rah
And we experienced last year in northeastern Germany a truly centennial summer. With such a harsh combination of warmth and drought that maize didn’t grow much above 1 meter on average (instead of 2), and we needed 250 % more water in the garden than in the years before to keep it alive.
This year, no maize was planted again 20 km around us, the farmers learned quickly how useless it is.
But keep cool, the Globe’s average surface temperature still is about 15 °C. Perfect.
El Nino refuses to let go. As soon as the coldwater pool reached the surface another Kelvin wave made its way across the Pacific and slowed the equatorial current once again.
It’s been the MJO v Pacific and the MJO has been winning, but once it swings the other way I bet that strong La Nina will finally form.
This was not surprising as the Arctic warming influence tends to be less during the NH summer. The current El Nino is still going strong which accounts for the slightly elevated level over the 21st century baseline (around .17).
If the El Nino ends soon I expect to see this value trend downward to the baseline if not slightly below. That would indicate no climate warming at all in the 21st century. Once might even call that a plateau/pause/hiatus.
Richard M
“If the El Nino ends soon I expect to see this value trend downward to the baseline if not slightly below. ”
Exactly that you tell us since at least a year. You remind me Salvatore del Prete.
Me thinks you’ll have to be patient: the last negative UAH6.0 LT anomaly was in… march 2012, after a strong La Nina (26 months in sequence) with a MEI drop down to -2.43 in Jun/Jul 2010.
“Exactly that you tell us since at least a year”
Late last summer, before the El Nino got going, the temperature dropped down to the baseline exactly as I predicted. It is heading that way again. Are you in ENSO denial?
“Late last summer, before the El Nino got going, the temperature dropped down to the baseline exactly as I predicted.”
I just told you above that the last month with a value “down to the baseline” was March 2012.
You seem to be in serious UAH data denial.
Your ‘predictions’ aren’t the pixels worth Firefox needs to display them, Richard M, and I’m sure you know that, and I’m sure you nevertheless will repeat them all the time.
Sorry to point out reality to someone who is clearly delusional, but the Sept 2018 anomaly was only .13. That is actually below the 21st century baseline.
Hands up those who get up every morning and don’t check out the temps from around the globe to decide what to wear? Fess up now all you climate deniers.
No need to check the GTemps. So cold here (Southern Australia) that I went to bed wearing socks (don’t like central heating) and I still have them on at 3.00pm.
Mike
Isn’t it winter in Southern Australia in June?
Here in Germany we have 21 °C at 01:11 AM (UTC+2).
Small El Nino is heating up the figures.
http://www.bom.gov.au/climate/enso/outlook/
The Arctic is hot or less cold-due to a minor “heat” out break from -13 to -8 deg C in the beginning of May.
It looks like this: http://ocean.dmi.dk/arctic/meant80n.php
Moderate warming since 40 years. 0,4°C means about 1,0° per 100 years – if the trend remains stable. I bet there will be a climate change ( to cool temperatures) somtime in the future, but thats speculations.
Marty wen you say “but thats speculations.” at least you are honest, we certain cannot say that about most “climate scientist” . I would also add in you guess is as good as theirs. We do not have satellite data running long enough but out land base measurement that are unadjusted certain show a warm cooling cycle.
Such complacency here. Do people not know that the UK has declared a national climate emergency and that Devon , Cornwall, Dorset and Cheshire have announced a local emergency on top of the national emergency.
We are, folks , on a war footing here, to save the planet (again! why is it always us who have to do it?)
If you are planning on visiting bring plenty of food , we will soon be issuing ration books . Oh and petrol will be on vouchers of course so don’t expect to hire a car unless you are a civil servant , a member of the police or armed services or a minister of religion (to extrapolate from last time).
In fact you may be better off going to France , Italy , Spain, Greece . No emergencies there and plenty of sun .
Drizzling rain and cold here in Cheshire – thanks to our emergency action conducted in the nick of time .
While here on the east coast of Scotland we are all praying that global warming kicks in soon. Buds were at least a month later on the trees than 2 years ago and temps been struggling to get into the low teens (c) many places not affected by UHI.
You cannot really conflate things that politicians are doing with what is actually happening. Because of course politicians always have our best interest in mind, and they never have ulterior motive. And politicians are all really smart individuals.
Is he under influence of something forbidden?
Always fun comparing Australia’s UAH, as above, with the national mean temp anomalies of the BoM’s ACORN network …
Year UAH ACORN
Jan 2018 0.52 1.59
Feb 2018 0.35 0.90
Mar 2018 0.76 1.15
Apr 2018 0.84 2.48
May 2018 -0.24 0.26
Jun 2018 -0.41 0.36
Jul 2018 1.49 1.37
Aug 2018 0.37 0.03
Sept 2018 0.28 0.75
Oct 2018 0.43 1.96
Nov 2018 0.55 0.93
Dec 2018 1.20 2.13
Jan 2019 1.15 2.90
Feb 2019 0.05 1.38
Mar 2019 0.59 2.08
Apr 2019 0.91 1.35
May 2019 0.39 0.64
I believe above are ACORN 2, which was made available from December 2018 to replace ACORN 1, but never officially announced by the bureau. It’s a bit difficult to tell what’s what because one platform on the BoM’s website presents Australia’s official temperature history in ACORN 2, and another platform on the same website presents an entirely different temperature history in ACORN 1. Of course, there’s also the third platform of raw temperatures where accuracy is also dodgy but has the temps that the two homogenised datasets are essentially based on.
Don’t forget that according to the bureau’s official ACORN 2 report, Australia’s mean temp per decade warming trend of ACORN 2 from 1910 to 2016 (0.123C) was 23% warmer than ACORN 1 (0.100C) and 53.7% warmer than RAW (0.080C).
Chris Gillham
“Always fun comparing Australia’s UAH, as above, with the national mean temp anomalies of the BoM’s ACORN network …”
Why do you think that it would be meaningful to compare a little piece of the Globe with the little piece of troposphere above it?
Imagine you would make the same comparison for the Arctic or Antarctic regions.
And Chris, they still use 1961 – 1990 baseline, which as you pointed out, has been adjusted mercilessly.
According to some pundits the global warming hiatus (pause) started around 1990, surprisingly there is an odd relationship between UAH and solar activity since then. Remember, the curiosity killed the cat, just don’t go there
http://www.vukcevic.co.uk/UAH-SSN.htm
🙂
Hi mod
Just to mention, here I posted at 3.09am a comment relating to UAH – SSN, while the comment that appeared here wasn’t even written at that time, and it was posted about an hour later (4.11am) at a place further above as a reply to Joe Jarrett, and it is also there as intended. AFAIK, there was noting offensive in the comment or against house rules, so I may attempt to post it again in few hours time.
Please note that his is not a complaint, I understand there are lot of comments you have to go through and your work and tolerance is greatly appreciated. All the best wishes to you and your colleagues. vukvevic.
Mod, my apologies, by closing browser and starting again correct comment appeared.
Nearly every comment I make is delayed before it appears, and that has been true for months on end now, and it seems to be getting worse.
I am very curious if there is anyone who posts that has their comments appear immediately after the post it?
The funny thing is, every once in a while, a post of mine does appear immediately, which makes me think it is not a stuck in moderation problem.
Anyone?
One day (not far away) the above relationship will be explained and hopefully make sense . just take note of this image :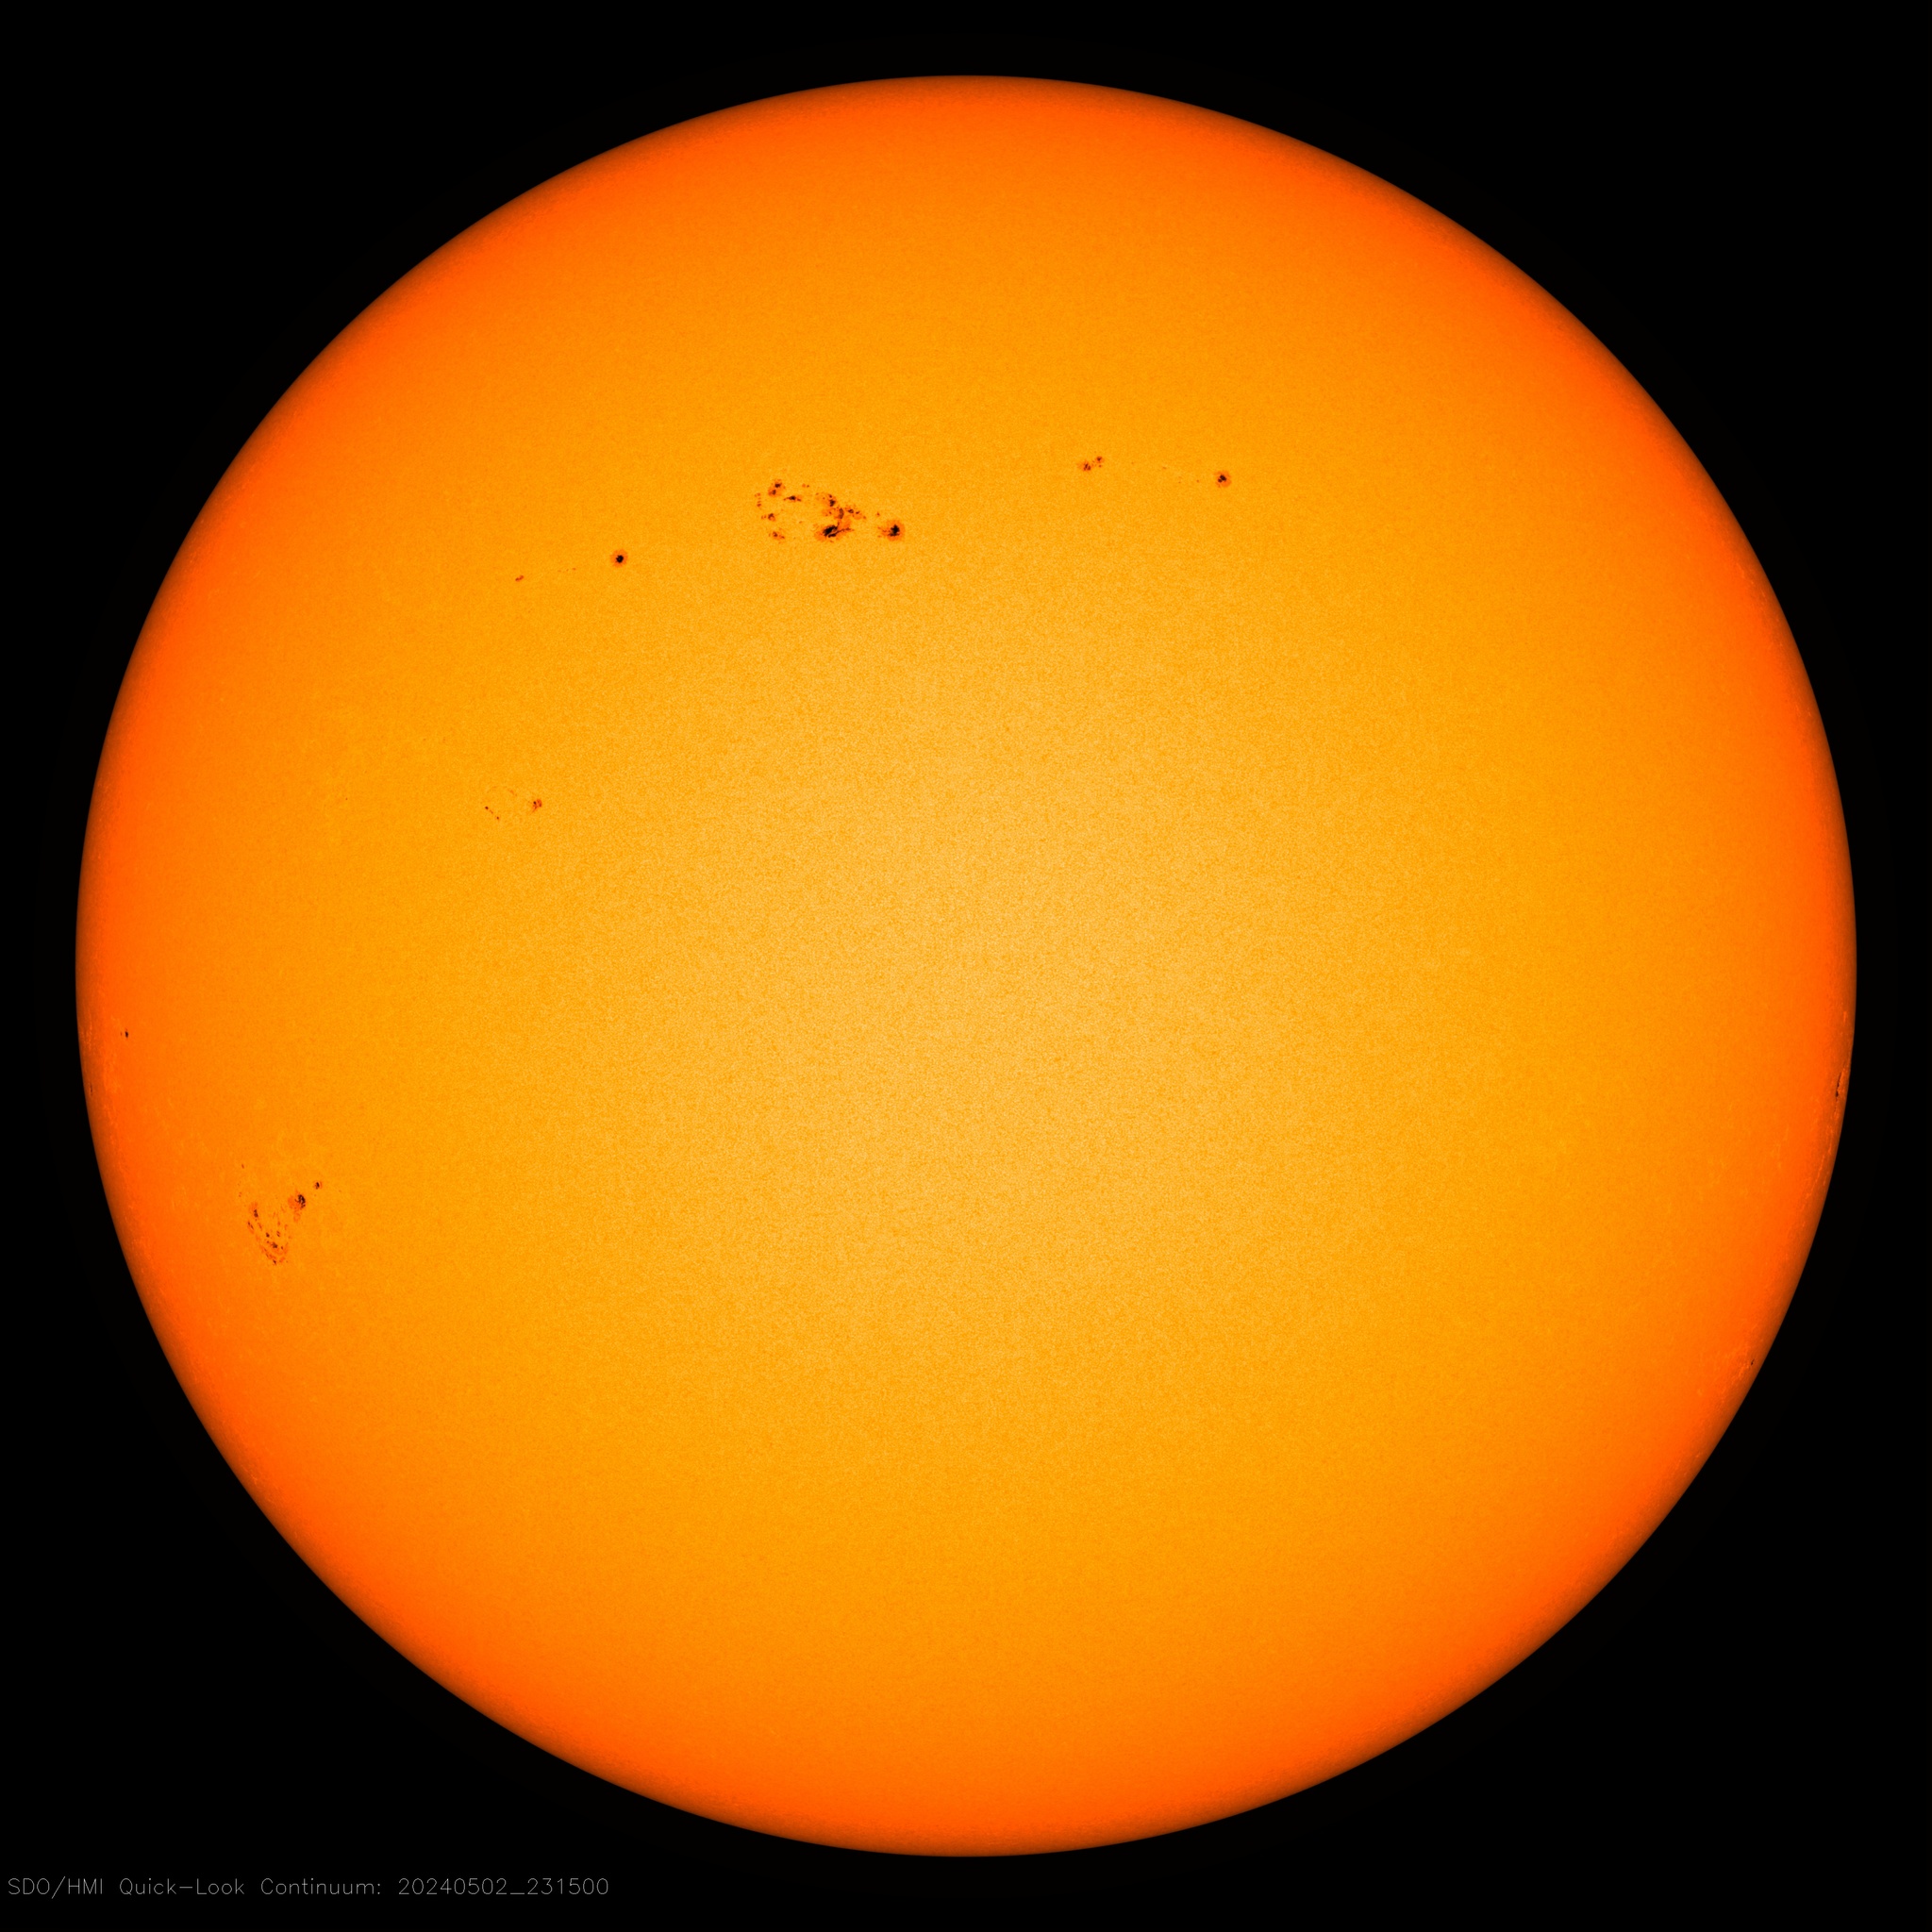
Why still so warm? After that el nino I would have thought it would have got much colder, like after ’99, what is holding it up?
Matthew,
It did get cooler and cooler after the 2016 El Nino right up to another weak El Nino which showed up last fall. I realize that not every country has officially declared it to be an El Nino, but the warming of the Nino 3.4 area is clear. This is why the tropics have seen elevated temperatures since last summer.
After the 1998 El Nino we had a strong 3 year La Nina. This time we have only seen a couple of short, weak La Nina episodes. Some believe we are overdue for a strong La Nina and that could happen soon. If that happens then you will be able to compare it with 1999.
Matthew, earth’s temp cycles up and down — there’s never any static “optimum”. Apparently now, it’s in the up cycle. IMO, any more distance put between now and glacial-temps is a very good thing.
“…any more distance put between now and glacial-temps is a very good thing.”
Yes. Oui. Ja. Si. Da.
The problem might rather be that too much warming could be the best precondition for what we both would like to be avoided.
For the last year it has been the Arctic that has been the big plus anomaly and what does that tell us, it tells us that as the warmth is in the Lower Atmosphere and it has left the the planet.
It shows the heat exchanger is working well to shift any warmth coming out of the tropics & Oceans.
Pollen studies in Northern Russia and Northern Europe found plant species requiring 3 to 9 degrees warmer to survive during the Holocene Maxima 5000 t0 9000 years ago. There is so much evidence that AGW is a hoax yet governments exuberantly march to the beat. Why is this.
It is my understanding that during the last ice age atmospheric concentration of CO2 was approximately 4,000 ppm. Is this correct or not? If it is, then doesn’t that put a serious dent in the AGW theory?
It would leave another amongst the many dents already there. Like you I thought the same but one of the admirable contributors to sites like this one seemed to suggest ice core gas measurements were not reliable. Can an expert help?
It’s not correct. CO2 concentrations during the last ice age were probably closer to 200 ppm.
CO2 hasn’t been at 4000 ppm for 100s of millions of years.
Check the temperature forecast before going out.
Of course.
I like it when it is room-temperature outside.