Antarctica consisted of a large Eastern ice sheet, a smaller Western ice sheet and the Antarctic peninsula. The Eastern ice sheet has been slightly gaining ice from 1992, but the Western ice sheet mass trend is more uncertain.
A new paper published in Geophysical Research: Atmospheres, presents a reconstruction of the surface mass balance (SMB) over the West Antarctic Ice Sheet (WAIS) spanning 1800-2010. The study is based on ice core records combined with a European reanalysis model and a regional climate model.
The results show a significant negative trend of -1.9 ± 2.2 Gt/yr over the WAIS during the 19th century but a significant positive trend of 5.4 ± 2.9 Gt/yr between 1900 and 2010. In contrast, the Antarctic Peninsula (AP) shows opposite SMB trends to the WAIS trends with different signs in the 19th and 20th centuries. The study compared the trends to large-scale atmospheric oscillations. The SMB in the AP and WAIS are significantly correlated with the Southern Annular Mode (the north–south movement of the westerly wind belt that circles Antarctica), but the correlations are unstable.
Abstract
High‐spatial resolution surface mass balance (SMB) over the West Antarctic Ice Sheet (WAIS) spanning 1800‐2010 is reconstructed by means of ice core records combined with the outputs of the European Centre for Medium‐range Weather Forecasts “Interim” reanalysis (ERA‐Interim) and the latest polar version of the Regional Atmospheric Climate Model (RACMO2.3p2). The reconstruction reveals a significant negative trend (‐1.9 ± 2.2 Gt yr‐1 decade‐1) in the SMB over the entire WAIS during the 19th century, but a statistically significant positive trend of 5.4 ± 2.9 Gt yr‐1 decade‐1 between 1900 and 2010, in contrast to insignificant WAIS SMB changes during the 20th century reported earlier. At regional scales, the Antarctic Peninsula (AP) and western WAIS show opposite SMB trends, with different signs in the 19th and 20th centuries. The annual resolution reconstruction allows us to examine the relationships between SMB and large‐scale atmospheric oscillations. Although SMB over the AP and western WAIS correlates significantly with the Southern Annular Mode (SAM) due to the influence of the Amundsen Sea Low (ASL) and El Niño/Southern Oscillation (ENSO) during 1800‐2010, the significant correlations are temporally unstable, associated with the phase of SAM, ENSO and the Pacific decadal oscillation (PDO). In addition, the two climate modes seem to contribute little to variability in SMB over the whole WAIS on decadal‐centennial time scales. This new reconstruction also serves to identify unreliable precipitation trends in ERA‐Interim, and thus has potential for assessing the skill of other reanalyses or climate models to capture precipitation trends and variability.
Where are the graphs? After so many years, if it isn’t in a picture I can’t handle it anymore..☹️
Still under embargo. Reconstruction stuff is never to be given high credibility.
However, here is something else instead to have a go at.
Am I interpreting your graph correctly that it shows that when people say the Antarctic is into negative SMB, they are really saying that the West Antarctic is the only part losing mass?
It appears to be so, if we accept that the data is accurate enough.
If the trend could be zero, how could it be significant? Just asking.
If your fluff factor (+/- 2.2) is greater than your calculated end figure (-1.9) then the measure is essentially zero point zero
“5.4 ± 2.9 Gt/yr”, isn’t much better.
At least it implies a gain (+2.5 to +8.3 Gt/yr), rather than “may be a loss, may be a gain, we’re not sure” of ‐1.9 ± 2.2 Gt (-4.1 to +0.3 Gt/yr).
Actually, not true.
The variance may be high, but the trend-line still remains. Both are calculated with well-defined statistical relevance evaluating formulæ. Having a variance greater than the mean trendline is not at all unusual especially in geophysical and climate field data analysis.
Just saying,
GoatGuy ✓
The results show a significant negative trend of -1.9 ± 2.2 Gt/yr over the WAIS during the 19th century but a significant positive trend of 5.4 ± 2.9 Gt/yr between 1900 and 2010.
So worst case scenario over the century of 1800’s, WAIS lost -1.9 + -2.2 = -4.1 Gt/yr or -410 Gt/Cen. loss
While the Best Case scenario over the 1900’s the WAIS gained 5.4 + 2.9 = 8.3 Gt/yr or +830 Gt/Cen. gain.
Looks like the last century potentially doubled in gain what was lost in the prior century
I see that as a Net Positive outcome
Humans did not cause the temperature rise, so the increase is Antarctic ice sheet mass is neither positive or negative from the standpoint of arguing about CAGW.
There are no graphs, as the observation is the Antarctic continental ice sheet increased in mass when it got warmer rather than decreased, is off message for the cult of CAGW.
In very cold locations it must warm up to snow.
When it is warmer in the high latitude Southern hemisphere there is more snow on the Antarctic ice sheet.
The Antarctic peninsula is warmer than the Antarctic ice sheet as it is outside of the Antarctic polar vortex which blocks warm air from the Southern ocean.
https://en.wikipedia.org/wiki/Climate_of_Antarctica
The mean annual temperature of the Antarctic interior is −57 °C (−70.6 °F).
The coast is warmer; on the coast Antarctic average temperatures are around −10 °C (14.0 °F) (in the warmest parts of Antarctica) and in the elevated inland they average about −55 °C (−67.0 °F) in Vostok.[12][13] Monthly means at McMurdo Station range from −26 °C (−14.8 °F) in August to −3 °C (26.6 °F) in January.[14]
At the South Pole, the highest temperature ever recorded was −12.3 °C (9.9 °F) on 25 December 2011.[15]
Along the Antarctic Peninsula, temperatures as high as 15 °C (59 °F) have been recorded,[clarification needed] though the summer temperature is below 0 °C (32 °F) most of the time.
Severe low temperatures vary with latitude, elevation, and distance from the ocean. East Antarctica is colder than West Antarctica because of its higher elevation.[citation needed] The Antarctic Peninsula has the most moderate climate. Higher temperatures occur in January along the coast and average slightly below freezing.
The mean average temperature for East Antarctica (or Greater Antarctica), Antarctica is listed as minus 81 degrees F. The high is listed as minus 77 f and the lowest is listed as minus 84 f. I found this at: https://www.timeanddate.com/weather/@6632511/climate
Temperatures are only one aspect of ice loss/accumulation anyway. Warmer temperatures can mean higher ocean temps and increased snowfall, while air temperatures are still below freezing and result in very little ice loss.
I live in Western Canada. In the winter snowfall is greatest around -20 to -25C. When it gets much colder the air is too dry to carry any significant amount of moisture and there is rarely snow when its that cold. The snow just blows around as fine powder.
* In order to make that claim, you have to prove that CO₂ actually warms water.
* Then you have to prove that man’s 4% CO₂ contribution to global CO₂
* After which, you have to prove that this miniscule amount is sufficient to warm the circum-Antarctica current higher than normal to melt ice.
The results show a significant negative trend of -1.9 ± 2.2 Gt/yr
=========
Not. The trend could be positive or negative given the error bounds.
Not really, Ferd.
The highest probability is at –1.9 Gt/a. A lower probability is at –1.4 Gt/a. A lower yet probability at –0.7 Gt/a. A small, but still significant probability at ⊕0.1 Gt/a. Likewise, in the opposite direction. A small but still significant probability at –4.0 Gt/a.
Just saying,
GoatGuy ✓
Don’t agree, GoatGuy. You are right about the probabilities, but the issue is trend. The most that could be said is that the trend is probably negative (but may, in fact, be positive). The assertion that it is a significant negative trend is just wrong (maybe the wording should be, “probably a negative trend whose value could be significant.”).
Any statistic with those error limits is worthless, pure and simple, in practical terms. Argue what you like in the Common Room at lunch, where hot air is free and cheap…..Brett Keane
The only way Antarctica gains or loses ice is via snow fall and calving of icebergs. Surface Mass Balance is peanuts. So the gaining or losing of mass that the Grace satellites or other studies are showing is largely a result of calving icebergs and snow that fell years, decades, centuries or millennia ago. Antarctica melting is one of those memes that isn’t true. Antarctica is well below freezing nearly everywhere nearly all of the time.
Surface mass balance is snowfall minus melting and sublimation. Melting is insignificant except in the Peninsula. Snowfall and sublimation are not.
tty May 6, 2019 at 10:55 am
Surface mass balance is snowfall minus melting and sublimation. Melting is insignificant except in the Peninsula. Snowfall and sublimation are not.
And since melting is insignificant, global temperature doesn’t have much to do with SMB.
Thanks for the reply.
I have read somewhere else that in order for all of the polar ice to melt, including Antarctica,the earths atmosphere would have to increase to something like TWICE that of the sun! Should that ever happen, WE would not e concerned with it!
Sublimation increases as temperature increases.
Hmmmm….
Cyclical trends in a cyclical world?
Two quotes grabbed my eyeballs right away:
1) “The study is based on ice core records combined with a European reanalysis model and a regional climate model”
OBSERVATION: That sounds a lot like a “study” based on 2 computer models (one of which is a regional climate model), which is probably either “hooey times 2” or “hooey squared”.
2) “The SMB in the AP and WAIS are significantly correlated with the Southern Annular Mode (the north–south movement of the westerly wind belt that circles Antarctica), but the correlations are unstable”.
OBSERVATION: Not being a “SMB in the AP and WAIS” scientist, but “…significantly correlated…but the correlations are unstable” sounds exactly like “not well correlated”.
A reanalysis model is not quite the same as a GCM. A reanalysis model is essentially the same as the models used for weather forecasts, though it “forecasts” the weather at zero time, i e it uses actual weather data to calculate the weather between observation sites. It is generally a lot more reliable than a GCM, but in Antarctica where there are no continuous weather records before 1957 in most parts of the continent it will still be quite uncertain.
Still, Javert has a point that the models used are based upon assumptions; since they are unable to measure or observe the glaciers melting from underneath by the ocean.
Odds are that they did not take into account volcanic influences under the WAIS… Yet, their model still has WAIS losing mass.
Excellent posting! What appears to be a resonably conducted review that shows no AGW signal detectable against the noisy background of normal variance. Good catch, Anthony!
Please note: “This new reconstruction also serves to identify unreliable precipitation trends in ERA‐Interim, and thus has potential for assessing the skill of other reanalyses or climate models to capture precipitation trends and variability.”
Plain language: “The models are wrong.”
Ok, can someone translate this for me.
(‐1.9 ± 2.2 Gt yr‐1 decade‐1)
Is it -1.9 and maybe +.3?
Is the margin of error actually larger than the calculation, or am I just confused again.
The most probable result is -1.9, and the probability that it is somewhere between +0.3 and -4.1 is 95 %.
Why does the S Pole marker have to be reset by about 30 feet every year….?
Must be a lot of ice lost at the terminus/face of that ice sheet for the S Pole marker to move 30 feet every year. The Antarctic must be melting away.
Oh wait….
Because the South Pole is not on an ice divide:
The black lines in the blue areas are ice divides. Markers placed therewon’t move. Everywhere else the ice is always moving.
Indeed. But why? Think….
Asking your question again after the marker moves 12,500 miles is probably pointless.
Let’s not forget that in October 2015, NASA issued a report based on ICESAT data showing the Antarctic Land Ice Mass was INCREASING at around 80 GT/year….
That report didn’t fit the CAGW narrative at all, so it was quickly ridiculed by Leftists, and a “new and improved” report was released suggesting it’s actually losing ice mass “at an unprecedented and dangerous rate and we’re all gonna die…fixed…
Leftists “can’t handle the truth…”
To put this in perspective, the claimed measurement(or reanalysis?) is accurate to 1 in 10,000. I am sceptical of that claim.
Just show the un-skeptical public some pictures of some starving emaciated “WAIS” polar bears…
They’ll believe anything if it comports with a preconceived bias.
And starving, emaciated Arctic Penguins.
The elusive Alaskan Emperor Penguin… ummmm, now that’s good eatin’.
Buffalo-style of course.
Get it at your local Christians-only Chick-Filet.
Ask for the penguin chicken wing special with pork-flavor sauce to keep the Muslims away.
//All sarc of course/
The wit only goes half-way, Joel. And I’m an Atheist.
All those volcanoes under West Antarctica cannot be doing the ice and snow accumulation any good.
The new Geophysical Research study and the 2018 Nature study linked in the first sentence seem to be measuring ice sheets in alternate universes.
The GR study finds “a statistically significant positive trend of 5.4 ± 2.9 Gt yr‐1 decade‐1 between 1900 and 2010.” The Nature study finds that during 1992-2017, Antarctica as a whole “lost 2,720 ± 1,390 billion tonnes of ice” while in Western Antarctica, ice loss increased from 53 ± 29 billion to 159 ± 26 billion tonnes per year. So the Nature study seems to say the WAIS is losing up to 30 times as much ice per year and the GR estimates per decade.
Moreover, the Nature study suggests that ice loss from East Antarctica (~2.7 trillion tons) is orders of magnitude larger than the gains (5.4 billion tons/decade) GR estimates for Western Antarctica.
IF ANYONE CAN SORT THIS OUT, PLEASE DO!
See my comment elsewhere. The first thing to parse is that SMB is not a total measure of ice loss, it does not include ice discharge to the oceans. So GR study is talking about SMB, Nature quote is about total ice.
Quick notes:
* Reminder that SMB is treated separately from ice discharge (calving etc). The paper here is not saying that WAIS net gained total ice.
* Not a lot here specifically relevant to assessing AGW. Has to do more with precipitation. This paper is saying that previously SMB rate didn’t look like it changed a lot, now a significant trend of gaining mass (more precipitation, vaguely consistent with AGW expectations as water vapor increases with warmth).
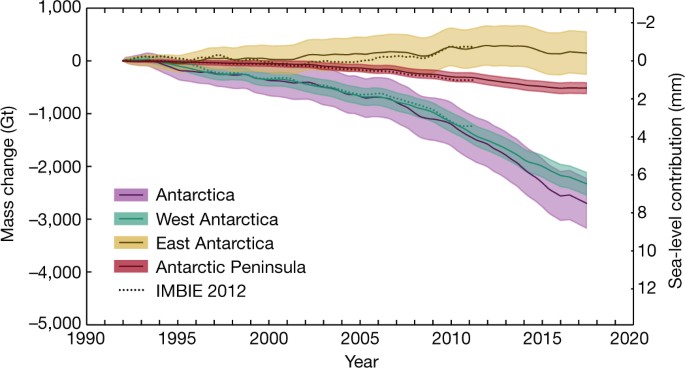
* Net ice melt off of WAIS is of course accelerating significantly, as it is off of Greenland. Anthony mentions the IMBIE study at top of article to say increasing SMB in East Antarctica, but that paper’s abstract focuses on West Antarctica (click link) and reports an increase of ice loss from “from 53 ± 29 billion to 159 ± 26 billion tonnes per year”:
“Here we combine satellite observations of its changing volume, flow and gravitational attraction with modelling of its surface mass balance to show that it lost 2,720 ± 1,390 billion tonnes of ice between 1992 and 2017, which corresponds to an increase in mean sea level of 7.6 ± 3.9 millimetres (errors are one standard deviation). Over this period, ocean-driven melting has caused rates of ice loss from West Antarctica to increase from 53 ± 29 billion to 159 ± 26 billion tonnes per year; ice-shelf collapse has increased the rate of ice loss from the Antarctic Peninsula from 7 ± 13 billion to 33 ± 16 billion tonnes per year. We find large variations in and among model estimates of surface mass balance and glacial isostatic adjustment for East Antarctica, with its average rate of mass gain over the period 1992–2017 (5 ± 46 billion tonnes per year) being the least certain.”
For reference here is a recent paper on Greenland melt acceleration:
Mouginot et al 2019, “Forty-six years of Greenland Ice Sheet mass balance from 1972 to 2018”
“The mass balance started to deviate from its natural range of variability in the 1980s. The mass loss has increased sixfold since the 1980s. Greenland has raised sea level by 13.7 mm since 1972, half during the last 8 years.”
https://www.pnas.org/content/early/2019/04/16/1904242116
Graphic here (see lower right for total):