This is a quick introduction to the 2019 paper The “Ocean Stabilization Machine” May Represent a Primary Factor Underlying the Effect of Global Warming on Climate Change by Mao et al. (pdf here). I believe many visitors here would find interest in their projected decrease (yup, decrease) in global land surface temperatures by the early 2100s and their conclusion that the recent global warming may have occurred primarily through natural factors.
Global cooling? I’m against it. Considering how cold it was outside my home this morning (about -18 deg C, or roughly 0 deg F), I’m glad I have a fossil-fuel-powered heating system. Brrrr.
A recent post New Paper: Modern Warming Was Driven By ‘Primarily Natural’ Factors. Global Cooling Has Now Begun. authored by Kenneth Richards at Pierre Gosselin’s blog NoTrickZone introduced the Mao et al 2019 paper that’s the subject of this post. Figure 3 from the paper is presented below. Some readers may find the paper interesting.

Figure 3 from Mao et al. 2019
The abstract reads:
Contemporary references to global warming pertain to the dramatic increase in monthly global land surface temperature (GLST) anomalies since 1976. In this paper, we argue that recent global warming is primarily a result of natural causes; we have established three steps that support this viewpoint. The first is to identify periodic functions that perfectly match all of the monthly anomaly data for GLST; the second is to identify monthly sea surface temperature (SST) anomalies that are located within different ocean basin domains and highly correlated with the monthly GLST anomalies; and the third is to determine whether the dramatically increasing (or dramatically decreasing) K-line diagram signals that coincide with GLST anomalies occurred in El Niño years (or La Niña years). We have identified 15,295 periodic functions that perfectly fit the monthly GLST anomalies from 1880 to 2013 and show that the monthly SST anomalies in six domains in different oceans are highly correlated with the monthly GLST anomalies. In addition, most of the annual dramatically increasing GLST anomalies occur in El Niño years; and most of the annual dramatically decreasing GLST anomalies occur in La Niña years. These findings indicate that the “ocean stabilization machine” might represent a primary factor underlying the effect of “global warming on climate change”.
Have fun in the comments below and enjoy the rest of your day.
Regards,
Discover more from Watts Up With That?
Subscribe to get the latest posts sent to your email.
In the hope that “there are no stupid questions” holds true here…
I’ve recently been reading a lot from both sides of the debate, and have been consistently struck by how graphs showing model projections matching (or otherwise) global temperature change always seem to have start dates in the mid- to late 19th century.
Since it would seem obvious that a plausibly effective model would first need to account for variability driven by natural forces — in order to then flag up what additional change (or otherwise) human activities are producing — surely these models must have been back-tested to produce hind-casts of temperature for at least several centuries or, preferably, several millennia?
As Google has failed to turn up details of longer-term hind-casting for me, could anyone here provide links to research showing how well today’s GCMs have matched past temperatures over the last few centuries? Thank you.
I would just like to point out that there are huge differences between Warmunist “science”, which blithely assumes that A) our “current warming” (which is dependent on cherry-picking) is “overwhelmingly” manmade, and that B) the “current warming” will continue because of “carbon emissions”, and that presented by this paper on cooling. Even if you reject the science presented, call it “shoddy” or what-have-you, it is a thousand times better than what the Warmunists present. And, we are still left with the default climate theory, which is that climate is primarily (if not overwhelmingly) driven by natural forces.
Yesterday I shook my head when I read “15,295 periodic functions”. What a joke!
I’m getting tired of all these sub-par solar papers and their pronouncements, including this one.
Don’t get me wrong, I absolutely agree with the conclusions that the sun not CO2 drives the climate, but these people’s papers aren’t cutting it and are actually making things worse for everyone.
The way to the truth is narrow. It doesn’t take over 15K periodicities to understand climate change, and it’s not how solar climate forcing should be done.
Furthermore, to claim the sun is wholly responsible for forcing and then to make a 100+ year forecast to the fourth decimal place without knowing what the actual solar forcing will be is absolutely the height of irresponsibility and ignorance.
The best anyone can do is one solar cycle ahead, and even that is really an unknown except for the estimation of the next cycle’s magnitude, pioneered by Leif Svalgaard, and lately forecasted by many others too.
The IPCC is guilty of the same, ie, thinking we know what solar forcing will be out to 2100.
The RCP8.5 scenario is just as bad.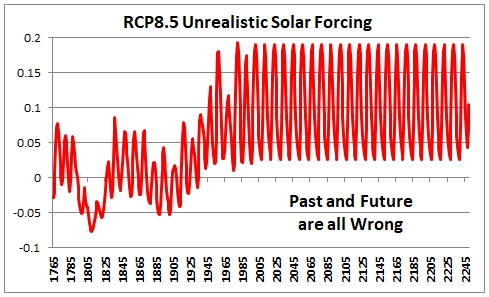
They tacked on another modern maximum in solar activity – of course that will drive more warming, but the IPCC people are dishonest and dumb, they again falsely attribute model warming to CO2 instead of more high solar activity.
Overall, this paper is Good News! It shows that at least some climate scientists are willing to begin looking outside the enforced CO2-AGW box, and propose radically different causes for the temperature record. Nikolov and Zeller did the same.
In both cases, much more work is needed to see if these radical proposals have merit and whether they will hold upon close (very close) review and deep digging.
It is odd to see here — at WUWT, a mainstay of the skeptical viewpoint on IPPC-AGW — these brave new hypotheses being summarily dismissed at a brief glance.
I suspect that the most scornful comments here come from those who didn’t even bother to download and read the original paper — which is probably the same reaction the paper gets from the Climate Rapid Response Team.
Thus we get a peek at the dirty underwear of the climate skeptic world — some here are as attached to their own little skeptical angle as the IPPCers are to theirs. And just as willing to thrown mockery, scorn and condemnation at new ideas as the worst of the Climate Team.
Thus we get a peek at the dirty underwear of the climate skeptic world — some here are as attached to their own little skeptical angle as the IPPCers are to theirs.
I don’t agree Kip for the reasons I stated above. We shouldn’t accept bad science even if it sounds good and supports the opposite of the IPCC. The path to the truth is narrow.
The RCP8.5 is actually consistently higher solar forcing than the modern maximum. When have we ever seen solar activity repeat exactly the same way for dozens of solar cycles? Never. So why do they do this? Where is Svalgaard on this, why isn’t he railing against their phony RCP8.5 solar forecasting?
Bob ==> I don’t quite get your point.
Have you read the Mao et al paper? It is pretty interesting and uses a novel approach — k-lines (brought over from the world of stock market analysis) — and applies it to the Global Land Surface Temperature record then compares the k-line record to the ENSO record. (There is no hint of solar forcing in the paper — they are looking at ENSO.)
Now that may be a nutty thing to do — but it may also be a novel and insightful thing to do. They present a compelling story.
At least they are using their minds to look at other possibilities and other approaches to the climate system.
Note: When reading the paper, it is important to realize that these scientists do not have English as their first language — and there are some problems from that — but not very many of us speak, read, and write Chinese either.
From my viewpoint, this is definitely NOT “bad science” — it is innovative and worthwhile even if they are wrong. And even if wrong — it may lead them or someone else to a new and better approach — that’s how science really works.
How science doesn’t work is summarily brushing off every new idea as “trash” or “bad science”.
… compares the k-line record to the ENSO record. (There is no hint of solar forcing in the paper — they are looking at ENSO.)
Now that may be a nutty thing to do — but it may also be a novel and insightful thing to do. They present a compelling story.
Kip, to be fair I just read a bit on K-line theory, which is a market-based approach to trend forecasting based on a few simple rules garnered from recent activity, and just looked through Mao etal’s paper.
I see the K-line as similar to simple statistical trend forecasting. I tried using statistical forecasting for a while but found it’s only so good, as in not very.
I learned about solar activity partly by keeping up with daily data and the US Air Force daily 45 day ap and F10.7cm flux forecast from NOAA. They change their 45d forecast during times of solar activity changes quite often over time as new sunspots emerge and old ones dissipate. They’ll show a decline in the forecast until all of a sudden a new sunspot emerges, making them change their last statistically based trend to positive. So they get it wrong a fair portion of the time, so no one should count on climate or solar forecasting 100 years forward.
That Mao etal didn’t use solar data while claiming ENSO K-lines can do the job indicates they are having some of the same difficulties understanding the solar-energy origin of the ENSO as many of our skeptic friends as well as warmists who are unclear that the ENSO itself is not a forcing, not merely a pattern in the data, nor a real oscillation, but a reaction to variable solar forcing.
Their method sounds like they assume past climate drives future climate, ie climate change causes climate change. Does that sound like science to you?
Everyone can tell a compelling story… but does the story check out?
Bob ==> Mao et al don’t speculate on the cause of ENSO. As I understand it, they use ENSO in this:
“most of the annual dramatically increasing GLST anomalies occur in El Niño years; and most of the annual dramatically decreasing GLST anomalies occur in La Niña years. These findings indicate that the “ocean stabilization machine” might represent a primary factor underlying the effect of “global warming on climate change”.” They end up proposing their “Ocean Stabilization Machine” hypothesis as driving climate warming and cooling, stating “These findings have effectively supported the OSM viewpoint: the oceans on this planet can be vividly called “ocean stabilization machines” (OSM). When some part of an OSM loses control for unknown reasons, other parts of the OSM stabilize the atmospheric circulation. As a result, El Niño or La Niña events occur.”
Dr. Curry and Wyatt proposed the Stadium Wave hypothesis. Nikolov and Zeller proposed their Pressure-Insolation theory; Mao et al propose the OSM.
Climate Science is finally getting some new bright ideas …. and some of them may well play out …. replacing or over-riding the CO2-AGW hypothesis.
You are perfectly welcome to stick to your view — you may be right. I’d like to read the papers that conclude that ENSO is “reaction to variable solar forcing.”
You are perfectly welcome to stick to your view — you may be right. I’d like to read the papers that conclude that ENSO is “reaction to variable solar forcing.”
I will, I am right, and I’m glad you’re looking forward to reading my paper.
Long before Mao etal published I figured out the sun drives the climate via the ocean – you’ve probably seen parts of my work here. I’m glad you’re on board with the ocean stabilizing the climate part, as I am too, it moderates short to long duration low solar activity periods, but imo the Stadium Wave is in the category of ‘the climate drives the climate’.
Kip,
The paper is nonsense. For instance they claim that their fit shows that temperatures will reach their “lowest point in November, 2127, which is −0.49456˚C. According to the error in previous time, for example, it reached the lowest point in January,1908, which was minus 0.61946˚C (in fact, it was in October, 1892, when the anomaly is −0.73˚C). The prediction using the function had 16 years lag ,and −0.11054˚C underestimated. Thus, we amend our prediction as it will reach −0.6051˚C in 2111.
Now they appear to be claiming that they have fitted the temperature data with 15000 periodic functions and it is the best fit ever. But there is still a 16 year time lag and an offset of 0.11 degrees
that have to be added to any prediction made using it. All of which is nonsense since the temperature minimum is just one month in 1892 and there is no reason to think that because October 1892 was very cold then over 200 years later there will be another anomalously cold month exactly 16 years after their prediction.
In addition there is no physical mechanism suggested in this paper it is just playing around with periodic functions. Which again is why it was published in a predatory journal with zero standards.
Percy ==> Their hypothesis may be nonsense — and it may not be.
Tan’s earlier work on k-lines was published by the Royal Meteorological Society….and this new work is a continuation of that. I wouldn’t place too much value on what journal is was published. BEST “published” their first paper in a junk journal that had never before published any papers at all.
Of course, they are not the first group to notice that surface temperatures have been stepping up in time with El Ninos.
I am not particularly invested in their hypothesis, only in the fact that they have taken a novel approach (k-lines on ENSO) and used it to back-forecast surface temperature fairly closely — both in time (16 years is not particularly large) and 0.1 degree c is pretty close over 150 years. (better than current models, I think).
Ignoring the details and focusing on the concept of ““ocean stabilization machines” (OSM).” is, if nothing else, extremely interesting.
I’m happy to be in agreement with you on this awful work.
Percy, I was referring to your assessment of this cyclomania.
Give me a break!
We shouldn’t even be discussing this example of shameful trash science.
Too many people working in science in the world. Too few of them real scientists correctly using the scientific method and producing quality science. The result is mountains of scientific articles being published every month that nobody reads.
My only complain about Kenneth Richards is that he should discriminate a little bit more. You damage your standing by picking articles like this one. It means you have no quality criteria whatsoever.
All of this just shows that the future isn’t what it used to be!
My future used to feature flying cars and rocket packs… Instead I got a PC and Smartphone… 😉
Perhaps the paper has a use as a citation to President Trump’s often cited statement that global warming is a hoax perpetrated by the Chinese.
One of the authors, Jiqing Tan, developed the k-line idea with ENSO back in 2015. The paper presented here builds on that work.
It’s a silly piece of work, but that’s climate science for you. Hey, it’s a “novel approach.”
Extrapolation of a curve fitting of an incomplete curve
Next.
Sounds like it’s time to go in search of the coming ice age again. Only who will take over for the Late Leonard Nimoy?
So Mao et al claim to have found 15,000 periodic oscillations that “perfectly” fit the temperature record of the past 170yrs and explain all the warming and cooling! Sceptic or phlogistonian mainstream – neither gets away with this level of hyperbole on this site.
Explains why the Tremometers guys who moved, after hide the decline, moved to air temps now find a zeal for ocean heat content. A ignore the decline.
Global warming ended in 2016. See these two posts, 10,000 reads in the last 4 days, by an actual geologist …
https://www.iceagenow.info/geologist-the-sun-not-co2-drives-earths-climate/
https://www.iceagenow.info/ipcc-fatal-error-neglecting-ocean-thermal-inertia/