Guest Essay by Kip Hansen
 Damien Cave, the NY Times Australia bureau chief, writes yet another heart-rending story with great personal touches about how the Solomon Islands are being “swallowed by the sea”. His latest offering is titled: Solomon Islands Dispatch — His Pacific Island Was Swallowed by Rising Seas. So He Moved to a New One.
The story is about a seaweed “farmer” who grows a particular ” wiry breed that’s exported across Asia.” The seaweed grows in the shallow water around his “island”. Calling it an “island” is a bit of a stretch — it is really a sand spit or sand bar, “At mid-tide, it’s 24 steps across at its widest point, and 58 steps long.” [ Note: this is not a coral atoll — just a pile of sand, maybe over some bit of rock.] Of course, The Sea Weed King’s first sand spit got washed away by the currents, so he moved to a new one. Here’s what it looks like:
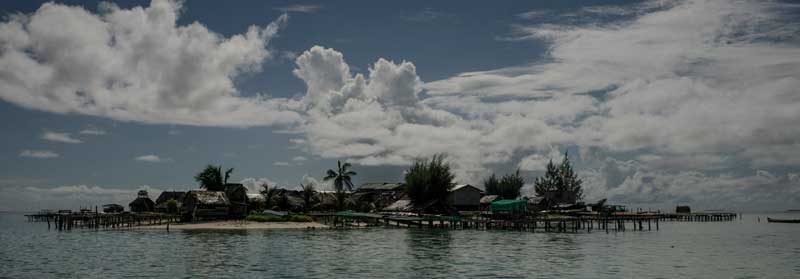
We’ll have to guess what the elevation above Mean High Water is, the Times doesn’t tell us, but is certainly isn’t more than a foot or two.
Now, you can read the whole story in the NY Times (linked in the first paragraph) — but here’s the thing — the Times repeats this oft-echoed falsehood:
“Scientists call it a global hot spot. The surrounding seas have risen about 7 to 10 millimeters per year since 1993, roughly three times today’s global average — and what scientists expect across much of the Pacific by the second half of this century.”
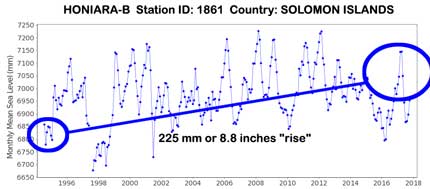
They get that impression from someone looking at graph like this:

That’s right — my golly — 225 millimeters in 25 years — that’s 9 mm/yr!
Oh my — I won’t say it — I won’t. I will not call this F… News.
I will, however, supply a more pragmatically annotated graph of the NOAA-listed Tide Gauge in the Solomons:
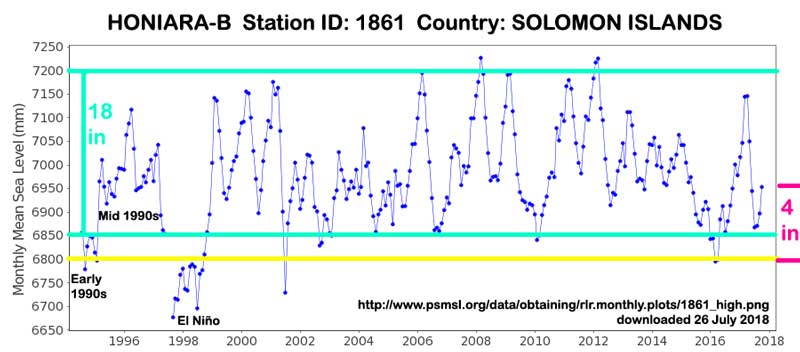
Experienced readers will see right away (have already seen in the first graph) how a big rise has been made out of highly variable data. The data is extremely variable — 18 inches of variability, which is about the same as the normal daily tides in the Solomons. In fact, over the last 25 years or so, Mean Sea Level at Honiara has soared and fallen over an 18 inch total range, ten times or so. Even if we insist on using the apparently somewhat outlier date of 1993 (far left) we can only squeak out a 4 inch rise comparing to range for 2015-2016 (a 6 month peak in 2017) and 2018.
A reverse-bias view would be something like this:
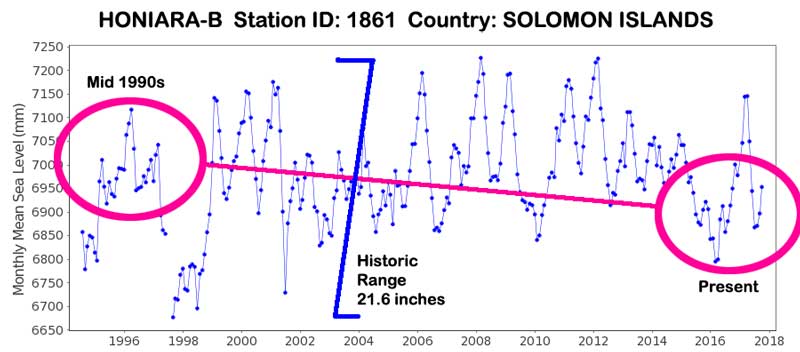
The truth however, is the bare raw data for Honiara-B:
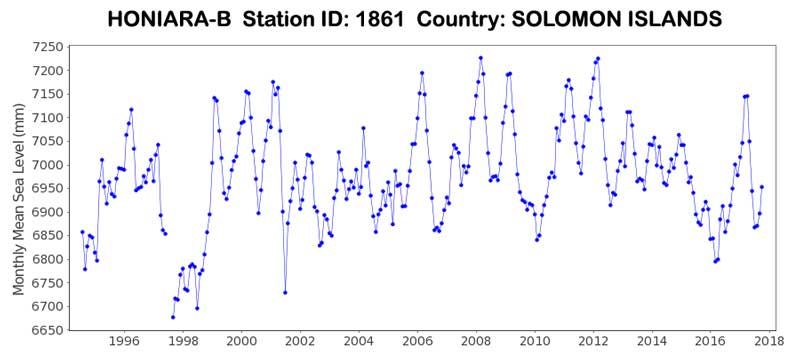
When we have the raw data graph (this is monthly MSL) a trained observer can see what the real situation is. We suspect that an equipment move or change made the break in 1997 sometime.
Drawing “trend” lines over times series graphs is itself a form of bias, constructed from the choice of start and end dates. I have already demonstrated that the “alarming rise in sea level” in the Solomons is a construct of such choices and presents an entirely false image of the situation. Likewise, selecting mid-1990s to early-2018 is equally biased, but in the opposite direction.
The graph immediately above is what we really know about sea level changes at Honiara-B — there has been a very wide range of variability over the last 25 years. Mean Sea Level at Honiara-B is currently running low in the range, not high.
How one finds out about all this is to go to the PSMSL website and find the PSMSL page for Honiara-B station in the Solomon Islands. There is a lot of information there, but the data authority for Honiara is actually the National Tidal Centre in Kent Town, South Australia. The National Tidal Centre page for Honiara offers downloads of yearly data.
# # #
Of Note: The New York Times article quote used above contains this: sea level has “risen about 7 to 10 millimeters per year since 1993, roughly three times today’s global average — and what scientists expect across much of the Pacific by the second half of this century.” This links to a very interesting 2015 paper titled: “Coastal vulnerability across the Pacific dominated by El Niño/Southern Oscillation” in NATURE Geoscience by Patrick L. Barnard et al. It is a mystery to me why they used this as a reference as this paper does not make any predictions for mean sea level rise for the Pacific, none, at all. It does, however, say this:
“Upper-end sea-level rise scenarios [IPPC projection scenarios] could displace up to 187 million people by the end of the twenty-first century1, with flood losses exceeding US$1 trillion per year for the world’s major coastal cities by 2050 (ref. 2). However, prior studies typically omit key oceanographic components of water level elevations during storms that drive severe beach erosion and flooding of coastal communities, and can be highly temporally and spatially variable. As the climate system evolves nonlinearly, so too will the spatial distribution of mean and extreme wind speed, wave height, period and direction, water level anomalies, and resulting coastal response, as is evident from trends observed over the past two decades.”
and
“We find that observed coastal erosion across the Pacific varies most closely with El Niño/Southern Oscillation, with a smaller influence from the Southern Annular Mode and the Pacific North American pattern. In the northern and southern Pacific Ocean, regional wave and water level anomalies are significantly correlated to a suite of climate indices, particularly during boreal winter; conditions in the northeast Pacific Ocean are often opposite to those in the western and southern Pacific.”
# # # # #
Author’s Note:
Journalists should do their job. They should check the most pertinent facts for themselves — in this case: Is sea level really rising 7-10 mm/yr in the Solomons?
Finding out that it hasn’t and isn’t makes a much more interesting story than “yet-another-alarmist-talking-point”.
Do note that while coral atolls are generally self-regenerating, sand spits/sand bars are not — they are at the mercy of the currents and waves.
Thanks for reading.
# # # # #
Quick Links:
expect across much of the Pacific
PSMSL page for Honiara-B station
National Tidal Centre page for Honiara
expect across much of the Pacific
Coastal vulnerability across the Pacific dominated by El Niño/Southern Oscillation
# # # # #
“. We suspect that an equipment move or change made the break in 1997 sometime.”
…or sea level dropped so far it was high and dry and wouldn’t work
More wins from today’s GWPF Newsletter 27/07/18
1) EU Abandons Climate Stance In Trade Sop To Trump
EurActiv, 27 July 2018
2) Trump and Juncker Agree To Boost US Shale Gas Exports To Anti-Fracking Europe
CNBC, 26 July 2018
3) Trump Wants Europe To Buy U.S. Gas — But Russia Is In His Way
The Wall Street Journal, 26 July 2018
4) Oh Dear: Climate News Is A ‘Ratings Killer’, US Journalist Confirms
The Washington Times, 26 July 2018
5) And Finally: You’re a CEO—Stop Talking Like a Political Activist
The Wall Street Journal, 27 July 2018
It usually takes longer than 3 days for my predictions to materialize.
Call this a “quickie”. 🙂
https://wattsupwiththat.com/2018/07/24/jeffrey-sachs-trump-is-taking-us-down-the-path-to-tyranny-because-paris-climate-agreement/#comment-2412688
[excerpt]
Donald Trump’s policies are eminently sensible and beneficial for the USA and the World – he is reversing destructive Marxist nonsense that is harming the economy and putting excessive control over everyone’s life into the hands of unelected leftist bureaucrats.
My expertise is energy. Cheap, abundant reliable energy is the lifeblood of society – it IS that simple!
Most politicians are so ignorant about energy that they should not even opine on the subject, let alone set energy policy. Trump is reversing the many leftist energy debacles, and restoring reliability and economy to US energy.
The example that America will set for the World will ultimately cause other governments to return to energy sanity. If they fail to do so, they will be unable to compete with the USA.
Low sandpit islands come and go all the time. In fact, one big storm could make that island completely disappear in one day. That island’s conditions says nothing about sea level rise or global warming.
The NYT is also know as the “old grey lady,” which is also an anagram of “really dodgy.” Coincidence? Or cosmic joke?
The sea level rise from the graph is over 100mm/yr from 1993 to 1996, so I guess that means the oceans are rising much slower then they were. I can only postulate the increased CO2 in the atmosphere some how slows sea level rise from this graph.
I think a really skilled journalist would have measured the sea level during low low tide, started his/her SUV up and left it running and then measured at a high high tide. This would be the most exciting proof of CAGW and sea level rise. It certainly meets all their quality standards.
That Times chart must have been presented as some kind of joke. The “trend line” is so obviously skewed that it makes the actual trend look flat. In fact, looking at the raw chart with no trend lines I conclude that the “trend” is, in fact, non-existent. Do whatever mathematical analysis you want on it to show some kind of “trend” and it’s either wrong or so completely overwhelmed by the noise of the variation as to be meaningless.
Jim ==> To be clear, the NY Times did not present a chart of sea level rise — if they had, all would have seen that their point was unsupportable.
The featured image, presented full-sized in the essay, is an example of the graphs that are used to support such false claims.
“Journalists should do their job”
But they are. Modern journalists see their “job” as promoting leftist causes. That’s why they became journalists: to make a difference.
Jim ==> I’m sure that in many cases you are right — they are trying to make a difference by being activists — where their professional calls for unbiased factual reporting of issues from all reasonable perspectives.
More proof that one can parse out a direction from the noise … that is, any direction.
Bill ==> Truthfully, even when when one is trying to be very scientific about it, as Dave Burton does above, the results are not always a reliable reflection of the real world. See reply to him.
where is the typical “these islands won’t be around long anyway because they are sand bar and they aren’t actually included in the global network” obsfuscatory response?
California is also in the business of creating sea level rise. Look at California Ocean Protection Council projections for San Francisco compared to tidal gauge records:
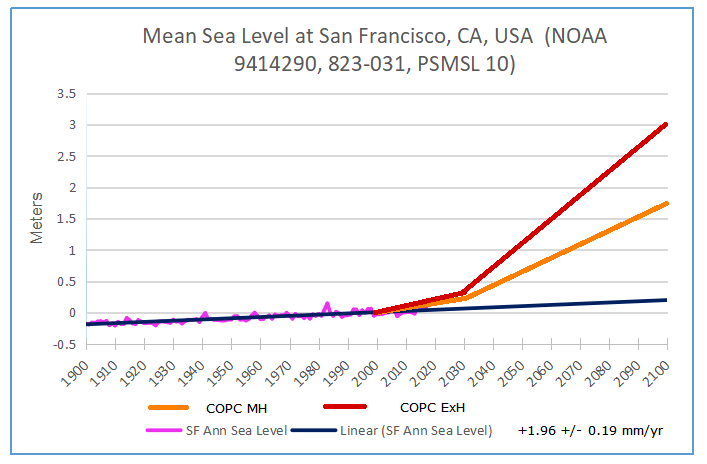
https://rclutz.wordpress.com/2018/07/27/calif-dials-up-sea-level-alarm/
Ron ==> Projections — of all types — made from climate models suffer from the same problem. The problem is revealed and described in:
Lorenz validated which discusses NCAR’s “40 Earths Study”.
Thanks Kip for the link and the article your wrote. You emphasize that the models behave in a chaotic manner due to unforeseen and unpredictable interactions between the component equations. In contrast, the earth’s natural climate is amazingly stable, maintaining a very narrow range of fluctuations in parameters like temperature and precipitation. In a similar way, models project radical changes in sea level, while the actual observed rise since end of LIA are quite slow and steady.
Ron C ==> First, We Don’t Know. (The hardest sentence ever for scientists).
Second, the climate systems appears to be “bounded” in at least two ways….Warm Periods seem to be constrained to a fairly narrow range of temperature and climate distributions, but our true state of knowledge is weak. Glacial Periods seem to be bounded as well even weaker knowledge).
It is well within expectations for Chaotic Systems to exhibit these types of multi-states, each well-bounded.
In fact, “stability” is a feature of chaotic systems. See “Chaos & Climate – Part 2: Chaos = Stability”.
Thanks for contributing — always nice to have rational voices chime in.
Australian BOM data. http://www.bom.gov.au/ntc/IDO70061/IDO70061SLI.shtml
Epilogue:
Thanks to all reading here — first, simply for reading at all (so many people don’t anymore) and second, for reading this essay.
It is a pity that in today’s world so many journalists are forced to “write to the narrative” of their newspaper’s owners or editors, rather than be true to the Code of Ethics for professional journalism. Maybe someday a Hero will emerge and set journalism straight — I’m not holding my breathe.
Remember, most of these journalists really believe they are doing their jobs when the write these kinds of Acti-Journalism (activism + journalism) stories. There are some who can be educated — others are lost to “The Cause”.
When scientists are queried about so-called quotes in Acti-Journalism pieces, they nearly always reply to me –“That’s not really what I said or what I meant.” The Acti-journalist “hears” what he needs and wants to make his “required narrative” point.
This journalist was so sure about rising sea levels that he didn’t even check the single most basic bit of data when writing a magazine-length article. As a young journalist (university) I would have been fired for such an omission, and rightly so.
Here’s to the hope of better times.
Again, thanks for reading.
# # # # #
“Drawing “trend” lines over times series graphs is itself a form of bias…”
No, it’s actually a form of lying.
(Practiced primarily by ‘climate scientists’.)
These tear jerker sea level rise stories are so silly. Anyone who lives on coastal lowlands and has any understanding of either geology or archaeology knows that sea level rise has been continuing for the last roughly 12KYA to 15KYA since the retreat of the last glaciation began. Where did the Bering Land Bridge come from, anyway? Every school child knows that’s the now submerged lands from whence humans migrated from east Asia to North America.
Google ancient geological maps of the Florida peninsula, and one can easily see that Florida at one time was several hundred miles wider east to west in the shallow Gulf of Mexico than it is today. It is for that reason that archaeological artifacts found to date in Florida tend to be rather recent, just a few thousand years old … the prehistoric natives tended to cluster along the shoreline, and 10 to 15 KYA that shoreline was way out in what is now the Gulf.
NYT is cancer, all the junk that’s fit for ads and political slants