By Javier
Two solar physicists, Robert Leamon from NASA Goddard Space Flight Center, and Scott McIntosh from the High Altitude Observatory at Boulder, CO, have made an interesting observation that links changes in solar activity with changes in the El Niño Southern Oscillation (ENSO).
As they reported at the AGU 2017 Fall Meeting, the termination of the solar magnetic activity bands at the solar equator that mark the end of the Hale cycle coincides since the 1960’s with a shift from El Niño to La Niña conditions in the Pacific.
“We look at the particulate and radiative implications of these termination points, their temporal recurrence and signature, from the Sun to the Earth, and show the correlated signature of solar cycle termination events and major oceanic oscillations that extend back many decades. A combined one-two punch of reduced particulate forcing and increased radiative forcing that result from the termination of one solar cycle and rapid blossoming of another correlates strongly with a shift from El Niño to La Niña conditions in the Pacific Ocean.”
More information is available at the talk they gave at the last SORCE Meeting:
Terminators: The Death of Solar Cycles and La Niña 2020
As they say in the talk, the probability that the pattern is due to chance is very low. Particularly since the termination of the magnetic activity bands at the equator coincides quite precisely with the El
Niño-La Niña shift.
Analysis of the ONI (Oceanic Niño Index) data from NOAA, and sunspot number from SIDC shows
the following pattern:

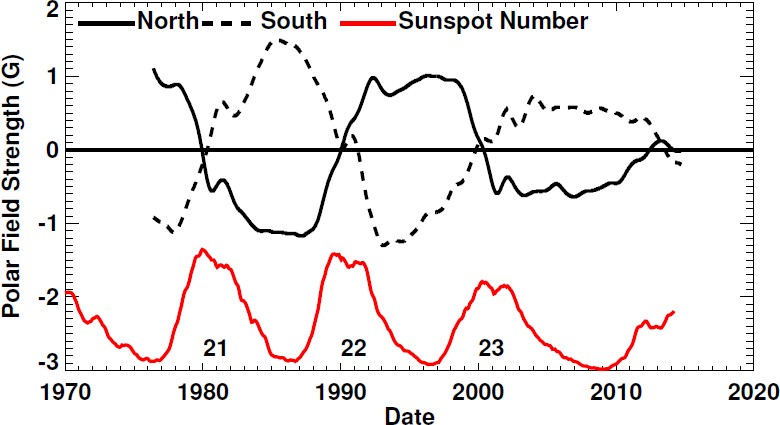
Figure: Top: Six-month smoothed monthly sunspot number from SIDC. Bottom: Oceanic El Niño Index from NOAA. Red and blue boxes mark the El Niño and La Niña periods in the repeating pattern.
Since the 1960’s the early solar minimum is associated with La Niña conditions, the late solar minimum is associated with El Niño conditions, and the rapid increase from minimum to maximum is associated to La Niña conditions again. As the authors note, this pattern did not take place in the 1954 minimum, although the rise in activity was also associated with La Niña conditions then. It is unclear why the ENSO system responded differently at that time, but it is clear that solar activity was not the only factor affecting ENSO.
The pattern appears to be repeating again this minimum. The early minimum has been associated to La Niña conditions and, as we move towards the late minimum, an El Niño is being forecasted for late 2018. The authors made their claim for a 2020 La Niña before the 2018 El Niño was forecasted. Now a repetition of the pattern looks even more probable and we should expect a La Niña when solar activity increases in late 2020 to 2021.
Discover more from Watts Up With That?
Subscribe to get the latest posts sent to your email.
Interesting!
… but not convincing
Why?
Because they only have 7 samples, of which one did not conform. Hardly overwhelming proof.
Scientists research correlated phenomena that have a much higher probability of being due to chance. Six repetitions of a particular pattern in a row should call our attention.
Schwabe described the 11-year cycle in sunspots with data from 1826 to 1843, just 18 years of data. Not even two complete oscillations.
It works, except when it doesn’t.
Closely coupled complex chaotic systems like climate will be somewhat chaotic.
A “score” of 6 out of 7 is interestingly beyond chance. Provided the couplings mentioned above, perhaps a closer examination of the “misfit” data point would provide some valuable insight into the complexity.
@ur momisugly Lewis P Buckingham
I am not convinced because they attempt to formulate hypotheses on a wrong premise, the authors say:
“The Sun provides the energy required to sustain life on Earth and drive our planet’s weather. Over the past few years a new picture to describe solar variability has developed, based on observing bands of magnetism that belong to the Sun’s *22-year* magnetic activity cycle, and migrate from high latitudes towards the equator……..
One of the most important events in the progression of these bands is their death, or termination, at the solar equator that signals a global increase in magnetic activity that becomes the new solar cycle. Their death is NOT dragged out, but abrupt. Indeed, the triggering of growth in the new solar cycle is almost immediate (significantly less than 1 solar rotation). Here we show the particulate and radiative implications of these termination points, their temporal recurrence and signature, from the Sun to the Earth.”
The above analysis is not supported by the evidence (link ) .
Data shows that the sunspots magnetic cycles overlap by anything up to 5 years, exactly opposite of what they claim.
@vukcevic Your graph (this is just conjecture, you don’t provide a legend) shows the solar latitude of the sunspot, and the color indicates its polarity? So you’re not showing the same thing the article (research paper?) seems to be talking about, they say “…the termination of the solar magnetic activity bands at the solar equator that mark the end of the Hale cycle…”. I don’t think that’s the same thing. You haven’t shown anything about the strength of the magnetic field, for example. Now I agree it would be better if they had showed that (maybe they do in the talk?), but I don’t think you have refuted their claim. And isn’t there a switch of the sun’s poles in each solar cycle? More input! More input!
That said, I have seen a couple of comments that boil down to, “…it works except when it doesn’t…”. But with any correlated cycles we are assuming one is a forcing and the other is the response. So it’s easy to imagine there may be cycles where the forcing doesn’t rise high enough to induce a response. That doesn’t necessarily completely kill the deal. We should keep watching and see how this turns out.
Strength of the magnetic field is represented by intensity/density of the colour either red or blue. Note that near the solar equator more often than not colour fades down, on occasions completely goes out (link ).
There is nothing ‘abrupt’ at the time of change from one solar cycle to the next; although the present cycle is far from finished, magnetic field polarity of the next cycle has been observed on a number of occasions.
Our resident solar expert Dr. S. goes as far as to say that each solar cycle last 16-17 years, in my view there are only 22 years long magnetic cycles (as shown in the link above).
“And isn’t there a switch of the sun’s poles in each solar cycle? ”
Yes, there is but as far as it is possible from the sunspot minimum, switch takes place at or near the time of the sunspot maximum.
Thank you.
It brings to mind the response to the rational apparent observation.
‘Eppur si muove’
In this case there is apparent correlation.
Which implies a link.
Which is yet to be elucidated.
‘Needs more work’
A realistic place to ask for funding.
Dum scientia est, spes est.
Because…
Correlation does not mean causation, although causation cannot occur without correlation.
Causation…
Since we care about the long-term cooling of the planet and all those dangers or the long-term energizing of the planet and all those dangers, the ENSO causes what in that arena?
ENSO is more effect than cause of global warming and cooling cycles.
El Nino is more common and frequent during warm intervals and La Nina during cool cycles.
With perhaps a lunar component in precise timing.
Sorry. In the wrong place.
Meant to augment this reply to Pamela:
That the ENSO is driven by the sun isn’t in doubt. The relative importance of various solar variables, and their modulation by atmospheric and oceanic effects OTOH is subject to study.
Re: meteorologist according to some it moves air from equator to poles thus causing a larger delta T between space and atmosphere resulting in more energy lost to space. If true one could posit then that the number and amount even the missing one are the main drivers of global energy uptake or loss.
We know it causes a delta T on ayear to year basis that is a larger magnitude then decades of cumulative increase attributed to CO2.
So in short, it may be everything we care about.
Unfortunately, they only cover the period of relatively strong solar cycles, so their prediction may not hold true but the great thing about making predictions is that everyone gets to see if you were right. I won’t bother adding the semi-obligatory Yogi Berra quote.
Such a good point Bloke down the pub!
… Which one?… It’s deja vu all over again? 🙂
“When you come to a fork in the road, take it.”
“It ain’t over till it’s over.”
“it ain’t over until the fat lady sings.”
“Some of the things I said I never really said”
Many things ‘Confucius say,’ he no say; others say and then say he say.
“It’s tough to make predictions, especially about the future.”
Yogi Berra also said:
“I didn’t say half the things I said”
Feynman said, Science is a way of trying not to fool yourself. The principle is that you must not fool yourself, and you are the easiest person to fool.
What a fool can understand, so can another.
which is just a clever and elegant way of saying you should keep emotion/dogma out of science.
I wonder if anyone has done a chart showing just where the Jovian planets are during these cycles? I would suspect their proximity and position would be a big factor in the stretching and pulling of the planet’s thin crust. Just a suggestion though.
I don’t think so. Earth laps Jupiter in just over 13 months, and Saturn in approx 12 and 1/2 months. Jupiter laps Saturn in a bit under 20 years, which doesn’t match the 22-year cycle.
If I remember my fifty year old research correctly, Jupiter is at perihelion every 11.9 years,or so, meaning it is closest to earth sometime during that year as well.
One university research group was ready to publish a study linking sunspots to the strength of Jovian rf signals until they realized that the signal strength was stronger only because the planet was closer to Earth.
http://milesmathis.com/cycle.pdf
This is one solar /climate pattern I am not that sure of. Other solar /climatic connections to my way of thinking are much more likely then this one. I have yet to see any one being able to predict ENSO. This is a prediction that is waiting to bust with time and it will.
Well, we are supposed to accept a 30 year period as measuring climate, why not 67 years.
ENSO is of great importance to Australia [and Pacific Rim countries] because it influences our
land of ‘drought and flooding rains’, which we were told were caused by CO2 driven climate change.
Any observational tool for predicting ENSO would be a boon to farmers, air conditioning manufacturers and importers.
So all we have to do now is predict sunspot numbers.
Too Easy.
Salvatore, when a pattern repeats enough times, for example the 11-year sunspot cycle or the 41-Kyr interglacial periodicity, we go from thinking that it is due to chance to thinking that it has a periodic cause. Then when the pattern interrupts, like the 11-year sunspot cycle during the Maunder Minimum, or the 41-Kyr interglacial periodicity at the Mid-Pleistocene transition, we don’t say that the periodicity has gone bust and was not real. We look for the cause of the interruption.
That the pattern didn’t hold in the 1950’s or that sooner or later it will fail again does not mean that the pattern is not real now, as being a real forcing with a real mechanism causing a real response.
How much energy from the sun would it take to change the ‘direction’ of ENSO? Can we detect this change in the energy, whatever form it’s in?
They’re talking about the timing of the minimums and maximums. There are a zillion other possible correlations. If you examine enough parameters, you are guaranteed to find correlations in a large data set.
There are lots of El Nino La Nina transitions that don’t coencide with solar activity. Their graph goes back only to 1950. At this point I don’t think there’s enough data to say the relationship is anything more than a coincidence.
True, but the way they arrived to this was not by looking for ENSO-Solar correlations until one was found. They study solar magnetic band behavior and they identified the time of their termination as a time somewhere between the minimum and the maximum. They know the termination is a time when particle emissions abruptly decrease and radiation emissions abruptly increase. They must have looked into the main climatic indexes to see changes at this precise times. The coincidence in the shift from El Niño to La Niña came out. The chance probability is small. The possibility of a mechanism is there as particles affect mostly the upper atmosphere, and insolation affects mostly the oceans upper layer. The atmospheric-oceanic interaction is the basis of ENSO.
They say they have looked at ENSO proxies since 1870 and the correlation looks good by eye except for the 1940-1960 period. Climate is so variable that it is not unusual that at certain times it changes its response to a forcing. Think for example in interglacials that only happen sometimes and not at every insolation cycle due to variable climatic conditions.
I think the correlation looks interesting. They only talk about the El Niño-La Niña shift, but I have extended the correlation to the Niña/Niño/Niña sandwich, as it is quite obvious. Other people have noticed that El Niño has a preference for times when solar activity is declining. If the correlation turns out to be correct, this would be the most clear example of weather (and possibly climate) being affected by solar activity, and would improve our ability to predict ENSO, which has a huge impact globally.
The problem is the sun was in an active state not an inactive state like it is now and it will not be the same. If this turns out to be a prolonged solar minimum it will not hold up in my opinion at all.
Low solar activity leads to neutral ENSO. The meridional jetstream disrupts the ENSO wave that runs along the equatorial current. For example, now Niño 3.4 index is positive, but Niño 1.2 index is clearly negative.


That’s interesting, Ren. I only follow Niño 3.4. If an El Niño develops this year it is unlikely to be a strong one, as it is not extending to 1.2 so far.
The 2016 strong nino did not express impressively in the 1.2 either. This is one reason predicted floods never materialized in California.
BTW, have you seen Paul Pukite’s work on QBO and ENSO?
QBO might be the magnetic link?
Yes. He also goes by the name of WebHubTelescope. He is one of the few people banned at Climate.Etc, I believe for his behavior to other commenters.
His graphs where he compares the Southern Oscillation Index to his model look too good to be true. As I often do I checked them by plotting SOI. Guess what, It didn’t look at all like the SOI he had in his graphs. As I understand he has presented his model at an AGU meeting, but he has been unable to get it accepted for publication. He might as well try a predatory journal. You can get anything published in them (for a fee), and many claim to be peer-reviewed when they aren’t.
“The possibility of a mechanism is there as particles affect mostly the upper atmosphere, and insolation affects mostly the oceans upper layer. The atmospheric-oceanic interaction is the basis of ENSO.”
Would you go a little bit further because I am a little confused as to why the upper layer of the oceans would be affected more by the upper atmosphere but not the atmosphere at the ocean’s surface.
That’s not what I said. The solar particle rain reaches the atmosphere where it affects its electrical properties and its chemistry. Some of the changes are transmitted towards the lower atmosphere more efficiently at the poles than at the equator, due to the polar vortex. This changes the properties of the equatorial-polar atmospheric gradients, including for example the ozone gradient. Solar radiation changes affect both stratospheric ozone and energy increase at the oceans upper layer, particularly at the Pacific tropics where most of the solar radiation is absorbed. The atmospheric effects have been proposed to affect wind patterns, particularly their zonal or meridional predominance. While energy gain by the ocean affects sea-surface temperatures, particularly when combined with wind changes that promote upwelling or downwelling. The result is that proposed effects from solar variability affect the same factors that determine ENSO oscillations. A connection between solar variability and ENSO variability, although not established, is clearly not difficult to imagine.
Thanks
I agree with all that but I think it depends on what state solar activity is in. That being active or inactive unless you think the solar particle rain as you call it stays the same no matter what state the sun is in.
Javier,
That is close to the hypothesis that I’ve been advancing for some time but with a critical omission.
The thing is that to get more meridional jets and greater global cloudiness for a cooling world one first needs to push the polar tropopause downwards relative to the equatorial tropopause.
That requires a warmer lower stratosphere above the poles which in turn requires more ozone.
The established belief is that there should be less ozone when the sun is quiet.
It appears that when the sun is quiet there is less ozone below 45 km but more ozone above 45km which was an unexpected finding.
That increased ozone above 45km then descends to the lower stratosphere above the poles in the stratospheric polar vortex which depresses the polar tropopause and all else follows.
That is the only scenario that fits all the observations together logically.
Thank you Stephen. Do you have a reference on that ozone distribution above and below 45 Km?
OZONE PRODUCTION BY GALACTIC COSMIC RAYS IN MAGNETOCONJUGATED
REGION OF THE EARTH
Y. K. Tassev, P. I. Velinov, L. N. Mateev
A great interest presents also the ozone formation
under the influence of GCR. It is well known that the unique source of charged particles in the lower stratosphere are the GCR, which consist from protons, a-particles and heavier nuclei (Z>3) with energy >1—2 GeV/nuc.
The GCR depose their energy mainly at a height of 10-20 km, where the maximum of the air ionization (maximum of Pfotzer) is. This ionization takes place In the lower stratosphere, where the photodissociation rate decreases essentially and becomes comparable, even less than the CR ionization rate. At fhe same time the charged particles are already able for reactionsin the atmosphere, whose constant reactions rate is greater with one or two orders than the respective value of free radical processes . The GCR are a source of
ozone formation in the lower stratosphere, because of radiolysis in the oxygen molecules.
In t h is way two mechanisms of ozone formation from GCR are observed:
first, the radiolysis of the oxygen molecules; second, a participation of ions in the ionmolecular
processes in the stratosphere.
https://www.researchgate.net/publication/288190725_Ozone_production_by_galactic_cosmic_rays_in_magneto-conjugated_regions_of_the_earth
Carbon-14 is produced in the upper layers of the troposphere and the stratosphere by thermal neutrons absorbed by nitrogen atoms. When cosmic rays enter the atmosphere, they undergo various transformations, including the production of neutrons. The resulting neutrons (1n) participate in the following reaction:
n + 14/7N→ 14/6C + p
Ozone and 14CO2 will in winter raise the temperature in the lower stratosphere above the polar circle, which leads to the escape of water vapor to the stratosphere and increase the amount of ozone in the upper troposphere. Therefore, in winter in North America temperatures will be very low.
http://sol.spacenvironment.net/raps_ops/current_files/rtimg/cutoff.gif
The highest rate of carbon-14 production takes place at altitudes of 9 to 15 km (30,000 to 49,000 ft) and at high geomagnetic latitudes.
https://en.wikipedia.org/wiki/Carbon-14
Annual US spending on science, space and technology reportedly has a 0.99789 correlation with Suicides by hanging, strangulation, and suffocation.
Also, Annual per capita consumption of mozzarella cheese has a 0.958648 correlation with the number of Civil Engineering doctorates awarded.
http://www.tylervigen.com/spurious-correlations
I’ve said it before. Whatever is driving our planetary temperature fluctuations has to be something BIG! I mean, HUGE. Like, something on the order of the size of our SUN!
100 billion tons of hydrogen per second can’t be wrong.
Internal variability. Storing and releasing heat.
Well I have to say that turn the gain on a filter – any filter – up high enough and you will see what the filter is tuned for you to see.
Exactly, Leo. El Nino/la Nina is an arbitrary index, the definition of which is chosen by humans, and humans can change it if they want and if it suits their needs.
I agree, the index is arbitrary, people often forget that.
Well not only is the recognition of El Nino/La Nina based on an arbitrarily chosen index, the index itself is merely a symptom of the actual mechanisms that cause the phenomenon in the first place.
Climate “science” is the only field of science I’m aware of that doesn’t even collect the correct data. How can we expect the field to advance when there isn’t even a concerted effort to switch to more meaningful data collection?
Waiting to hear from Leif….
The coming minimum is placed way too early, it won’t be this year.

You are trying to get too much from the figure I made. The authors only predict the termination of the solar activity bands and the El Niño/La Niña shift for 2020-21.
The placement of the boxes in the figure beyond the present only predict the sequence, not the timing, that depends on solar activity.
For my prediction of the solar minimum check my article in WUWT about a month ago. It is still the first half of 2019.
” It is still the first half of 2019″ ? 2018 ?
2019. Check my article. There is a search box at the top.
Oops, my bad….
I had commented on your article.
We both agree that no solar minimum in 2018, and Leamon & McIntosh prediction doesn’t require a minimum in 2018. There’s plenty of time for an El Niño before 2020-21, when it is supposed to end.
We agree on some things and disagree on others. I have no problem with that. Particularly since we deal with very complicated stuff. Time will tell.
The El Nino episodes in every case peak a year or more past each sunspot cycle minimum. So even with your expectation of sunspot minimum being in the first half of 2019, the El Nino would then peak at around Dec 2020 to Jan 2021.
Javier writes:
“You are trying to get too much from the figure I made. The authors only predict the termination of the solar activity bands and the El Niño/La Niña shift for 2020-21.”
That explains it, I am used to your charts not showing what has been said. You show the Nino/Nina transition at 2019-20. If anything you haven’t got enough from the figure you made, like the fact that the El Nino episodes all commence after each sunspot minimum. But then the Authors seem to have missed this too.
Ulric ..it has always appeared to me that El Ninos start up when the sunspots move off of the minimum towards the first peak. I was wondering about the claims made above as well.
It appears to me that El Nino episodes start up when the solar wind is weak enough and for long enough. Even close to sunspot cycle maxima in 1969 and 1979.

It appears that sometimes the El Nino window is 2 years wide and other times it is only one year. This then allows the following La Nina to match up. This looks like curve fitting to me. Count me as skeptical.
The problem is that this theory only covers transitions to solar activity, it doesn’t do anything to explain the peaks in ENSO that occur at other times. It breaks down totally in the 1957-1958 period. Note that there is no El Nino in precisely that period. Looks like another “searching for correlation” to me.
I’ll be looking forward to Willis’ perspective on this.
I don’t see the pattern break-up in the 1950’s as a show stopper. We have 11-year sunspot cycles failing to show at Grand Minima, and interglacials failing to show at insolation peaks without being show stoppers. Other factors than the main forcing affect the outcome at certain times. What counts is that the pattern repeats often enough, and 6 out of 7 is not a bad number.
There were a few nuks exploded in the Pacific during the 50’s
People have been trying to make a correlation between climate and sunspots ever since Herschel. When something has been attempted for that long, the general principle should be scepticism. It’s possible Leamon and McIntosh have found something that nobody else has noticed. I would bet against it though. There has to be a whole lot more corroborating evidence before I will be convinced.
I’m not a mathematician so I’m not confident I can calculate a p-value or even if that would be a valid metric in this case. The null hypothesis would be that the observed relationship is a coincidence. Based on the data we’ve got, I don’t think we can reject the null hypothesis.
I’ve long wondered if the variability in solar cycle length was masking the effects of the sun on climate. Fourier analysis would tend to smear the result across a range of frequencies.
Sort of like truth in labelling. If you add 10 different types of sugar to jam you can list berries as the most plentiful ingredient even though it is only 10% of the total.
The shortcomings of frequency analysis of proxy data that is heterogeneous in the time domain are difficult to understand by people trained in statistics and engineering where data is generally homogeneous in the time domain. This issue, well known by a few paleo data analysts is seldom raised to non-specialists. Statistical knowledge and software adequate to the frequency analysis of data heterogeneous in the time domain is not well developed.
Javier a much more important correlation and I think it is real is how overall oceanic surface temperatures correlate to solar actiivty , and unlike the ENSO proposal there is a real mechinism which is the intenstiy of UV/NEAR UV light.
I don’t see the need to prioritize. If solar activity helps better predict ENSO it will lead to a better acceptance on its effect on climate.
And let’s not forget that on the short term global temperature follows ENSO. This prediction amounts to further cooling starting 2020-21 from a new La Niña. About the right time for something like this:
Similar to what I have been talking about for some years now.
Perigean New/Full Moons exhibit both a 31-year (half cycle) and 18-year (Saros cycle) repetition pattern, which naturally produces a pseudo-cycle of (31 – 18 years) = 13 years.
2015 – 1877 years = 138 years or
2016 – 1878 years = 138 years
This is only 1 year off either:
(5 x 31) – 18 years = 137 years
(4x 31) + 13 years = 137 years
There will be weak to moderate El Nino in 2020, a strong El Nino in 2025 – followed by yet another weak El Nino in 2030.
Then there will be a strong La Nina in 2034.
“Rotating atmospheres, like that of the Earth and the giant planets of our solar system, often exhibit shorter-timescale global-scale phenomena such as Kelvin and Rossby waves which are important for the transport and regulation of energetics in those systems. In the following analysis we argue, based on a host of observations displaying (quasi-)periodicities of significantly shorter—but commensurate amplitude—to the well-established decadal-scale ‘solar cycle’ variability, that the Sun is no different.”
https://www.nature.com/articles/ncomms7491
Physics are the same everywhere. The Sun is one thing, really hot? Stuff moves around, like on Earth.
No it’s not all cycles. But forcing the cycle to reset. That would be something. If the IPWP dumps East every 11 years or so, that brings one kind of coherence to that part of the system.
Well if this were true at all they should find some sort of connection to the dominant Indo-Pacific pressure systems that lead to trade winds strengthening/reversal and control ENSO in the first place.
It would be much more convincing because correlating to the resulting El Nino/La Nina, instead of the mechanism that gives rise to the pattern, is like correlating an external force to an internal symptom, i.e. a patient has hip pain on sunny days. Well you might find a correlation, but that ignores the fact that it’s not the sunny days that lead to hip pain, but rather the patient goes jogging on sunny days.
My homemade “model” shows a perfect “correlation” between the trump election win and “Trump Delusion Symptoms” (TDS) !! As proof, I offer this from the Guardian …
PS..If you are having a drink, put it down BEFORE reading this !!
“Guardian writer blames Trump for skipping gym: ‘Now I can’t open jars'”
http://www.foxnews.com/entertainment/2018/07/05/guardian-writer-blames-trump-for-skipping-gym-now-cant-open-jars.html
It would be funny if it wasn’t so sad….
No mention of Karen Labitzke and van Loon
http://adsabs.harvard.edu/abs/1993AnGeo..11.1084L
and all their other work.
No mention of Theodore Landscheidt
http://www.sharpgary.org/landscheidt.html
and all his work.
They, among others, were doing quite successful work on this a few years ago. But thats the trouble with the entire IPCC and national weather offices research it is so narrow and self-serving. It is a maxim that governemnts hire people who private industry won’t take. Look at James Hansen’s history.
Like Nobel Prize recipients.
Some Nobel Prize recipients earn the prize. Some get it for political reasons. Look at Al Gore and Pres Obama as two examples of many.
Krugman.
Three Scandinavian socialists agreed with him, so he got a faux “Nobel”.
What you are seeing in this data is not necessarily the 11-year sunspot cycle driving El Nino events on the Earth.
As I have pointed out many times, the best explanation for the triggering of moderate to strong El Nino events (1868 to 2015/16) is the Perigean New/Full Moon Cycle. Please see my series of four blog posts in 2014 at:
http://astroclimateconnection.blogspot.com/2014/11/evidence-that-strong-el-nino-events-are_13.html
The reason that the El Nino timing pattern synchronizes with the solar cycle is simply that the Perigean New/Full Moon tidal cycle is also synchronized with the solar cycle. This is true for the simple reason that the rates of precession of the lunar line-of-nodes and line-of-nodes (i.e. the precession of the shape and tilt of the lunar orbit) and the solar cycle are both determined by a spin-orbit coupling between variations in the rotation rate of the Sun’s outer convective zone with the Sun’s motion about the Barycentric centre of the Solar system. This spin-orbit coupling is primarily driven by the orbital alignments of Ven, the Earth, and Jupiter, with Saturn playing a lesser role.
An investigation of roughly 150 years of solar sunspot cycle data and ENSO data does show that there is an 11-year cycle in the occurrence of La Nina conditions that is probably being driven by an 11-year cycle in the up-welling of cool deep ocean water off the west coast of South America. I think that this is related to variations in the strength of the Humbolt current.
I am trying to publish a series of three to four papers outlining how the Perigean New/Full Moon cycle triggers moderate to strong El Nine event. The first in this series has already been published and the second should be out sometime this year.
Hi Ian,
Yes, I’ve read your articles long ago. Your research goes into finding the cause of the correlation between ENSO and the 11-year cycle. You provide an interesting hypothesis, and I particularly like that it involves LOD. But that is step 2. As you can see by the comments and in the literature, nearly everybody is in step 1, which is showing convincingly that the correlation between the 11-year cycle and ENSO is real.
Huhh?…..Cherry picking 5 peaks out of a dozen or so isn’t really a correlation.
ONI data only goes back to 1950.
Oh, and if you want a prediction of the Lunar tidal model – It predicts a moderate to strong El Nino starting around July 2019, quickly followed by conditions favorable for La Nina events sometime around 2020/21.
Then, that’s the third prediction on a 2020-21 La Niña that I am aware of.
Javier, you said, “As they say in the talk, the probability that the pattern is due to chance is very low. “ Please quote their words properly cited. If this is what they actually said, all we need to dismiss this claim is a statistician who understands correlation analysis in a multi variate environment replete with confounding factors likely equal in correlation but unrelated to solar measurements. And those are a dime a dozen wrt El Niño. This post earns an F.
Pamela,
Their exact words in the slide (link provided) are:
“NOT random. Only 200/10^6 Monte Carlo trials (piecemeal shuffle ENSO) better than observed Terminator correlation.”
That’s p 0.02 in case you also need help with that.
Your comment earns an F.
O dear. Not a wee pee value.
The issue here is the null hypothesis. You have to show that currently known independent variables other than your proposed independent variable are less correlated than yours, plus your solar measure has to possess at least an equally plausible mechanism. Since you have not discussed anywhere with the readers here why current probable cause-effect correlations outside of your proposed hypothesis cannot be the cause: F. You have utterly failed to consider all possible confounding variables: F. And you demonstrate undue bias: F. In other words, you have not shown robust conclusions and are clearly influenced by your bias. Poorly presented material which will be deeply criticized and worse, even ignored.
Take this for what it is worth. In my career I was criticized at least as harshly but I made changes because of that criticism, resulting in a much improved published piece of research that has stood the test of time over 2+ decades. In the near future I hope to re-engage in controversial research in which I will face harsh responses. Knowing that ahead of time drives my effort to dot all the i’s and cross all the t’s. It is how good research is done. I stand by my F.
That the ENSO is driven by the sun isn’t in doubt. The relative importance of various solar variables, and their modulation by atmospheric and oceanic effects OTOH is subject to study.
Please link to peer reviewed published robust studies indicating your statement “isn’t in doubt” has broad replication.
Are you aware of a “peer reviewed published robust study” which claims that the sun doesn’t heat the tropical Pacific Ocean?
Or that solar UV doesn’t make and break the ozone or expand the atmosphere, which affect air pressure, hence the trade winds?
Do you suppose that warm water builds up in the western Pacific because of geothermal activity there? Or from some other heat source?
Same goes for the PNA as well:
https://www.sciencedirect.com/science/article/pii/S1364682617305941
Who cares about biased peer review.
Since this is not my research, I don’t have to do a damn thing. I am just telling it as it has been presented.
And the only thing that Leamon & McIntosh have to do is convince two referees and one editor that their work is worthy of publication.
Which is why in today’s world, garbage gets published in so called “peer reviewed journals”.
Yet you want peer review of the obvious fact that the sun warms the tropical Pacific, and more so when the UV portion of its spectrum is greater?
There are both, high quality and garbage studies. The reader must be able to discern the difference.
So, it’s not that a study is peer-reviewed that matters, but its inherent quality, as Einstein insisted.
With pal review in “climate science”, peer review is a bad joke, which has cost the world millions of lives and trillions of treasure.
The situation is the same today as 150 years ago in science. The only thing that has changed is a lot more scientists and a lot more journals.
Actually it is a lot more difficult to publish these days in a good journal. You would be surprised of the things that were published in Science or Nature just 70 years ago, and as I said Schwabe’s study on the cycle that carries his name was based on only 18 years of data. Not even twice the length. I guess peer review has been getting tougher, not easier.
Yeah, he obviously didn’t consider all the possible confounding variables, so the 11 year solar cycle is busted. /sarc
“consider all possible confounding variables”? Really? Given the subject I’d think there are way too many of those to possibly consider. Me thinks you have set the bar unreasonably high.
Sorry to put up another post but here a possible lunar tidal explanation for the observed 11-year cycle in the upwelling of cold deep ocean water off the west coast of South America that favors La Nina events.
The dominant frequencies in the time series for speed of the Earth’s rotation (as measured by the LOD) are the tropical month (mean leangth 27.32158 days) and half the tropical year (365.2421897 / 2 days = 182.621095 days).
Lunar contribtions to changes on the Earth’s rotation rate exhibit a prominent repetition cycle of 1 tropical month. The tropical month is a measure of the time betweeen consecutive crossings of the Earth’s equator (in the same direction) by peaks in the lunar atmospheric and oceanic tidal bulges.
In addition, the contribution to changes in the Earth’s rotation rate from the seasonal varaitions in the latitudes of the east-west (zonal) winds exhibit a prominent reptition cycle of 1/2 a tropical year.
Hence, if you are interested of the effect of the interaction of the lunar tidal cycle with seasonal cycles upon the Earth’s rotation rate, you would find that it would occur at th ebeat period of:
7 x 1 tropical month = 191.25106 days
1/2 tropical year = 182.621095 days
(191.25106 x 182.621095) / (191.25106 – 182.621095) = 4047.11699 days = 11.08 tropical years.
This compares with the characteristic interaction time between the graviational force of Jupiter on the outher layers of the Sun with periodoc peakes in the tidal force of alignments of Venus and the Earth which has a period of 11.07 sidereal years.
Hence, the synchronization between the lunar tidal forces and the solar sunspot cycle.
Thank you for posting, Ian.
While I have no problem with beat period calculations I must confess that I do have problems understanding the astronomical calculations that go into your posts and their relevance. I hope you get everything published soon and it is evaluated and discussed by other experts that can judge it better than me. As I understand it, having a frequency that can be described in terms of the beat of two faster frequencies does not prove that it is produced that way.
Javier,
Most people have no problem with understanding the following problem:
If Bob takes three hours to build a dog house and Jill takes 3 hours to build a dog house, how long will it take Bob and Jill working together to build a dog house?
The answer is half the time or 1 1/2 hours (as long as they do not get in each other’s way).
All problems of this nature i.e. problems involving comparable rates have an answer which is just 1/2 the HARMONIC mean of the two rates.
i.e. 3 x 3 / (3 +3) = 9/6 = 1 1/2 hours.
This type of solution applies to the realignment of two bodies (e.g. planets) which are in roughly circular orbits (and moving almost constant speeds) in the opposite directions.
Imagine if planet A and planet B are aligned on the same side of the Sun. If planet A takes one year to circle the Sun and the more distant planet B takes two years to circle the Sun, how long will it take for the two planets to realign if the two planets are moving in opposite directions?
NOTE: Since planets A and B are moving in opposite directions, they are both working towards achieving the same goal i.e. to realign on the same side of the Sun.
The answer is: 1 x 2 / (1 + 2) = 2/3 of a year.
The same is true for the interaction of any two cyclic phenomena provided they are working towards same goal e.g. The response of the Earth’s rotation rate to the monthly lunar tides (i.e the tropical month) and the response of the Earth’s rotation rate to the seasonal changes in the zonal winds (i.e. half the seasonal (tropical) year). If you work out when they achieve their common goal, you get 11.08 years.
Seven out of nine solar cycles in the 20th century were only around a mean 10.4 years duration.
Ulric,
The pertinent time here is the synchronization of the date of solar minimum with a period of 11.07 years. If you look at the solar sunspot record you find that:
If the first minimum for SC 25 occurs between 2019.24 and 2022.94 (i.e. ~ 2021 +/- 2 years), it will indicate a re-synchronization of the average time between solar minimums to a value of 11.07 +/- 0.05 years over the 410 year period since 1610.
http://astroclimateconnection.blogspot.com/2012/04/v-e-j-tidal-torquing-model-maunder.html
So the shorter sunspot cycles were not synchronizing finely with the JEV alignments or the tidal periods.
I see only 6 solar cycles, too small of a sample size to show statistical significance. At this point, it could still be simply an interesting coincidence. Unless you think you have identified a causal mechanism? (Now I’m going to read the rest of the comments and see if you talked about that already.)
“…Many decades…” No, it’s five cycles. This is wiggle-matching.
El Nino/La Nina is a human-defined index. I would need to see correlation with something less arbitrary to be convinced of anything.
> As they say in the talk, the probability that the pattern is due to chance is very low.
Personally I’d wait for more than a half dozen hard to measure pseudo cyclic observations before calling “low probability” because… you know, science.
This is the definition of observational science. The authors came up with an hypothesis and provided an immensely falsifiable prediction that is testable within the next 5 years or so. Almost all of us will live to see its outcome.
Compare that to all these fancy computer models that can only make a falsifiable prediction after 100 years or so. Of course, we will all be dead by then.