
The Fable of Chicken Little of the Sea
Guest essay by David Middleton,
When it comes to debunking Gorebal Warming, Chicken Little of the Sea (“ocean acidification”) and other Warmunist myths, my favorite starting points are my old college textbooks.
Way back in the Pleistocene (spring semester 1979) in Marine Science I, our professor, Robert Radulski, assigned us The Oceans by Sverdrup (yes, that Sverdrup), Johnson and Fleming. Even though it was published in 1942, it was (and may still be) considered the definitive oceanography textbook. I looked up “ocean acidification” in the index… It wasn’t there.
The notion that CO2 partial pressure influences the pH of seawater isn’t a new concept, *surely* ocean acidification must have been mentioned in at least one of my college textbooks.
So, next I turned to my Stratigraphy & Sedimentation (also Spring Semester 1979) textbook, Principles of Sedimentology by Friedman (yes, that Friedman) and Sanders. There’s an entire section on the relationship between CO2 and pH and how if affects calcium carbonate precipitation and dissolution…
When the pH of seawater decreases, calcium carbonate dissolves. In warm, shallow seas, at a pH of about 8.3, dissolution of aragonite and calcite particles by inorganic processes is almost nonexistent. However, since the classical studies of the Challenger expedition, it has been known that the proportion of calcium-carbonate particles in seafloor sediments decreases as depth of water increases (Table 5-1). Such decrease is particularly rapid at depths between 4000 and 6000 m. Although the reasons for this decrease have been debated, the evidence suggests that calcium carbonate dissolves because the CO2 concentration increases with depth. The control on CO2 appears to be part biological; it results from biological oxidation of organic-carbon compounds. Also, the water masses at greater depth were derived from the polar region; their temperature is lower and the water contains more dissolved CO2. Increased concentration of CO2 is in turn reflected by lower pH, which leads to calcium carbonate dissolution. However, the increase of pressure with depth may also be involved; such increase affects the dissociation of carbonic acid (Eqs. 5-11 and 5-12). The depth at which the calcium-carbonate decreases most rapidly is known as the carbonate-compensation depth, defined as the depth at which the rate of dissolution of solid calcium carbonate equals the rate of supply.
Friedman and Sanders, pages 133-134.


A very thorough, easy to read, description of the relationship between CO2 and seawater pH… However, the phrase “ocean acidification” is notably absent from the entire 300+ pages. How is this possible?
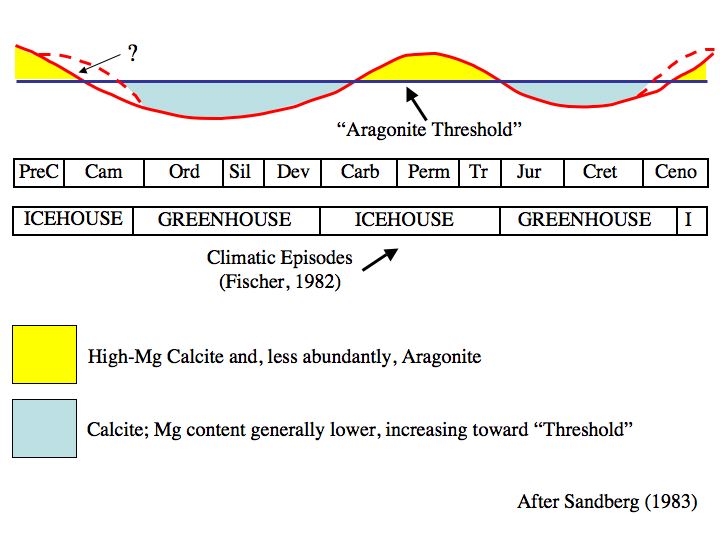
Even way back then, we knew that past atmospheric CO2 concentrations were often much higher and the oceans had oscillated between calcite and aragonite seas during periods of high and low atmospheric CO2 concentrations.
Dr. Drobnyk was the department chairman and he assigned us a brand new textbook… Friedman & Sanders was published in 1978… Surely ocean acidification just had to be mentioned in it.
Surely…
Why wasn’t the relationship of CO2 and pH called Ocean Acidification prior to the Gorebal Warming Myth?
Because seawater cannot become acidic (at least not under real world conditions) and Communism was sufficiently scary as far as bureaucrats were concerned, prior to the end of Cold War I.
A study of seawater pH near active volcanic CO2 vents in the Mediterranean (Kerrison et al., 2011) found that the pH immediately adjacent to the vent was still alkaline, despite being subjected to the equivalent of nearly 5,600 ppm CO2.

Partial pressure and fugacity (μatm) are a little lower than what the mixing ratio (ppm) would be, depending on temperature and humidity. However, they are close. A partial pressure (pCO2) of 350 μatm generally equates to about 350 ppm in the atmosphere. At nearly 5,600 ppm CO2 the seawater was still alkaline, not acidic.
Straw man! The “ocean acidification” hypothesis clearly states that the oceans won’t become acidic.
Since someone will likely accuse me of manufacturing a straw man…
Calling this phenomenon “ocean acidification” when surface seawater will remain “basic” under future emissions scenarios is alarmist
Just as we describe an increase in temperature from -40°F to -20°F as warming, even though neither the starting nor the ending temperature is “warm,” the term “acidification” describes a direction of change (i.e. increase) in the level of acidity in the global oceans, not an absolute end point. When CO2 is added to seawater, it reacts with water to form carbonic acid (H2CO3); hence acid is being added to seawater, thereby acidifying it. Similarly, in the example about human blood, a drop in pH is referred to as acidosis, even though the point where acidemia begins (7.35) is still above 7.
That’s all well and good. It’s even true-ish… However, the science of seawater geochemistry has been around a long time. The relationship between CO2 and pH has been observed for a long time. Why did they suddenly fabricate the phrase “ocean acidification” to describe this process? Because “people” are almost as afraid of acid as they are of radiation.
The phrase was literally invented out of thin air in 2003 by Ken Caldiera…
However, while the chemistry is predictable, the details of the biological impacts are not. Although scientists have been tracking ocean pH for more than 30 years, biological studies really only started in 2003, when the rapid shift caught their attention and the term “ocean acidification” was first coined. What we do know is that things are going to look different, and we can’t predict in any detail how they will look. Some organisms will survive or even thrive under the more acidic conditions while others will struggle to adapt, and may even go extinct. Beyond lost biodiversity, acidification will affect fisheries and aquaculture, threatening food security for millions of people, as well as tourism and other sea-related economies.
Scientists have been tracking ocean pH for more than 30 whole years! Wow! 30 fracking years. That’s like a whole geological nanosecond!
This is so idiotic, it deserves repeating:
What we do know is that things are going to look different, and we can’t predict in any detail how they will look.
Bullschist!!!
We have a pretty good idea how things will look… They will look very much like they do today.
Scientific Reports volume 4, Article number: 5261 (2014)
Larger CO2 source at the equatorial Pacific during the last deglaciation
Kaoru Kubota, Yusuke Yokoyama, Tsuyoshi Ishikawa, Stephen Obrochta & Atsushi Suzuki
Abstract
While biogeochemical and physical processes in the Southern Ocean are thought to be central to atmospheric CO2 rise during the last deglaciation, the role of the equatorial Pacific, where the largest CO2source exists at present, remains largely unconstrained. Here we present seawater pH and pCO2 variations from fossil Porites corals in the mid equatorial Pacific offshore Tahiti based on a newly calibrated boron isotope paleo-pH proxy. Our new data, together with recalibrated existing data, indicate that a significant pCO2 increase (pH decrease), accompanied by anomalously large marine 14C reservoir ages, occurred following not only the Younger Dryas, but also Heinrich Stadial 1. These findings indicate an expanded zone of equatorial upwelling and resultant CO2 emission, which may be derived from higher subsurface dissolved inorganic carbon concentration.
Kubota et al, 2014 found…
pH and pCO2 reconstruction
Using our revised calibration, we reconstructed pH from our new δ11B measurements on Tahitian corals, as well as from previously reported data11 from both the Marquesas and Tahiti, and the overall result is consistent with the WEP foraminifer δ11B variations10 (Fig 3a and b). The oldest coral sample, dated to 20.7 ka BP during the last glacial maximum (LGM), exhibits a relatively high pH (8.26). From 15.5 to 9.0 ka BP, pH is generally constant within uncertainty (8.15–8.22) and consistent with the preindustrial value of 8.20. Four notable pH excursions are associated with HS1 and the YD. Two of our samples exhibit anomalously low pH at the end of HS1 (8.13 at 15.15 ka and 8.09 at 14.99 ka BP), in addition to those at end of the YD at the Marquesas11. The low pH following HS1 had been previously undetected at this location. Calculation of pCO2 (see Methods) reveals deglacial values significantly above those of the atmosphere (Figs. 3c and 4a). Conversely, ΔpCO2during last glacial and the early Holocene was nearly zero, suggesting air-sea CO2 equilibrium.
…Periods of anomalously low pH and high pCO2 near the transitions from Heinrich Stadial 1 (8.08-8.15 & 300-350 μatm) to the Bølling/Allerød, during the Bølling/Allerød interstadial (8.15-8.20 & >300 μatm) and at the onset of the Holocene (8.02-8.10 & 350-420 μatm).

Oddly enough, Steinthorsdottir et al., 2013 also found evidence of anomalously high atmospheric CO2 levels during Bølling/Allerød interstadial and the onset of the Holocene.
Quaternary Science Reviews 68 (2013) 43-58
Stomatal proxy record of CO2 concentrations from the last termination suggests an important role for CO2 at climate change transitions
Margret Steinthorsdottir, Barbara Wohlfarth, Malin E. Kylander, Maarten Blaauw, Paula J. Reimer
Abstract
A new stomatal proxy-based record of CO2 concentrations ([CO2]), based on Betula nana (dwarf birch) leaves from the Hässeldala Port sedimentary sequence in south-eastern Sweden, is presented. The record is of high chronological resolution and spans most of Greenland Interstadial 1 (GI-1a to 1c, Allerød pollen zone), Greenland Stadial 1 (GS-1, Younger Dryas pollen zone) and the very beginning of the Holocene (Preboreal pollen zone). The record clearly demonstrates that i) [CO2] were significantly higher than usually reported for the Last Termination and ii) the overall pattern of CO2 evolution through the studied time period is fairly dynamic, with significant abrupt fluctuations in [CO2] when the climate moved from interstadial to stadial state and vice versa. A new loss-on-ignition chemical record (used here as a proxy for temperature) lends independent support to the Hässeldala Port [CO2] record. The large-amplitude fluctuations around the climate change transitions may indicate unstable climates and that “tipping point” situations were involved in Last Termination climate evolution. The scenario presented here is in contrast to [CO2] records reconstructed from air bubbles trapped in ice, which indicate lower concentrations and a gradual, linear increase of [CO2] through time. The prevalent explanation for the main climate forcer during the Last Termination being ocean circulation patterns needs to re-examined, and a larger role for atmospheric [CO2] considered.
[…]
Although records of atmospheric [CO2] as obtained from air bubbles in ice cores provide a good overall picture of the [CO2] conditions during approximately the past 800,000 years of the last ice age (Shackleton et al., 2000; Monnin et al., 2001), these records do not typically record short-term oscillations (<200 years), due to smoothing effects caused by both diffusion of gasses within the ice and time-averaging of ice core records (Shackleton et al., 2000; Siegenthaler et al., 2005). However, large short-term oscillations of [CO2] may be extremely important in the climate system, as so-called tipping points may be reached rapidly, causing severe changes in steady state climate (Broecker, 1997, 2006).
[…]
Setting aside the blather about “tipping points” and “a larger role for atmospheric [CO2]” as a climate “forcer,” Steinthorsdottir et al., 2013 demonstrates sharp rises in atmospheric CO2 near the end of the Bølling/Allerød interstadial (400-450 ppm) and at the onset of the Holocene (>300 ppm).

concentrations (see Table 3 for errors). On the right hand side is an Antarctic CO2
record reconstructed from air bubbles in the ice cores obtained at Dome C by the EPICA project (Monnin et al., 2001), synchronized with the Greenland ice core timescale (Lemieux-Dudon et al., 2010). The ages of the main climate change boundaries for each record are illustrated with dashed lines, surrounded by their error ranges in light grey (based on Walker et al., 2008 for the Greenland ice core chronology). The darker grey bars, which overlap the error ranges shown in light grey, illustrate that the ages for each of the boundaries are comparable within their error ranges. The records, although displaying some similarities, are clearly different. Firstly, the magnitude and range of CO2 concentrations are much larger in the Hässeldala Port record. Secondly, the stomatal-based record shows a more dynamic CO2 development through time, in particular across the climate change boundaries, while the ice core-based record shows an almost linear, smoothed development.”
Just about every method of estimating pre-industrial Late Quaternary CO2 levels apart from Antarctic ice cores shows much larger magnitudes and ranges of CO2 concentrations with far more dynamic CO2 development through time… because they are all higher resolution measurements than 99% of Antarctic ice cores For that matter, the magnitude, range and dynamism of Antarctic ice core CO2 varies with resolution. Most of the Gorebal Warming mythology is the result of the correlation of low resolution Antarctic ice cores to higher resolution temperature measurements and proxies.
While it is true that, all-other-factors-held-equal, seawater pH should decline as atmospheric CO2 levels rise…

All other factors are never held equal.

Paleo pH estimates more closely match the PDO than CO2…


Amazingly… Almost all of the post-1978 references are supposedly examples of ocean acidification…
References
Dore, J.E., Lukas R., Sadler, D.W. Church, M.J., Karl, D.M. (2009). “Physical and biogeochemical modulation of ocean acidification in the central North Pacific.”
Proc Natl Acad Sci USA 106:12235–12240.
Friedman, G.M. and Sanders, J.E. (1978) “Principles of Sedimentology”. Wiley, New York.
Kerrison, Phil & Hall-Spencer, Jason & Suggett, David & Hepburn, Leanne & Steinke, Michael. (2011). “Assessment of pH variability at a coastal CO2 vent for ocean acidification studies.” Estuarine and Coastal Marine Science. 94. 129-137. 10.1016/j.ecss.2011.05.025.
Kubota K., Yokoyama Y., Ishikawa T., Obrochta S., Suzuki A. “Larger CO2 source at the equatorial Pacific during the last deglaciation.” (2014) Scientific Reports, 4 , art. no. 5261.
Pelejero, C., Calvo, E., McCulloch, M.T., Marshall, J.F., Gagan, M.K., Lough, J.M. and Opdyke, B.N. 2005. “Preindustrial to modern interdecadal variability in coral reef pH.” Science 309: 2204-2207
Steinthorsdottir, Margret & Wohlfarth, Barbara & Kylander, Malin & Blaauw, Maarten & Reimer, Paula. (2013). “Stomatal proxy record of CO2 concentrations from the last termination suggests an important role for CO2 at climate change transitions.” Quaternary Science Reviews. 68. 43-58. 10.1016/j.quascirev.2013.02.003.
Sverdrup, H. U. M. W., Johnson and R. H. Fleming, “The Oceans—Their Physics, Chemistry, and General Biology,” Prentice-Hall, Upper Saddle River, 1942.
Wei, G., McCulloch, M.T., Mortimer, G., Deng, W. and Xie, L. 2009. “Evidence for ocean acidification in the Great Barrier Reef of Australia.” Geochimica et Cosmochimica Acta 73: 2332-2346.
Zeebe, Richard E. and Wolf-Gladrow, Dieter A.
CARBON DIOXIDE, DISSOLVED (OCEAN)…
Proof that Chicken Little of the Sea has a sense of humor. If that’s not funny enough, the featured image came from…
http://ocean.si.edu/blog/have-we-hit-chicken-little-point-ocean-conservation
Discover more from Watts Up With That?
Subscribe to get the latest posts sent to your email.
“However, while the chemistry is predictable, the details of the biological impacts are not. ”
Well, if they cared, they could ask a biologist. The details of the biological impacts ARE predictable. Pretty well known, if fact.
* impact of more CO2: more photosynthesis, more life, more organic compounds. Now you can find it awful…
* more photosynthesis also means less “more CO2”
* impact of pH dropping because of more CO2: zilch. +/-1 unit around 7 outside just mean nothing for living being. heavily charged with C2, unbuffered rain is at pH ~5, did you noticed any effect on you, animal, or plants? of course not. pH of rain can be as low as 2 in a storm, because storm produce NOx turning into acid, and that’s the level you must get to start observing some effect on plants; not that this harm them directly, but it affects the availability of nutrient
That’s definitely true for marine calcifers that rely on photosynthesis.
I’ve read anecdotal accounts of visible greening of plants after a severe electrical storm supposedly from nitric acid rained out from the lightning.
David, First line
“When if comes”
Perhaps you meant “When it comes”?
Spellcheck doesn’t catch typos that are spelled correctly…
I dough knot no what you R talking about.
Thank you for this thorough analysis and historical perspective of why ocean acidification fears are totally bogus. Warm water hold less CO2 than cold water, so which came first? Did warming cause release of CO2 from the ocean or did CO2 cause the warming? I vote for the former, not the latter.
Nice work again David. Boomers tend to think things were in balance when they were kids, or sometime before Rachel Carson, and then the balance was destroyed by capitalism something something. I also like the suggestions that one would have to know a lot of biology to figure this out. “The control on CO2 appears to be part biological; it results from biological oxidation of organic-carbon compounds.”
Not all boomers… I was born in 1958. Towards the end of the Baby Boom, colleges were still generally sane in the late 1970’s.
David, I was teaching in the 70s and I can attest from personal experience that it was a period of significant ‘grade inflation’ and also when, in an effort to achieve gender parity, one’s chromosomes became of greater importance than competence when hiring teachers. Also, it was a period of time when the number of administrators increased, and to be able to pay them, the colleges hired large numbers of part-time instructors, with lower salaries and few benefits. We still live with those problems.
SCSU may just have been behind the times.
David,
Hopefully! Your competence suggests that was the case. 🙂
David, I need to make an exception for all atmospheric CO2 values besides ice cores. Every proxy for CO2 is influenced by local to regional CO2 levels, not global. The problem is that local/regional CO2 levels can change per hour, per day per month, per season and even over longer periods like the MWP vs. the LIA. All depends of the landscape in the main wind direction and even the main wind direction can change over long periods (like MWP vs. LIA…).
Have a better look at fig. 8: while the resolution of the stomata data is 2-4x better than for the ice core data, what is measured are regional CO2 data not far from the main ice melt / freezing events, while ice core data are global within a few ppmv, be it averaged over ten years (Law Dome) to several hundreds of years (Dome C).
Take the CO2 “peak” in the stomata data of around 12750 BP. A peak of about 80 ppmv in less than 50 years up and down. That is globally the equivalent of burning about half of all vegetation in a glacial world and regrowth in the same 50 years. Or a sudden acidification of the oceans, but even so the excess CO2 can’t be absorbed in such short time frame, even if the pH was restored.
Thus any CO2 proxy that shows higher levels and/or more variability than ice cores only shows local levels and variability, not global. Moreover, whatever the local CO2 levels: if their average differs from the ice core average over the resolution of the ice cores, then the local CO2 levels are (mostly positively) biased…
A similar problem with ocean pH/pCO2: you can’t directly compare the pH of a reef, which can change with 1 pH unit within a day with the pH from open ocean samples which mainly change with seasonal temperature and organic growth…
Ferdinand,
One of these days, I’m going to put together a through analysis of resolution and CO2. Stomata chronologies are certainly noisier than ice cores. However, it has been demonstrated over and over that the application of a smoothing filter to the stomata signal generally matches the Antarctic ice cores. Furthermore, a similar application of smoothing filters to high resolution ice cores (Law Dome DE08) matches the signal of lower resolution Antarctic ice cores.
I agree that reefs are not ideal places to measure pH… Too much photosynthesis and other processes going on. However, boron isotopes are about the only way to estimate past pH levels (apart from circular reasoning CO2 calculations). And cores of fossil porites seem to be the main source of boron isotope data.
The interesting thing about Kubota et al., is that the low pH levels were correlated with high pCO2 levels.
David, even if you smooth the stomata data to the same level as the ice core data, there still is too much variability and in many cases a huge (mostly positive) bias in the stomata data. Just try it with the data of Fig. 8 in this discussion…
Which doesn’t mean that these data can’t show interesting features. The connection between stomata CO2 data in South Sweden and the Bølling/Allerød events may be a matter of regional temperature and plant growth or indeed increased volcanic events (Iceland?) due to less pressure from land ice… The only point is that you can’t use these data as “global” or “background” data…
[To see this comment properly formatted, click the Read More link at the end of the visible comment. – kh]
I have written three posts here on Ocean Acidification.
Dr. Christopher Cornwall Responds to “Ocean Acidification: Trying to Get the Science Right” at https://wattsupwiththat.com/2015/09/dr-christopher-cornwall-responds-to-ocean-acidification-trying-to-get-the-science-right/
Ocean Acidification: Trying to Get the Science Right at https://wattsupwiththat.com/2015/09/ocean-acidification-trying-to-get-the-science-right/
and
Press Release Science: ‘Dissolving Starfish’ – debunked at https://wattsupwiththat.com/2018/03/press-release-science-dissolving-starfish-debunked/
each of these reference the state of the science document from the European Project on OCean Acidification (EPOCA) produced booklet “Guide to best practices for ocean acidification research and data reporting” available at http://www.eurosfaire.prd.fr/7pc/doc/1303284415_kina24328enc_002.pdf
It is not informative to rant on about how “ocean acidification” is stupid, a myth, not happening (etc.) because one disagrees with its current name. It might have been better named but there it is — the subject has been given a name and we are more or less stuck with it.
Changes in near-surface sea water pH caused by changes in atmospheric CO2 concentrations are expected, do occur and have been measured. In the long-term, it will be reduced in effect by mixing with the deeper oceans.
There is, however, nothing scary about it, it can not rationally be expected to cause any sort of extreme change or damage to the sea or its occupants.
Kip, I think that the importance of objecting to the term “ocean acidification” is the motivation for adopting the term in the first place. Some have said that it is no big deal, but when presented with a multitude of reasons to stop using it, they keep using it. That tells me that the motivation is psychological and of more importance than scientific accuracy or concern for communication. This is about Psy-Ops, not Sci-Facts.
Clyde ==> Of course, the name was chosen for propaganda purposes. Just like Global Warming. Every social/political movement uses this type of word choice.
It is not incorrect scientifically — just conveniently easily misunderstood by a scientifically ignorant general public.
It is always better to educate as opposed to simple railing against such a choice. When we educate, we expose the duplicity of the propagandists, which has much greater value than simply repeating a silly skeptic mantra by objecting to the name of the phenomena.
It is nearly impossible to expunge a term once it has been generally accepted by the general public — unless one controls the mass media. We do not — the Consensus does. So we must fall back on exposing them through education.
Just one or two TV science shows explaining that the Oceans will never become acidic and why it is impossible might do the trick.
The public does not like being tricked — and reacts with a backlash when these tricks are exposed.
This is why the Consensus attacks Crockford with so much ferocity — she educates the general public about the trick played on them about AGW and Polar Bears.
A pH change from 8 to 7 is not ‘acidification’ since it reduces the corrosiveness of the solution. A further reduction in pH then makes it more corrosive again. Thus the analogy with ‘warming’ from -20C to -10C does not hold. (In reality there is no such thing as a negative temperature anyway)
It certainly is ‘acidification’, it’s a ten-fold increase in the concentration of hydrogen ions.
Then… Why wasn’t the process called “ocean acidification” prior to 2003? It’s not like carbonate geochemistry is a new science.
David, formally Phil. is right, but of course “less alkaline” sounds less scary than “more acidic” with visions of herring swimming in vinegar…
I hear that pickled herring is a popular treat in some countries.
The process was not called “ocean adicification” prior to 2003.
Technically, it’s called a shoaling of the lysocline or carbonate compensation depth. At least that’s what it was called prior to 2003.
It’s not about sounding scary, chemists have never used the ‘less alkaline terminology’.
You’re wrong.
Chemists (I’m one) use the term “acidification” to mean the reduction of pH below 7.
And how would you describe the process of adding an acid to a solution to change its pH to 8.0?
Phil: I would describe it as “an adjustment of the pH to 8.0”.
But then, I’m only a chemist.
Phil: I would describe it as “an adjustment of the pH to 8.0”.
But then, I’m only a chemist.
Yes, which is a good way to describe it, e.g. ‘adjust the pH to 8.0 by adding acid’.
You wouldn’t use the phrase, ‘make it less alkaline by adding acid’.
But they have used “less basic”.
Why not say “less caustic” with visions of children swimming in Drano…before Man’s CO2 saved them? 😎
Because chemists don’t find the word ‘acid’ to be scary.
Well Arrhenius introduced the concept of acid being due to H+ ions over a century ago, so the idea that increasing [H+] by adding acid to a solution is rather an old one to chemists. It’s been referred to as ‘acidification’ for a very long time.
And the process as it applies to carbonate geochemistry has been known since the Challenger expedition. Why wasn’t it called “ocean acidification” from 1891-2003?
The Challenger expedition took place in 1872-76 before the modern concept of acids developed by Arrhenius in the 1890s and before the ability to measure the [H+] developed in the 30s (Beckman) and the concept of pH by Sorenson (1909). So I think your claim re the Challenger expedition is flawed. Reasonable calculations of the effect of absorption of CO2 by the ocean started with Callender (1938) but wasn’t really taken on board until the work of Revelle and Seuss in 1957. Following that Sillen was the first to investigate ocean pH (1961). The inability of the technology to adequately measure the changes in pH was noted by Keeling in the late 60s and such work was avoided for decades. Development of suitably accurate measurement techniques proceeded through the 80’s. Since the ability to measure the changes didn’t exist until the 90’s it’s no wonder the term only came into use recently.
The inability of the technology to adequately measure the changes in pH is still with us… seawater pH is more often calculated from DIC & TA than it is measured… has a lot to do with being a non-conservative quantity.
🍻
My 1978 Strat. & Sed. textbook explained the process exactly as it’s understood today, based on the results of the Challenger expedition… 25 years before the phrase “ocean acidification” was invented to scare the Bejesus out of people.
Phil,
You failed to mention the guy on whom I wrote my PhD thesis, German chemist Justus von Liebig. In 1838, he posited a new theory of acids, having investigated the chemical composition of organic acids. His theory of acids suggested that all acids contain one or more hydrogen atoms which can be replaced by metal atoms to produce salts.
His definition was widely used for about fifty years, until Arrhenius published his new acids-base theory. However, Liebig’s definition was similar to Arrhenius’ more modern formulation.
Liebig correctly stated that acids contain hydrogen, while Arrhenius went further to argue that acids produce hydrogen ions when in aqueous solution. In order to release hydrogen ions, an acid obviously must contain hydrogen, so it’s not as if Liebig were wrong. However, his definition doesn’t say anything about bases, and is therefore limited and mainly only of historical interest today.
But in 1872, chemists on the Challenger Expedition had an adequate, as far as it went, concept of acidity.
Humphrey Davy recognized that acids contained hydrogen atoms, Leibig introduced the restriction that they could be replaced by metal atoms.
But in 1872, chemists on the Challenger Expedition had an adequate, as far as it went, concept of acidity.
Well they had a concept of what an acid was but that certainly wasn’t adequate for: “the process as it applies to carbonate geochemistry has been known since the Challenger expedition”.
Phil,
Are you sure that that knowledge was insufficient?
I freely admit that I myself personally haven’t read the Challenger report and assessed its findings against present knowledge of ocean chemistry.
But my general impression of late 19th century chemical understanding remains high.
It was good enough that my 1978 Strat & Sed textbook cited it as the “discovery” of the relationship between CO2 and seawater pH.
What results did they quote for this discovery? Dittmar’s analysis of the Challenger samples (1884) didn’t include pH, but he did determine that the carbonate species were predominantly bicarbonate.
Shortly after the Challenger expedition Arrhenius nearly got a failing grade on his PhD thesis for his ‘ridiculous’ proposition that acids, bases and salts dissociated into ions when dissolved in water. (Twenty years later he got the Nobel prize for that work!)
Try reading the post. It’s near the beginning… Murray & Irvine, 1891.
There’s no mention of pH in the Challenger results, Dittmar found that the carbon species were mostly bicarbonate and was unsaturated at depth (greater than 1500 fathoms).
Read the quote from Friedman & Sanders, 1978.
Murray & Irvine, 1891, using data from the Challenger expedition, recognized that the proportion of CaCO3 in seafloor sediments decreased with depth. Somewhere between 1891 and 1978, it was recognized that this was due to the relationship between CO2 and pH and that the oceans had oscillated between calcite and aragonite seas throughout the Phanerozoic. By 1983, it was recognized that pCO2, Mg/Ca and water temperatures guided this process. Then in 2003, the process was labeled ocean acidification to scare the Bejesus out of people.
None of which supports your contention that
It was good enough that my 1978 Strat & Sed textbook cited it as the “discovery” of the relationship between CO2 and seawater pH.
Phil,
First of all, the behavior of an aqueous solution with respect to other materials depends on the pH. That is, an acid will react with most metals (e.g. zinc) to release hydrogen, but (with the exception of amphoteric metals like aluminum) the addition of an alkaline solution to the metal will not release hydrogen. The pH is a convenient way of expressing where on the scale of acid-base a solution resides. Because the dissociation constant varies only slightly with temperature, for all practical purposes the product of the hydronium ion and hydroxyl ion has to be 10^-14. So, what is really important is the ratio of hydronium ion to hydroxyl ion. When they are in equal concentration (1:1), there is no excess to react with other things. If the ratio is greater than 1, then there are an excess of hydronium ions available to react with a base or metal. When all the excess hydronium ions are reacted, then the solution will be back to a pH of 7. On the other hand, if you add a solution of pH 8 to a solution of equal volume of pH 8, you don’t get a reaction. You just double the quantity of solution. In a similar manner, if you add two equal quantities of different alkaline solutions together, you don’t get a reaction, you just dilute the stronger solution so that the resulting solution is the average of the two.
Above you insulted me by stating, “My starting assumption is that the laws of chemistry applied in the same way as they do now, something you show your ignorance of in this thread.” I’m not impressed by your vaunted knowledge of chemistry. You are simply parroting the party line of the Alarmists.
Not to be picky but pH is actually a result of chemical reactions , not the cause.
The reactions happen, THEN the pH changes (or doesn’t).
What else might be in the water doesn’t effect pH unless it hinders the chemical reaction and/or is involved in other chemical reactions that effect a pH change.
Add something living into the mix…
(How many out there would dip their finger into Hydrochloric acid? Your stomach produces it. Yet you survive.)
“Not to be picky but pH is actually a result of chemical reactions”
Yes, at least at these very dilute concentrations. The reactions are between the more abundant species, CO₂, HCO₃⁻ and CO₃⁻⁻. [H⁺] is fixed by an equilibrium relation with any of those ions. It is a marker, not a significant reagent. Not at 1e-8M.
Above you insulted me by stating, “My starting assumption is that the laws of chemistry applied in the same way as they do now, something you show your ignorance of in this thread.”
Well you’ve made so many errors in the chemistry in this thread it’s hard to think otherwise.
For example:
In a similar manner, if you add two equal quantities of different alkaline solutions together, you don’t get a reaction, you just dilute the stronger solution so that the resulting solution is the average of the two.
Try adding 1M Calcium acetate to 1M Sodium hydroxide, what’s that white precipitate?
Phil,
You have been challenged by others with respect to statements that you have made, at least one of whom says he is a chemist. I don’t think that you should get too impressed with your ‘superior’ chemical knowledge.
OK, I didn’t explicitly exclude solutions with ions that will react. However, inasmuch as we have been talking about sea water and buffered solutions, I was thinking of solutions with the same species and different pH. I think that you are working too hard to find fault instead of trying to understand the issues.
Phil,
You have been challenged by others with respect to statements that you have made, at least one of whom says he is a chemist.
Yes and rebutted them, the chemist said the following for example:
Like Nick Stokes, you have no understanding of buffers. A ten-fold increase in [CO2] causes the position of the carbonate/bicarbonate/carbonic acid equilibrium to shift slightly, resulting in only a very small increase in [H+}.
However as I pointed out:
“At pH 8 CO2 is ~10^-5 mol/kg, at pH 7 CO2 is ~10^-4.”
so a ten-fold increase in CO2 produces a ten-fold increase in [H+], hardly “very small”.
OK, I didn’t explicitly exclude solutions with ions that will react. However, inasmuch as we have been talking about sea water and buffered solutions, I was thinking of solutions with the same species and different pH.
When you made that remark you were not referring to sea water, you opened up with the reactions of acids with metals!
Phil.
(Careful, the blockquoting of several earlier remarks is difficult to verify.)
Phil: Yes, the math works out that way. If the initial and final two pH are are stated – but only for a static, simplistic acid-base-salt solution!
However, this is a highly buffered solution, with the reactants all in huge quantities. Thus the actual mid-ocean buffered solution CANNOT reach either the assumed initial state (of pH = 8) NOR the assumed final state (of pH = 7) in the real world. There is not enough CO2 able to be made from all the fossil fuel ever found underground and in the rocks to change the ocean pH by a magnitude of 1.0 There is not enough acid of any type that could be loaded in the Pacific Ocean to change the water around the reef by a magnitude of 1.0
Hence, your math is correct – and simultaneously dead wrong.
You appear to be confused by the quoting of earlier remarks. To clarify:
In
https://wattsupwiththat.com/2018/06/the-total-myth-of-ocean-acidification/#comment-2371929
It was said:
“Like Nick Stokes, you have no understanding of buffers. A ten-fold increase in [CO2] causes the position of the carbonate/bicarbonate/carbonic acid equilibrium to shift slightly, resulting in only a very small increase in [H+}.
Which is wrong, as I pointed out a ten-fold increase in CO2 leads to a ten-fold increase in [H+].
You said “Yes, the math works out that way. If the initial and final two pH are are stated – but only for a static, simplistic acid-base-salt solution!
It’s not the ‘math’ it’s the chemistry. The statement made about buffers was specifically about the ‘the carbonate/bicarbonate/carbonic acid equilibrium’ which is exactly what I responded to.
Real world examples agree with my assessment. In the paper by Kerrison referred to in the head post he gives the following data for the vicinity of a CO2 vent:
Location B, pH 8.08, CO2 11.6 𝝁M, CO3^2- 240 𝝁M
Location E, pH 7.15, CO2 131.6 𝝁M, CO3^2- 33 𝝁M
So an approx. ten-fold increase in CO2 gives ~10-fold increase in [H+] and ~10-fold reduction in [CO3^2-].
As for your claim: “There is not enough CO2 able to be made from all the fossil fuel ever found underground and in the rocks to change the ocean pH by a magnitude of 1.0”
During the Permian mass extinction pH decreased by ~0.7 which is a 5-fold increase in [H+], corresponding to pCO2 of ~2000 ppm, a 5-fold increase over today’s value.
Sorry it appears that the link system no longer works.
Now it’s back to normal, thanks Anthony.
Interesting how there was a peak in atmospheric CO2 above 400 ppm in southeastern Sweden about 10,700 BC, even though the Antarctic ice cores don’t show much change. I don’t think we can blame prehistoric Vikings for burning too much whale oil back then.
This demonstrates the fallacy of using Antarctic ice cores to estimate the “global average” CO2 in the atmosphere. The CO2 in the Antarctic ice cores got there from snow falling on the Antarctic, which was probably dissolved in a water droplets somewhere south of the Antarctic Circle which froze into a snowflake and fell on the Antarctic. The ice core record might be a good proxy for CO2 levels south of the Antarctic Circle, but most CO2 exchanges between the atmosphere, ocean, and living organisms occurs in much lower latitudes (over a much larger area of the globe), and these changes are not reflected in the Antarctic ice cores.
Even southeastern Sweden is not exactly tropical, but it’s warm enough in spring and summer to grow birch trees. What if there was a proxy for prehistoric CO2 levels in tropical areas, where most of the CO2 exchange between the atmosphere, oceans, and living organisms occurs?
The Antarctic ice cores are very suitable for 100-500 year average CO2 values… A few have 50-100 resolutions. The DE08 core from Law Dome has 10-30 year resolution back to about 2,000 years BP.
The Antarctic ice cores aren’t wrong. It’s just that they can’t resolve century-scale CO2 shifts in the Early Holocene or Pleistocene.
The ocean contains 94% of all the available carbon, the atmosphere contains something along the lines of 2.5% and the plants contain the rest.
How exactly can adding that tiny little bit of carbon to the Ocean cause more than trivial changes?
News flash, all these sea animals that are claimed to be at risk all have blood that is far more acidic than the Oceans, and their shells do just fine. Your bones also do fine with the acidic blood as well.
Great post David.
You’ve uncovered another shocking it’s-worse-than-we-fort we-must-act-now alarminglyly damaging effect of CO2.
It’s called scientific blatherification.
Politically mandated revisionist research aimed at showing that everything that has ever happened is bad and that CO2 is to blame, destroys the researcher’s ability to distinguish cause from effect. It ultimately erodes that researcher’s understanding of the difference between – and even the meaning of – cause and effect.
This is scientific blatherification and is the most profound and real danger of CO2.
Thus when new and improved proxy data show past temperature changes to have been greater than previously known, then rather than come to the right conclusion:
Climate changes a lot all the time so recent changes might be natural
The blatherified come to the wrong conclusion:
O my! All that stuff happened and was bad and CO2 caused it
Likewise, when new science shows evidence of greater past variability of CO2 level in the atmosphere, they are equally unable that see the correct conclusion:
So the suspiciously smooth and linear recent increase of CO2 might not be all anthropogenic but much of it could be natural ocean outgassing due to long term ocean changes
No – the blathering ones jump instead to:
O look – that naughty CO2 was jumping around all over the place even way back then – just think of all the bad stuff it must have been causing!
CO2 blatherification is worse than we thought.
According to google ngram viewer, “ocean acidification” was never used in a book (that google books has read), encompassing 1800-1976. It may have been used once, in a book in 1977 (”Search for “ocean acidification” yielded only one result.” but I could not find the book) and was not used again until 1992; but it was used more frequently since 2002.
https://books.google.com/ngrams/graph?content=ocean+acidification&case_insensitive=on&year_start=1970&year_end=2008&corpus=15&smoothing=3&share=&direct_url=t4%3B%2Cocean%20acidification%3B%2Cc0%3B%2Cs0%3B%3Bocean%20acidification%3B%2Cc0%3B%3BOcean%20acidification%3B%2Cc0%3B%3BOcean%20Acidification%3B%2Cc0
A wider google books search found an erroneously dated document, that ”Federal Ocean Acidification Research” was used in a US Government document,
1944. “United States Code: Supplement III.” US Government but, scrolling up to the first page, it said, ”UNITED STATES CODE 2012 EDITION”https://books.google.ca/books?id=w6nb2KRkv-oC&pg=PR30&dq=%22ocean+acidification%22&hl=en&sa=X&ved=0ahUKEwj2vI3Jw8PbAhX1NX0KHa0ED-wQ6AEIJzAA#v=onepage&q=%22ocean%20acidification%22&f=false
Another false ‘hit’ –
”Expressing its concern over the projected adverse effects of anthropogenic and natural climate change and ocean acidification on the marine environment …” UN
1958Yearbook of the United Nations – Volume 60 – Page 1558 ”United Nations. Dept. of Public Information”but this same book contains this phrase, ”In 2005, Mexico and the United States …” on page 1444
https://books.google.ca/books?id=kK-L1hkvH2gC&q=%22Ocean+Acidification%22&dq=%22Ocean+Acidification%22&hl=en&sa=X&ved=0ahUKEwjWzcmmx8PbAhXnIjQIHapiBLgQ6AEILTAB
More searching of Google Scholar results for “ocean acidification” reveals many erroneously dated ‘hits’ – This one:
Human, C. O.
1915“Harvard-Smithsonian Physicist: Computer Models Used by UN.”seems to be
Hollingsworth, Barbara 2015 ”Harvard-Smithsonian Physicist: Computer Models Used by U.N. Overstate Global Warming” CNS News
which I found is probably related to
Monckton, Christopher, et al. 2015 “Why models run hot: results from an irreducibly simple climate model.” Science bulletin
There is a false hit, Chen, C. C.
1706“Evaluating the Economic Damage of Climate Change on Coral Reefs” Doctoral dissertation, Texas A&M University… this is probably
CHEN P. Y., CHEN C. C., CHU L. and MCCARL B., 2015 – “Evaluating the Economic Damage of Climate Change on Global Coral Reefs.” Global Environmental Change
There is another false hit, Singh, C. M. “Duarte, and J.-P. Gattuso
1884. “Impacts of ocean acidification on marine organisms: quantifying sensitivities and interaction with warming.” Global Change Biology… this is probably
Kroeker, Kordas, Crim, Hendriks, Ramajo, Singh, Duarte, Gattuso 2013 “Impacts of ocean acidification on marine organisms: quantifying sensitivities and interaction with warming.”
Pesce, Andrea S.
19122012 “The physiological response of non-calcifying benthic macroalgae to ocean acidification.” Diss. SciencesBěhrádek, J.
19302018 “Temperature coefficients in biology.” Biological Reviews cites literature in 2018, 2017, 2016Lesniewski, Megan E.
19142014 Comparative review … ocean acidification on biogeochemical … coral reef and …” Diss. Washington CollegeSteier, Gabriela
19172017. “No Ordinary Lawsuit-Juliana v. United States.” JURISTCai, Xiaowei, et al.
19102010 “Agriculture, Food & Env Sciences.” HorticultureHassler, J., P. Krusell, and A. A. Smith Jr.
19162016 “C0105 Environmental Macroeconomics.” Handbook of MacroeconomicsThorson, Gunnar 1950. “Reproductive and larval ecology of marine bottom invertebrates.” Biological reviews does not contain the phrase, “ocean acidification”
Act, Delhi Laws, et al. 1951 “Air.” Contains much more modern phrases, ”… Clean Air Act, Clean Water Act, Kyoto Protocol …”
Bullock, T. 1955. “Compensation for temperature in the metabolism and activity of poikilotherms.” Biological Reviews does not contain the word, “acidification”, let alone “ocean acidification”
Using Google Scholar, I find no scientific literature using the phrase, “ocean acidification” 1700-1954; I stopped there because of all the erroneous dates began to show a pattern of bad clerical work … anyone interested in further research to prove invalid, the various “hits” past 1954?
Great stuff! I’ve been rooting through papers on the Paleocene-Eocene Thermal Maximum (PETM), a period of actual “ocean acidification” (shoaling of the lysocline), and I’ve found several papers post-2003, that don’t mention “ocean acidification.” Although, it appears that since 2007-2009, it has become a common phrase in PETM papers.