[See the two updates at the end of the post]
This paper claims that ENSO is a following rather than a forcing of climate, but given what we’ve seen in the last two decades, it sure seems like ENSO El Nino events are in fact a forcing of the global climate, from which the Earth quickly recovers.

The paper: (paywalled)
Changes in ENSO Activity During the Last 6,000 Years Modulated by Background Climate State
Soon‐Il An, Seul‐Hee Im, Sang‐Yoon Jun
Abstract
Various proxy records show that El Niño–Southern Oscillation (ENSO) activity has changed from calm to active during the last 6,000 years. However, it is so far unclear whether orbital forcing has solely induced such a dramatic change. In this study, we performed a transient run for the last 6,000 years using an Earth system model of intermediate complexity affected by orbital forcing only without changes due to other climate forcing, and then its time‐varying background states were implemented into an intermediate atmosphere‐ocean coupled model for ENSO. ENSO activity simulated by the intermediate atmosphere‐ocean coupled model during the last 6,000 years resembled the observed proxy data, inferring that orbital forcing mainly leads to changes in ENSO activity during the last 6,000 years. From additional sensitivity experiments, we found that a change in sea surface temperature background conditions is primarily responsible for the observed ENSO activity over the last 6,000 years through modifying the anomalous horizontal thermal advection of the mean SST gradient.
https://agupubs.onlinelibrary.wiley.com/doi/pdf/10.1002/2017GL076250
UPDATE BY ANTHONY: Commenter “frankclimate” has provided a URL for the paper:
https://www.docdroid.net/QmS34GN/101002-at-2017gl076250.pdf
Reading it, it all makes sense now, thanks to that mighty big word “may”:

[Update by Willis Eschenbach]
I trust that Anthony won’t mind my noting that I’ve said for some time that the El Nino/La Nina pump is indeed a “following rather than a forcing of climate”, to use Anthony’s words. To be more precise, it is another temperature-regulating emergent phenomenon, one which occurs when the Pacific ocean temperature and surface heat content get above a certain level. At that point, the winds spring up and push millions of cubic metres of warm ocean water towards the poles, cooling the ocean. See my posts below for a fuller discussion.
Best to all, and thanks as always to Anthony for providing this marvelous forum for scientific discussion.
w.
The Tao of El Nino 2013-01-28
I was wandering through the graphics section of the TAO buoy data this evening. I noted that they have an outstanding animation of the most recent sixty months of tropical sea temperatures and surface heights. Go to their graphics page, click on “Animation”. Then click on “Animate”. When the new…
The Power Stroke 2014-02-27
I got to thinking about the well-known correlation of El Ninos and global temperature. I knew that the Pacific temperatures lead the global temperatures, and the tropics lead the Pacific, but I’d never looked at the actual physical…
resembled??
So a change in orbit made it warmer
6000 y ago was the Holocene optimum , warmer than today. It seems they are claiming more active ENSO in a cooler climate.
without seeing the detail of the paywalled paper, it’s difficult to comment more. However, this could also be seen as a feedback mechanism since ENSO is a THROUGHPUT of energy , not a source of energy or a “forcing”.
Increased ENSO means more solar energy into ocean ; more energy transferred to atmosphere: if this is related it could be a negative f/b compensating for the alleged loss of energy input due to orbital changes.
It could also be the usual meaningless trend fitting: one thing went up , another went down : climatologists arbitrarily infer causation.
I would want some pretty clear correlation between changes in both directions , not just working on average “trends” over the whole data set. The description “it resembles” leads me to expect the latter.
“without seeing the detail of the paywalled paper, it’s difficult to comment more. However, this could also be seen as a feedback mechanism since ENSO is a THROUGHPUT of energy , not a source of energy or a “forcing”.
I wish more people would get this.
Trump administration quietly cancels $10m NASA program that tracks key greenhouse gases as part of its ‘attack on climate science’
A $10million per year NASA program to track key global warming contributors carbon and methane has been canceled.
http://www.dailymail.co.uk/news/article-5721109/Trump-administration-quietly-cancels-10m-NASA-program-tracks-key-greenhouse-gases.html
Would it be inaccurate to describe ENSO as being a solar-driven climate-following weather-forcing?
Latitude: that was a duplicate of other activities. Getting the wrong answer twice was not helping anyone. Getting it wrong once will be sufficient for now.
It looks like there will be some rent-seekers looking for jobs elsewhere. Perhaps Soros can put them on his payroll.
Did it get cancelled or was the responsibility transferred/duplicated at NOAA?
“ENSO activity simulated by the intermediate atmosphere‐ocean coupled model during the last 6,000 years resembled the observed proxy data,”
Wow it “resembled” sounds unprecedented.
Relax, Greg. We all know there is speculation involved here and we must wait for confirmation of everything we read.
“resembled” means that we can’t justify putting a significance figure on it…
YES, this really chaps my ass. ‘Resembling’ reality appears to be the modern standard for judging the efficacy of general circulation models (GCM) these days. In one of Gavin Schmidt’s videos, he sheepishly ends his lecture with something like “this is what we have,” as if, since this is the best we can do given the climate’s amazing complexity, he thinks we’re boxed into a take it or leave it dilemma, and since we have nothing better, we’re forced to take it.
NO, Gavin, the answer is also allowed to be NONE OF THE ABOVE! If you draw a pretty picture, or even a credible picture, and your pretty picture appears sort of like the Earth’s climate, that does not represent a scientific statement of reality. So instead you finesse this crucial, fundamental aspect of science, and you bloviate about what you consider “skillful” knowing full well that from there, it’s a short hop for the sycophantic Progressive media to advance your pronouncements about climate model output to the status of infallible or canonical. And yet, you have never tested your hypotheses. You avoid testing it, and you reject that your toys can even be falsified. Then you dissemble about how you aren’t making predictions, only projections. What a weasel. As Dr. Christy said so eloquently before Congress, the way we think we understand something is by MAKING PREDICTIONS (emphasis added). Make a frickin’ prediction, you bureaucratic coward. Or find a new job. You’re certainly not cut out for science.
And Camille Parmisan, if you’re listening, you can’t marry these computer games to your silly biological studies and predict death and extinctions, WITHOUT demonstrating some actual extinctions and getting down to some root causes. I think you should get a new job, too. And Katherine Hayhoe, well, I won’t even get started. After all, she’s a Nobel prize winner, and by law, you’re not allowed to impugn a Nobel prize winner.
All the overheated pikas that died from heat stroke are rolling over in their tiny little pika graves.
Sorry, I got to ranting and I couldn’t stop.
“In this study, we performed a transient run for the last 6,000 years using an Earth system model ”
“then its time‐varying background states were implemented into an intermediate atmosphere‐ocean coupled model”
It’s models all the way down again.
I regard a year or two as weather and a decade or more as climate. Your mileage may vary.
As if models can predict weather even a few years out? So hindcasting on proxies for six thousand years somehow means anything?
The full: http://docdro.id/QmS34GN
thanks Frank
my pleasure!
Let me see if I understand this. Absolutely no one has a model which can accurately predict temperatures or conditions either backwards or forwards yet they continue to use models in their research and act like the results they get are actually valuable for understanding the climate. I taught for a few years and any student of mine would have had great difficulty receiving a passing grade with such an attitude.
Crowcane,
” Absolutely no one has a model which can accurately predict temperatures or conditions either backwards or forwards ”
How do you know none of the models have made accurate predictions? Have you ever looked into it? There are plenty of articles addressing the predictions. What you read depends on where you go.
I never understood why skeptics say the models have been all wrong.
I suppose it depends on what you call “accurate.” Models can’t predict all natural variation, like the ENSO. And their projections will never be precise, simply due to the chaotic nature of climate. One big volcano could belch our gases and aerosols and change things. We also don’t know the timeline for human emissions. The models do not make predictions for future reality, they project a state at a future date based on the model and input. This is one reason there is a range in the projections – the models are different. But besides the obvious increased warming, models have successfully projected things like increased intensity of precipitation events, and the evidence is mounting that drought is becoming more intense. There are some data suggesting an increase in the proportion of intense of hurricanes worldwide, but hurricanes are too irregular to get an easy signal in the noise.
Sea ice is melting faster than predicted, and sea level rise is at the upper end of predictions (I know, it’s not a blog skeptics trust):
A man reviled around here, Gavin Schmidt:
“…Models are not right or wrong; they’re always wrong. They’re always approximations. The question you have to ask is whether a model tells you more information than you would have had otherwise. If it does, it’s skillful….”
More of his ideas here: https://dotearth.blogs.nytimes.com/2014/05/22/gavin-schmidt-on-why-climate-models-are-wrong-and-valuable/
He’s more realistic about models than the media are. The first video is only 5 minutes, and well worth it.
Models are not just for making predictions (or projections), they can be used to understand better how climate works, what happened in the past, and present “oddities,” like the “hiatus.”
A few other links
The First Climate Model Turns 50, And Predicted Global Warming Almost Perfectly
https://www.forbes.com/sites/startswithabang/2017/03/15/the-first-climate-model-turns-50-and-predicted-global-warming-almost-perfectly/
https://journals.ametsoc.org/doi/pdf/10.1175/1520-0469%281967%29024%3C0241%3ATEOTAW%3E2.0.CO%3B2
………………….
https://www.technologyreview.com/s/543546/why-climate-models-arent-better/
https://m.imgur.com/BcodSWC
~graph courtesy of javier
Kristi:
“I never understood why skeptics say the models have been all wrong.”
I wonder if you are hearings things not said. I don’t say that. Granted, as a group, the models suck. There is a Russian one that has done a reasonable job of predicting the global temperature from 1995-present. The rest, not so much. Generally speaking, models that show an ECS above 1.5 degrees cannot get the predicted temperature within sigma one of the actual values, always on the high side of course with the prediction.
What other field of science accepts such a lengthy record of failure in the basics? Fusion? At least they have progress, heat and light. Climate models radiate darkness and ignorance. It is a rare and curious phenomenon.
Kristi:
“…Gavin Schmidt:
“…Models are not right or wrong; they’re always wrong. They’re always approximations.”
The models used to make alarming and catastrophic predictions of future runaway global warming caused by human emissions of CO2 (to quote Gavin himself) “are not even wrong.” They are eschatological fantasies that fail to properly consider basic negative feedbacks such as cloud cover in the tropics and the decline in the North-to-Equator Delta T driving hurricane strength.
If the models had value, they would tell us something we do not know, rather than something which is never going to happen.
I’l just take one of your statements at the time since it is time for me to crash. Sea ice has melted more than expected? Wasn’t it supposed to be gone by now?
We say they are wrong because they run hundreds of times and the vast majority are miles wrong. A few are just wrong.
Can you point us to a model that is consistentlyright?
“Can you point us to a model that is consistentlyright?”
I guess she can. In the myriad of random runs, one or the other ought to be right. Just like Paul the octopus was. Being consistently right is a necessary condition, but it is not enough.
You cite a 1967 paper, but didn’t mention the 1965 Presidential panel who predicted that by the year 2000 CO2 would go up 25% (quite accurate, actually), which would cause temperatures to rise by 7 degrees and sea levels to rise by 10 feet.
After the year 2000, the ensuing warming would cause the Antarctic ice cap to melt within 400 years and sea levels would rise by 1 foot per year over that span. They did acknowledge that if instead it took 1000 years to completely melt the Antarctic ice cap, sea levels would only rise 4 feet every 10 years.
Some much more recent predictions are equally laughable.
Kristi Silber May 13, 2018 at 1:49 pm Edit
Here’s your graphic:

It shows a linear change of about 3 cm per decade since 1990. Note that this figure is disputed because per the 1990 IPCC report, the tide gauges show about 1.5 cm per decade.
In addition, your graph shows that as the UPPER end of the IPCC predictions, showing (according to you) that the models were conservative.
I have no clue where you got that graph, but here is a quote from the 1990 IPCC report:
Now, in theory, that is accelerating over the period. However, to date, we haven’t seen such acceleration.
Remember your graph shows the high-end estimate is 6 cm by 2010. However, in 1990 the IPCC base figure for the sea level rise over the past century was 1.5 cm/decade (see link below). In any case, given their figures, the IPCC 1990 “Business As Usual” scenario gives values from 2.8 to 9.9 cm by 2010, with a “Best Estimate” of 5 cm by 2010.
In other words, all that they did was project the previous 1.5 cm/decade, double it for their low end range, and go up from there … all models are wrong, and some are useful. But the models used by the IPCC to predict the sea level rise were … well … useless.
So no, your graph does NOT show the projections made in 1990. It shows a range from about 1.7 to 6 cm, whereas in 1990 the projections were from 2.8 to 9.9 cm …
The data is here. Your willingness to grab something because it agrees with your preconceptions is called “confirmation bias”. I knew as soon as I looked at your graph that it was totally bogus … how?
Because I actually study this stuff, and I do my homework to verify my claims and beliefs … the sea level chapter from the 1990 IPCC First Assessment Report is here. Next time, do your homework so I don’t have to do it.
In this case, my homework was that I took the graph on page 277, and I got the high, low, and best estimate data for 1990, 2030, 2060, and 2100 for the BAU scenario. I put that into Excel and fitted a curve to it. After some experimentation, the curve turned out to be of the form
where “x” is the year.
Then I used that curve to calculate the values for 2010, which were totally different than those in your bogus graph … and if you are unwilling or unable to do that kind of investigation, let me suggest that you take the advice usually attributed to Mark Twain:
You are destroying your reputation with this kind of nonsense, Kristi. I’m just about up to where I simply skip your foolish claims without reading them.
Regards,
w.
her reputation as a science-illiterate unashamed troll is already well established.
she don’t care at all about what you can tell her
Willis — do you happen to recall roughly what A B and C were? If I’m not extraordinarily confused, A is probably the headline number for sea level rise (roughly 0.0015mm per yr for FAR?). B is an acceleration term. C is ???? (damned if I know). And D is irrelevant.
0.0015m not mm. Note to self. Should not post before morning coffee.
Willis,
I didn’t notice that the caption wasn’t attached to the graphic, since that doesn’t show up when one is typing. Here it is:
“Observed sea level rise since 1970 from tide gauge data (red) and satellite measurements (blue) compared to model projections for 1990-2010 from the IPCC Third Assessment Report (grey band). Sea level rises mainly as a result of melting land ice and thermal expansion of ocean water as temperatures rise. Observed sea level is tracking at the upper range of the IPCC projections. (Source: The Copenhagen Diagnosis, 2009)”
However, it’s true enough that I could have checked it against the data set, and the integrity thereof, if I had known what dataset it is based on, which I don’t. So, Willis you are right, I shouldn’t have used the graph. Poor judgement. Your analysis obviously shows the correct, scientific way to address these issues. Put some data in Excel and “experiment” until you have an answer.
Willis, I will leave you alone so you have no reason to condescend to talk to me.
Kristi Silber May 15, 2018 at 2:08 am
You missed the point. The Third Assesment Report was in 2001 … so starting in 1990 is hardly a “prediction”. So I went to the original First Assessment Report, got their data, and analyzed that so I wouldn’t be calling it a “forecast”.
The problem was that if you are looking at “predictions”, starting ten years before the date of the “prediction” is a joke.
Oh, piss off with your snide remarks. I didn’t get “some data”. I got the ORIGINAL 1990 IPCC PREDICTION of sea level rise. Since the prediction was only defined for the years 1990, 2030, 2060, and 2100, I had to fit a curve to those points so I could see exactly what the 2000 and 2010 values were. Then I reported back here exactly what I had done, and the exact nature of the fitted curve, so others could check my work.
And yes, that IS the way to get the right answer. You could have done it yourself … if you only knew enough.
I say again, you are making claims about things that you seem singularly uninformed about. You should read and listen more, and opine less. Otherwise, you end up posting things like this “prediction” about a sea level rise that happened ten years before the date the “prediction” was made … yes, they got the year 2000 value spot on because they wrote the prediction in the year 2000, and you’re all wide-eyed and impressed.
Look, I appreciate your enthusiasm—it’s a necessary and good thing in a scientist. So don’t let me discourage you from learning and exploring. I’m just saying, you might profitably be less certain and definitive in your claims until you’ve actually done all of the necessary homework …
Regards,
w.
In 6000 years the Pacific will have moved/expanded/altered? by some 120 metres. Pure guess on my part. Also the Indonesian section of the ring of fire will have been very active, as it is today. Anything in the models here? After all sea water does get heated by volcanic processes does it not?
That’s far more than the flap of a butterfly’s wings.
“In 6000 years … ” the Australasian plate will have pushed a further 420 metres north by east, squeezing that narrow gap a tad more.
I’d have thought ocean currents drive ENSO.
Please read Bob Tisdale’s free book
https://wattsupwiththat.com/2015/11/03/new-book-by-bob-tisdale-on-global-warming-and-the-illusion-of-control-part-1/ .
The atmospheric pressure differences and subsequent wind direction and speed over the equatorial Pacific (southern oscillation index) is what piles warm water up and then lets it slosh back to slow upwelling cold water.
Silly language. About a foot of height across 3000km of water, not much a “slosh”.
North-south flow also needs to be considered, this is not a 1D or even a 2D effect. Look at the progression of temp. anomalies in equatorial section and heat just disappears without ever reaching the surface. There much be significant flow in and out of the sampled cross-section. section.
Nino/Nina is a slow 3D tide on the density difference between the warm mixed layer and colder waters of the thermocline. IMO
The air/water density diff responds most strongly to the 12h semi-diurnal tidal forcing. The density difference at the top of the thermocline is about 1000 times less and will respond about 1000 times slower. That is inter-annual timescales.
If you look at the progression of the rise and fall of the temperature anomalies at depth, it is just like an ocean wide tidal movement. It is the rising of the lower waters which drives the “sloshing”. The trade winds act as a positive feedback at the surface. They do not explain the cause: they are not the trigger, just the reaction.
Agree with Greg at 12:50 pm [no “Reply” available that I can see] regarding the “foot of height across 3000km ‘slosh.'”
I could easily be wrong, but the idea that this “slosh” could be physically meaningful given the above “back of an envelope calculation”–not to mention whatever else might be affecting the temperature, let alone the physical integrity of a parcel of water over time–never made sense to me. Furthermore, with only half a foot change there would be no potential difference. And, unfortunately, this seemed like such an obvious flaw, that it seriously detracted from the rest of the otherwise understandable argument.
Greg May 13, 2018 at 12:50 pm
robert_g May 13, 2018 at 2:18 pm
“Slosh” may not be the best description, but yes, we do have waves that are on the order of “About a foot of height across 3000km of water”.
SOURCE
A two-inch wave that crosses the ocean … who knew? Well, I did, but I guess Greg didn’t …
w.
[youtube https://www.youtube.com/watch?v=s4bvEnIMqAE&w=1280&h=720%5D
After much looking I found the video I remembered seeing a few years ago. Here’s the clearest view of the waves that are associated with El Nino. You need to enable Flash … the waves start in January 1997, and sure look like “sloshing”. They take about a month to cross the pacific … video here.
w.
Willis,
Thank you so much for your kindness in taking the time to so quickly search out the several references you cited in response to my perplexity about the “sloshing.” The videos and the text were quite informative and gave me food for thought.
Although the subtleties of fluid mechanics is well beyond my level of competence, I suspected that the amplitude of thermocline waves was significantly larger than those on the surface. I particularly enjoyed the video demonstration of the “blue, cold” water invading the warmer “red” water from below.
However, the demo did seem a bit inapposite in that I am not sure that there is the equivalent of a diaphragm/barrier separating, capturing, and preventing the cold eastern Pacific ocean “hypolimnion” (i can’t find the equivalent ocean term for the limnological analog) from flowing east while the Trade Winds are “piling up” the warm “epilimnion” in the west. If I understood the demo correctly, it is the sudden release of the cold fluid that generates the waves.
In any event, I am sure there is some good geophysics behind all of this.
BTW, as a sailor and lover of nature, I presume you have seen Kelvin-Helmholz clouds. If not, they are well worth looking for. These are beautiful and the waves in these clouds move quite rapidly.
The “sloshing” that occurs in conjunction with El Ninos goes from west to east in the tropical Pacific. It is neither a long-period gravity wave (Kelvin), nor a planetary inertial wave (Rossby) that propagates westward, but simply a gradual flow, without orbital motion. It’s pathetic how explanations steeped in fundamental ignorance of physical dynamics propagate in the blogosphere.
Sounds sensible, as during glacial periods there are near permanent El Nino conditions.
Obviously, they have to justify the grant money they requested and received. They must be so happy.
And … they can virtue signal and be the daahlings of their sect …
So if l have got this right, what there are saying is that climate change has been largely due to orbit changes and weather. So l have been right to spend my time looking at the weather for clues about climate change.
Well who would have thought it. 😉
They have got to keep writing or they won’t get grants.
Doesn’t matter if it’s science fiction.
“…we found that a change in sea surface temperature background conditions is primarily responsible for the observed ENSO activity over the last 6,000 years through modifying the anomalous horizontal thermal advection of the mean SST gradient.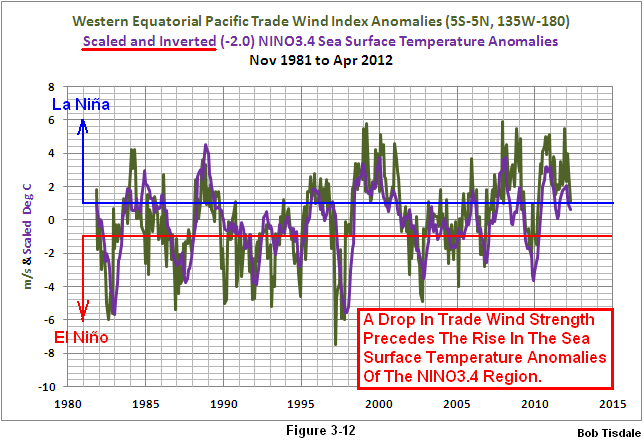
Translation:
anomalous horizontal thermal advection is shifts in the trade winds across the equatorial Pacific.
As Bob Tisdale clearly explained in his 2013 post on ENSO basics
https://bobtisdale.wordpress.com/2013/10/22/enso-basics-westerly-wind-bursts-initiate-an-el-nino/
A drop in trade wind strength (diminishing easterlies, and westerly wind pulses) precedes the ENSO region 3.4 SST rise signaling the onset of an El Nono.
Furthermore, the multi-decadal Pacific Ocean trade wind patterns are a key part of the PDO, that is, the PDO state alters the intensity of the prevailing Pacific trade winds. The effects of the Trade Winds surface stress are clearly documented in the Western Pacific Sea Level (WPSL).
http://i65.tinypic.com/kex8a8.png
Stronger Trade Wind easterlies are associated with higher WPSL and a La Nina results. Relaxation of this wind stress allows the West Pacific warm pool to flow eastward into the ENSO 3 region setting-off the global effects of an El Nino heat release.
(figure from: GEOPHYSICAL RESEARCH LETTERS, VOL. 39, L13602, doi:10.1029/2012GL052032, 2012, Multidecadal sea level anomalies and trends in the western tropical Pacific. by M.A. Merrifield, et al.)
And the correlation of PDO state and ENSO intensity is established.
http://i67.tinypic.com/11cb37r.png
As for the tail wagging the dog problem. That implies causality arrow runs in one direction. I see it as much of a chicken and egg problem. All these processes are tightly coupled, thus the arrow of causality runs in both directions.
Thanks, Tisdale’s graph sure look like the two “resemble” each other. But I don’t see an obvious phase lag in either direction. How does this show “preceded”?
Joel, excellent comment (two thumbs up from the fonz)…
In fact much of what we assume are causes and affects are in fact symptoms of other processes as yet not even measured.
http://www.drroyspencer.com/2016/01/what-causes-el-nino-warmth/
The cessation of easterly walker cell trade winds during an el nino event results in a lessening of ocean vertical mixing. Surface waters remain warm and waters below the surface remain relatively cool. The opposite happens with a la nina event. Strong vertical mixing due to trades results in cooler surface waters with relatively warm waters below the surface. (according to spencer, this is the dominant mechanism for the cause of el nino warmth)…
Last para is spot on. In a complex system like this there is no beginning and no end. It just “does”. The models are almost worthless because it is nigh on impossible to know initial conditions to start from because of both the complexity and the fact the system never stops changing.
We can land a man on the moon because we know initial conditions. If we didn’t we couldn’t.
The best description I have seen here for El Nino is “burps” of heat from the ocean, that results in some very temporary and rather insignificant cooling (Pamela?).
Look around – there is a pattern in the way nature works. Regulating mechanisms always overshoot there extremes before compensating. So does society
Regards
M
Michael,
I would suggest you follow the link to Bob Tisdale’s post of the subject and read about westerly wind bursts (and links therein).
I’ve said for some time that the El Nino/La Nina pump is indeed a “following rather than a forcing” of climate. To be more precise, it is another emergent phenomenon which emerges when the Pacific ocean temperature and surface heat content get above a certain level. At that point, the winds spring up and push millions of cubic metres of warm ocean water towards the poles. See my posts below for a fuller discussion.
w.
The Tao of El Nino 2013-01-28
I was wandering through the graphics section of the TAO buoy data this evening. I noted that they have an outstanding animation of the most recent sixty months of tropical sea temperatures and surface heights. Go to their graphics page, click on “Animation”. Then click on “Animate”. When the new…
The Power Stroke 2014-02-27
I got to thinking about the well-known correlation of El Ninos and global temperature. I knew that the Pacific temperatures lead the global temperatures, and the tropics lead the Pacific, but I’d never looked at the actual physical
I’ve added this to the head post, as it is an important issue.
w.
“I’ve said for some time that the El Nino/La Nina pump is indeed a “following rather than a forcing” of climate.”
Yes, that is the IPCC view too. Here (TAR 1.2.2) they set it out:
“But even without changes in external forcing, the climate may vary naturally, because, in a system of components with very different response times and non-linear interactions, the components are never in equilibrium and are constantly varying. An example of such internal climate variation is the El Niño-Southern Oscillation (ENSO), resulting from the interaction between atmosphere and ocean in the tropical Pacific.”
The abstract conclusion is based on Figure 3b. Except that figures ‘resemblance’ is so poor it refutes the abstract. How to convert a fail into a paper: don’t use statistical analysis, just eyeball it and make a questionable assertion.
My only complaint is that an easterly wind blows west and that a westerly wind blows east. This is the only case in the English language where turning an adjective into an adverb by adding ly also tuns it around to mean the opposite of the word itself.
Is a McDonald’s hamburger coming from McDonald’s or going to McDonald’s?
Quoting Willis’ exact words:
Best to all, and thanks as always to Anthony for providing this marvelous forum for scientific discussion.
Yes. I agree. 🙂
I’m always dubious of a study that relies on a series of proxies to paint a picture, and then running computer models to mimic the proxies. I would like to know when computer modeling can clearly and accurately mimic the entirety of a given proxy, instead of something cobbled together between a number of them, where the conclusion being reached is less than obvious. Why is it that proxies are variably reliable for only portions of the paleoclimate record rather than all of it?
This is yet another example of the problem with the invented terminology of climate science adding to the confusion.
In science we have cause and effect. In pseudo science we have the invented terms forcing and following and confusion over meaning leads to misunderstanding and dispute.
Even the mist fundamental of terms; “climate change” does not have an agreed scientific definition.
This is not science. It is non science.
Bingo!
Much ado about natural variability, that was politically mis-described as something else.
If you don’t understand the terminology, that makes the science not science?
A simple question. What is a forcing? Is it a force, or is it energy? Or is it a change in force? Or is it a change in energy?
An what are the units? Are changes instantaneous or are they over a change in time? Are we dealing with first derivatives or simple differences.
I ask because it seems to me the problems with invented terminology are not because climatology is talking about something where terminology did not already exists.
Rather it appears to me that the problems such as what MB recently presented over water feedback are a direct result of invented terminology causing confusion which leads to fundamental hidden errors.
My understanding is that the forcing is the net energy between that received and that reflected. But I agree with you about “invented terminology”. Net energy works fine. Like the education business, validating one’s profession is required in unprofessional areas. Language helps to validate in some people’s minds.
a forcing is an external action, which, depending on the formalism you use, will translate into force, power, energy, movement, mass, or whatever, measured in relevant unit.
http://www.thesaurus.com/browse/forcing
Now, I agree with you.
IPCC is not even able to properly define “climate” or “greenhouse effect”, and claims to study changes in these… errors are not hidden, they are actively concealed. Confusion is not a bug, it is a feature.
The AR4 had two definitions in the Glossary.:
“External forcing
External forcing refers to a forcing agent outside the climate system causing a change in the climate system. Volcanic eruptions, solar variations and anthropogenic changes in the composition of the atmosphere and land use change are external forcings.”
and, more extensively
“Radiative forcing
Radiative forcing is the change in the net, downward minus upward, irradiance (expressed in W m⁻²) at the tropopause due to a change in an external driver of climate change, such as, for example, a change in the concentration of carbon dioxide or the output of the Sun. Radiative forcing is computed with all tropospheric properties held fixed at their unperturbed values, and after allowing for stratospheric temperatures, if perturbed, to readjust to radiative-dynamical equilibrium. Radiative forcing is called instantaneous if no change in stratospheric temperature is accounted for. For the purposes of this report, radiative forcing is further defined as the change relative to the year 1750 and, unless otherwise noted, refers to a global and annual average value. Radiative forcing is not to be confused with cloud radiative forcing, a similar terminology for describing an unrelated measure of the impact of clouds on the irradiance at the top of the atmosphere.”
So radiative forcing is a quantity with units. External forcing is just a descriptor of what is regarded as external.
Thanks for Glossary link, Nick. I was too lazy to search for it myself, but it is a good source material for many discussions here on the forum.
I do have problems with the “greenhouse” definitions, but whathehell.
Gums….
6000 years ago the obliquity was near maximum, 24.5, and NH summer solstice was much closer to perihelion.
So what are the S.I. units of “ENSO”?
And if a different arbitrary definition of ENSO is used, how much difference can it make?
When one talks about following and forcing, one seems to be making an assumption. That assumption is that, if one phenomenon precedes another, it must be the cause of the other. In fact, it is entirely likely that both phenomena have the same cause which hasn’t been identified.
Always possible, never mentioned! Particularly in a very complex system your comment is most appropriate.
And the previous ENSO caused the conditions which eventually led to the next ENSO – that must be true, since an ENSO preceded an ENSO.
Everything before causes everything after.
Part of the problem here is conflating forcing with changes to the system. ENSO is a change to the system as a natural and quasi-periodic fluctuation in the distribution of surface energy around its mean. It neither forces or is forced, but bounces around on its own, although it’s state does affect the short term ‘average’ surface temperature.
The only forcing comes from the Sun. When the attributes of forcing are applied to a change in the system, for example, the redistribution of surface energy, volcanic effects, variable GHG concentrations, even albedo forcing, what they really mean is that a particular change to the system is EQUIVALENT to a change in net solar forcing (incident – reflection) while keeping the system constant.
Conflating actual forcing with equivalent forcing without a proper explanation seems to be a layer of obfuscation added by the IPCC in order to avoid comparisons to how the Earth responds to seasonally variable solar forcing which is readily quantifiable from satellite data and supports short time constants and a low ECS.
OK – I’ve read the Abstract of the paper (why don’t people write in understandable English anymore?) and Willis’s two addenda. Seems to me it makes sense, at least Willis’s part, so here are my questions:
1. What drives the ~~60-ish year PDO cycle from positive to negative mode and back again? How does it work?
2. What drives multi-century-long warming and cooling trends, if not the integral of solar activity?
I await informed speculation with bated breath (actually it’s the fish I had for lunch).
Regards, Allan
Allen, here’s my post on the subject laying out my very incomplete understanding of the PDO … also, only one of the addenda are mine, the latter one.
w.
To me its always seem like ENSO was over rated in its important to climate. l pay little heed to it myself.
The reason why is because for me it has always made more sense to look for the answer to climate change through weather rather then anything else.
Because while we now view the LGM as climate, had we been living through it at the time then it would have simply been viewed as weather. So that been the case its always seem like the best question to ask is “what would the weather need to be doing to allow that to happen”.
Well thanks to this years weather l feel am now alot closer to the answering that question. lts what’s going on in and around the Arctic and how this is linked with the jet stream. ls a key to understanding how the weather moves the climate. Changes in the Earth’s orbit may provide the background to climate change, but its the weather that provides the detail.
The mantra of Climate Change is that CO2 causes warming by delaying the return of energy to space. Interestingly, the “build up” phase of the ENSO oscillation actually does exactly that, in much greater heat quantity than CO2 even pretends to, and that heat eventually finds its way to space just as any heat retained by CO2 does.. I would suggest that any heat retention by CO2 actually escapes on a daily (or rather, nightly) basis. Also, if the build up of Pacific heat is lost over a period of months following the outbreak of El NIno, then it suggests that heat transfer to deeper ocean levels is not a given consequence of increased insolation over shorter time frames.
The glacial period ended 9000 years ago. The oceans are still pretty cold. Vast amounts of heat move around down there very slowly and warm even more slowly. It takes a great deal of surface heating and a long, long time to move the needle on the enthalpy content of this system as the interactions between atmosphere and deep ocean are strongly limited by evaporation at the boundary layer. What we are experiencing in the recent past weather-wise is just a minor perturbation of atmospheric temperatures with no long term significance for mankind or the planet.
I suggest sending Michael Mann to the bottom of the ocean ( any ocean) with his tree ring math algorithm.
It is neither forcing nor following, these terms being commensurate with some human activity, and the closest we can get to description of observations from our own point of view. Nature has no language, we humans satisfy ourselves with our own clumsy terms. Numerically speaking, the Sun and Moon work together for climate, such that Sun is the engine and Moon holds the steering wheel, with other more distant extraterrestrial forces present but less relevant in contribution.
Essentially solar and lunar forces combine such that ~60 years gives us ~13 El Ninos, but even that constitutes a half-cycle that must be doubled to form the Solar Cycle. As the full SC is beyond a human lifetime it is of less predictive interest.
The 13, though, is interesting, being the “Moon’s number” in antiquity from the ancient world of the forbidden occult, outlawed by The Church which wished to distance people from the moon, lest they uncover some predictive (declination) quality to the seasons. El Nino, ENSO, the Humboldt current, etc, have been modern ways to essentially avoid investigation of the lunar component. Are we still held back by religious belief, which in modern form is Environmentalism?
Please allow for broad generalizations/simplifications made in the following argument.
I believe that the El Nino and La Nina phenomenon act as “forcing” agents upon the climate system in the sense that they regulate the rate of throughput of energy through the climate system via an initial heat-gain in the equatorial regions and an eventual heat-loss in the mid-latitudes.
THE ENSO SYSTEM [skip if you are familiar with the details of the mechanism]
If I am interpreting the work of Bob Tisdale correctly, the default ENSO condition is the neutral state i.e. neither a La Nina nor an El Nino event. In the neutral ENSO state, there is an active Walker-Circulation across the equatorial Pacific Ocean that maintains strong trade winds that blow from the east to west. These easterly winds support a pool of warm water in the western equatorial Pacific ocean and the Indonesian Archipelago. The system is feed by an upwelling of cold deep-ocean water from the Humbolt current along the western coast of South America. When the equatorial Pacific Ocean is in this state, the Nino 3.4 region (i.e. eastern equatorial Pacific) is generally free of cloud because of the strong high-pressure system associated with the Walker-circulation. This allows the climate system to accumulate considerable amounts of solar energy through the warming of the surface layers of the ocean. This warm water is driven in a westerly direction across the Pacific ocean to add to the Indonesian warm-pool.
The La Nino state develops when the Walker Circulation strengthens, producing a stronger high-pressure system off the coast of Peru and a stronger low-pressure system in the western equatorial Pacific. The resulting increase in pressure differential across the equatorial Pacific leads to a strengthening of the easterly trade wind strength. Hence, a La Nina event could be considered as an example of the ENSO neutral state on steroids. This leads to a further reinforcement of the recharge of warm water from the eastern to the western equatorial Pacific Oceans.
In contrast, the El Nino state develops when the Walker Circulation collapses, resulting in a weakening of the trade-winds blowing from the east. This removes the support holding the elevated pool of warm water in the western equatorial Pacific ocean, resulting in a sub-surface plume of warmer-than-normal water tunneling its way across the Pacific. This plume of warm water emerges in the eastern equatorial Pacific heralding the onset of an El Nino event. It is generally agreed that the subsequent El Nino event eventually re-distributes this warmer than normal water towards the mid-latitudes where heat is lost from the climate system by being re-radiated out into space.
MISTAKEN ASSUMPTIONS ABOUT THE ONSET OF EL NINO and LA NINA EVENTS
I believe that we have been mistakenly assuming that the onset of El Nino events and La Nina events are
directly related to one another.
Historically, there are many cases where moderate to strong El Nino events have not immediately (~ 1-2 years) been followed by La Nina events e.g. the 1982/83 and 1991/92 El Ninos.
This raises the hypothesis: “What if the onset of these two type of ENSO states were each driven by a different underlying mechanism.”
I contend that El Nino events are in fact triggered by lunar tidally-induced gravity waves that travel along the Earth’s Equator from East Africa out into the equatorial western Pacific Ocean. These traveling atmospheric gravity waves manifest themselves in the Earth’s atmosphere and oceans as Madden-Julian Oscillations. Roundabout every 4.5 years these Madden-Julian Oscillations start aggressively penetrating into the equatorial western Pacific Ocean setting off westerly wind bursts (WWB’s). It is these WWB’s that disrupt the Pacific trade winds that blow from the Walker circulation wind-pattern that is responsible for keeping holding back the western Warm Pool. Once the Walker Circulation collapses the warm water near Indonesia /Philipines sloshes across to the eastern equatorial Pacific ocean off Peru setting off an El Nino event.
http://astroclimateconnection.blogspot.com.au/2018/05/a-re-post-of-el-ninos-during-new-moon.html
In contrast, La Nina events occur whenever the Walker Circulation pattern is stronger than normal. The data shows that there is an 11-year cycle in the long-term strength of La Nina events that must be related to the 11-year solar sunspot cycle.
Hence, I would contend that while the energy transfers through the climate system require that the El Nino and La Nina phenomenon work together, the occurrence of an El Nino event does not necessarily lead to the onset of a following La Nina event.
Thus, It is probably more accurate to say that the 11-year cycle in the long-term strength of La Nina events is being effectively disrupted/moderated by the occurrence of El Nino events, roughly once every 4.5 years.
Hi Ian, you wrote above:
“Historically, there are many cases where moderate to strong El Nino events have not immediately (~ 1-2 years) been followed by La Nina events e.g. the 1982/83 and 1991/92 El Ninos.”
Not sure if this helps, but the atmospheric temperatures in both 1982+ and 1991+ were tempered (reduced) by century-scale volcanoes El Chichon and Mt. Pinatubo.
https://www.facebook.com/photo.php?fbid=1618235531587336&set=a.1012901982120697.1073741826.100002027142240&type=3&theater
The blue line in the plot (UAH LT global atmospheric temperature calculated wwithout Sato) is a direct function of NINO34 Sea Surface Temperature (SST).
The yellow line (UAH LT global atmospheric temperature calculated with Sato) is a direct function of NINO34 SST and the Sato volcanic air opacity index.
The red Line is the actual UAH LT global atmospheric temperature.
Regards, Allan
Absolutely meaningless.
The Paper I mean…not any of the comments!
A year ago, April 2017, I wrote about this at:
https://judithcurry.com/2017/04/30/nature-unbound-iii-holocene-climate-variability-part-a/
“ENSO activity was essentially absent during most of the HCO and first becomes statistically significant around 7,000 yr BP, increasing considerably after 5,600 yr BP, and displaying many very strong peaks of activity during the Neoglacial period.
From a thermodynamic point of view high ENSO activity transfers great amounts of heat from the ocean sub-surface to the atmosphere, and afterwards a great part of that heat is radiated to space. This constitutes a cooling event from a whole Earth climate system perspective, even if it appears as warming from a lower atmosphere perspective. It is proposed that high ENSO activity is made possible by a high equator-to-pole temperature gradient. During the HCO [Holocene Climatic Optimum] the temperature gradient was kept low by high polar insolation due to high obliquity. After 7,000 yr BP the decrease in polar insolation and the increase in tropical insolation favored a progressive increase in the gradient, especially during prolonged periods without significant cooling, i.e. immediately preceding a Bond event. The profound cooling from a Bond event would eliminate or greatly reduce ENSO activity by quenching the thermal energy required for an El Niño event. If correct, high ENSO activity would be a sign of a cooling planet.”
Most people don’t understand ENSO properly. El Niño is a short-circuit in the ocean driven latitudinal transport of energy in the tropics. This transport is driven by the Equator-to-Pole temperature gradient. As the gradient increases, the need to transport heat increases, the transport system can’t cope and an El Niño ensues. Part of the excess heat is directed to the atmosphere taking a more direct route out of the planet.
With global warming, the gradient has decreased, and so the frequency of El Niño events decreases.
El Niño is exactly the opposite most people think. It cools the planet, and it is a sign of a cooling planet. It just temporary warms the atmosphere as the heat passes through it.
What I mean is that the article is not controversial to established knowledge. Scientists already knew all this. All models are wrong, but some are useful. The paper indicates progress towards understanding the causes behind El Niño, since what the evidence showed, can to some extent be modeled. The model supports attribution to changes in insolation during the Holocene. The Sun is by far the main cause of climate change, as anybody could imagine. Over centennial to millennial scales ENSO changes are not climate neutral. They are driven by climate change as a result of changes in solar insolation from orbital changes and from solar activity changes.
Javier,
I wholeheartedly concur with your posted comments, particularly the remarks about how El Nino events are a (short-circuit) cooling mechanism for the planet.
However, I am a bit wary of the proxy that you have used to indicate the frequency of ENSO events.
If you look carefully at your graph, you have two major cooling events [among the four strongest] centered at 450 A.D. and 1200 A.D. The first is at the transition between the end of the Roman Empire and the Dark-Ages and the second is right at the peak of the Medieval Warm Period.
I can understand that at the peak of the Medieval Warm Period (circa. 1200 A.D.) the polar-equator temperature gradient was likely to be large and hence the rate of El Nino events should have been high.
However, I do not think that the world was particularly warm around 450 A.D.
It is important to validate a proxy if it is to be believed. Is there any evidence that the proxy that is used here for El Nino frequency has been validated using modern data?
Javier,
Sorry, I got it the wrong way around. one paragraph should have read
I can’t understand that at the peak of the Medieval Warm Period (circa. 1200 A.D.) the polar-equator temperature gradient was likely to be small and hence the rate of El Nino events should have been low.
However, I do not think that the world was particularly warm around 450 A.D. and so you might expect a higher polar-to-equatorial temperature gradient and hence a higher number of El Nino events.
Soon-Il An has been publishing papers on chaotic dynamics of ENSO against a background of alternating “ground states” in the Pacific, for decades.
There might in fact be some sort of connection between ENSO and ice ages:
the studies by Stott and Koutavas suggest that shifts between warm and cool global average temperatures look, from the perspective of the tropical Pacific, like super El Niños. So too do the swings from shorter-term warming and cooling spells, called interstadials and stadials, that punctuated the last ice age.
It’s not clear, say Stott and colleagues, whether these changes imply that the climate was persistently in an El Niño-like phase during ice ages, or whether such phases came and went every few years, as they do at present, but more frequently and more intensely.
http://www.nature.com/news/2002/020712/full/news020708-19.html
Evidence of droughts and unusually wet weather, chemically etched into ancient reefs, show changes every three to seven years [124kya, during the previous interglacial], a pattern that Schrag finds “remarkably similar” to those of El Niños from 1856 to 1976. After that, a sudden change occurred. Since 1976, the pattern looks completely different, with El Niño events appearing faster and stronger.
https://news.harvard.edu/gazette/story/1999/08/el-nino-found-to-be-124000-years-old/
The authors* [Meyerson, Mayewski, et al. (Annals of Glaciology 35: 430-436.] found that a shift toward cooler conditions during the Little Ice Age was concurrent with an increase in the frequency of El Niño events. This is contrary to what is generally predicted by climate models, where cooling leads to less El Niño activity and warming leads to more.
The findings were harmonious with El Niño history in both South America and the Nile region, which depict “increased El Niño activity during the period of the Little Ice Age and decreased El Niño activity during the Medieval Warm Period.
https://www.iceagenow.info/el-nino-activity-correlates-with-ice-ages/
In this study we isolate a part of the climate system, the tropical Pacific, and test its sensitivity to changes in solar forcing associated with changes in the Earth’s orbital parameters. We use a simplified coupled ocean-atmosphere model that is run for the past 150,000 years and forced with Milankovitch changes in the solar insolation. This system responds primarily to the precessional cycle in solar forcing and is capable of generating a mean response to the changes in the seasonal distribution of solar radiation even while the annual mean insolation is roughly constant. The mean response to the precessional forcing is due to an interaction between an altered seasonal cycle and the El Nifio/Southern Oscillation (ENSO). Changes in the ENSO behavior result in a mean tropical climate change. The hypothesis is advanced that such a change in the tropical climate can generate a globally synchronous climate response to Milankovitch forcing.
http://muenchow.cms.udel.edu/html/classes/seminar/abstracts/ElNinoOrbital_Zach.pdf