From AGU and the “one mountain is not the planet” department. I wonder if they considered natural ocean cycles as a driver here? I wonder if they considered soot deposition on snow. Probably not. They go straight to the industrial revolution. What’s ironic is that without the industrial revolution and fossil fuels, they wouldn’t be able to fly there in helicopters (see video below) to measure and complain about it.
WASHINGTON D.C. — Glaciers in Alaska’s Denali National Park are melting faster than at any time in the past four centuries because of rising summer temperatures, a new study finds.
New ice cores taken from the summit of Mt. Hunter in Denali National Park show summers there are least 1.2-2 degrees Celsius (2.2-3.6 degrees Fahrenheit) warmer than summers were during the 18th, 19th, and early 20th centuries. The warming at Mt. Hunter is about double the amount of warming that has occurred during the summer at areas at sea level in Alaska over the same time period, according to the new research.
Scientists spent a month in Denali National Park in 2013 drilling ice cores from the summit plateau of Mt. Hunter. The ice cores showed the glaciers on Mt. Hunter are melting more now than at any time in the past 400 years. Credit: Dominic Winski.
The warmer temperatures are melting 60 times more snow from Mt. Hunter today than the amount of snow that melted during the summer before the start of the industrial period 150 years ago, according to the study. More snow now melts on Mt. Hunter than at any time in the past 400 years, said Dominic Winski, a glaciologist at Dartmouth College in Hanover, New Hampshire and lead author of the new study published in the Journal of Geophysical Research: Atmospheres, a journal of the American Geophysical Union.
The new study’s results show the Alaska Range has been warming rapidly for at least a century. The Alaska Range is an arc of mountains in southern Alaska home to Denali, North America’s highest peak.
The warming correlates with hotter temperatures in the tropical Pacific Ocean, according to the study’s authors. Previous research has shown the tropical Pacific has warmed over the past century due to increased greenhouse gas emissions.
The study’s authors conclude warming of the tropical Pacific Ocean has contributed to the unprecedented melting of Mt. Hunter’s glaciers by altering how air moves from the tropics to the poles. They suspect melting of mountain glaciers may accelerate faster than melting of sea level glaciers as the Arctic continues to warm.
Understanding how mountain glaciers are responding to climate change is important because they provide fresh water to many heavily-populated areas of the globe and can contribute to sea level rise, Winski said.
“The natural climate system has changed since the onset of the anthropogenic era,” he said. “In the North Pacific, this means temperature and precipitation patterns are different today than they were during the preindustrial period.”
Assembling a long-term temperature record
Winski and 11 other researchers from Dartmouth College, the University of Maine and the University of New Hampshire drilled ice cores from Mt. Hunter in June 2013. They wanted to better understand how the climate of the Alaska Range has changed over the past several hundred years, because few weather station records of past climate in mountainous areas go back further than 1950.
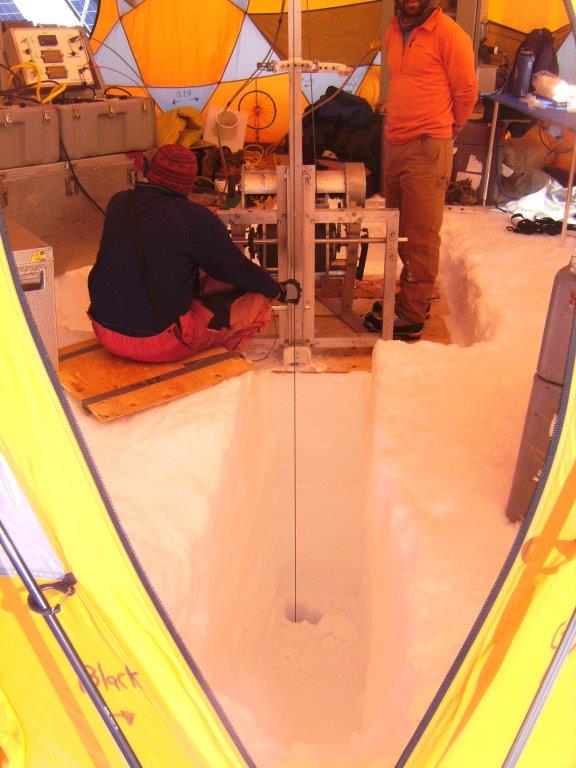
Researchers drill an ice core at their camp on the summit plateau of Mt. Hunter.
Credit: Dominic Winski.
The research team drilled two ice cores from a glacier on Mt. Hunter’s summit plateau, 13,000 feet above sea level. The ice cores captured climate conditions on the mountain going back to the mid-17th century.
The physical properties of the ice showed the researchers what the mountain’s past climate was like. Bands of darker ice with no bubbles indicated times when snow on the glacier had melted in past summers before re-freezing.
Winski and his team counted all the dark bands – the melt layers – from each ice core and used each melt layer’s position in the core to determine when each melt event occurred. The more melt events they observed in a given year, the warmer the summer.
They found melt events occur 57 times more frequently today than they did 150 years ago. In fact, they counted only four years with melt events prior to 1850. They also found the total amount of annual meltwater in the cores has increased 60-fold over the past 150 years.
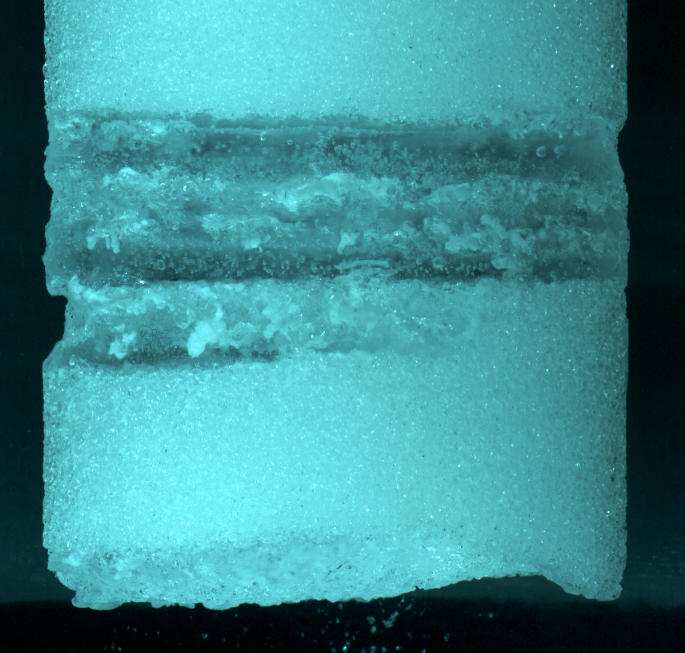
One of the ice cores taken from Mt. Hunter in June 2013. The bands of dark ice represent times when glacier snow melted and refroze in past summers. Credit: Dominic Winski.
The surge in melt events corresponds to a summer temperature increase of at least 1.2-2 degrees Celsius (2.2-3.6 degrees Fahrenheit) relative to the warmest periods of the 18thand 19th centuries, with nearly all of the increase occurring in the last 100 years. Because there were so few melt events before the start of the 20th century, the temperature change over the past few centuries could be even higher, Winski said.
Connecting the Arctic to the tropics
The research team compared the temperature changes at Mt. Hunter with those from lower elevations in Alaska and in the Pacific Ocean. Glaciers on Mt. Hunter are easily influenced by temperature variations in the tropical Pacific Ocean because there are no large mountains to the south to block incoming winds from the coast, according to the researchers.
They found during years with more melt events on Mt. Hunter, tropical Pacific temperatures were higher. The researchers suspect warmer temperatures in the tropical Pacific Ocean amplify warming at high elevations in the Arctic by changing air circulation patterns. Warmer tropics lead to higher atmospheric pressures and more sunny days over the Alaska Range, which contribute to more glacial melting in the summer, Winski said.
“This adds to the growing body of research showing that changes in the tropical Pacific can manifest in changes across the globe,” said Luke Trusel, a glaciologist at Rowan University in Glassboro, New Jersey who was not connected to the study. “It’s adding to the growing picture that what we’re seeing today is unusual.”
###
This research article is available for free for 30 days. A PDF copy of the article can be downloaded at the following link: https://agupubs.onlinelibrary.wiley.com/doi/pdf/10.1002/2017JD027539.
Glaciers move. The bottom most (oldest) glacial ice formed some 400 years upstream. You know, higher/colder.
First, they are playing fast and loose with the start of the industrial revolution. If I recall my history correctly, it began in the early 19th Century, more than 150 years ago. What happened closer to that date? The American Civil War of course! So that must be the cause, right? Climate never changes unless humans are involved.
I recall seeing a video discussing unexplained archaeological finds. One was what certainly appeared to be a human footprint in rock with dinosaur prints in the same rock. I’m surprised that it isn’t used as proof that human activity caused the extinction of the dinosaurs 65 million years ago!
Don’t forget the slaughter of millions of buffalo. That must have had a climate impact.
Avila (spain)
https://youtu.be/io5EqOjWo2w
Convenient…the LIA was fading away when they started the timeline. Pffft. Who paid for this ?
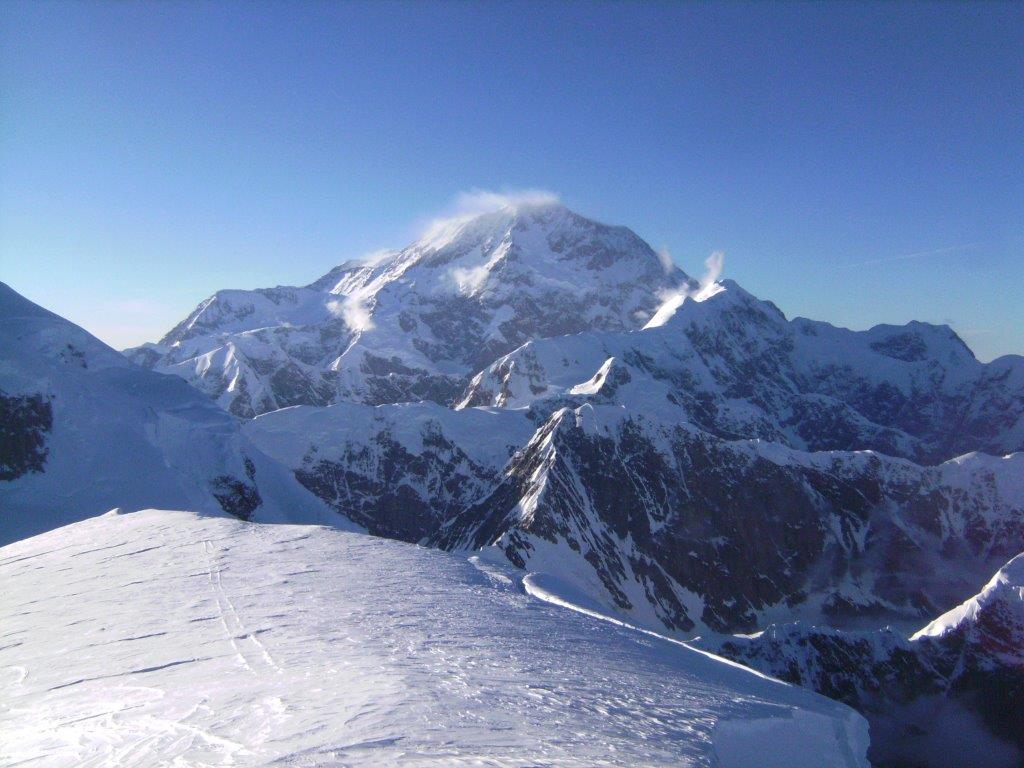
Love the Alaska Range. The view of the Moonflower buttress on Hunter in the video brings back lots of memories. Mugs Stumps did the first ascent. What an amazing climb. It’s hard to appreciate the size until you stand under it. Alas, Mugs got buried while guiding on Denali. I’ve trids the West Ridge and SW Ridge of Hunter. Got buried in snow on the West Ridge. Scary place to be with avalanches kicking off all around. I also froze my ass on a winter attempt on Denali. Brrrrrr. Nice standing on the summit though.
Just a FYI. If the helicopter is at the drill site, the drill site it isn’t on the summit plateau. The helicopter is sitting on the Kahiltna Glacier. I know the area very well. I didn’t watch the video
“….to drill the ice core, …” Simple question, since you’ve been there how representative do you think it is of what is going for the whole glacier? These sure get lots of pages and references and pretty graphs out of one sample, but did they take another for the deeper/older part? I live at 28° N latitude on the other side from Tom in Florida and a geologist friend showed up on his motorcycle with a heavy coat on this morning. Some days heat seems good since some of their cold is down here. Been quite a while since we had ice on the bay, but it did snow a little this winter. Gulf temperatures are usually given for the surface, some get influenced by inlets and wind.
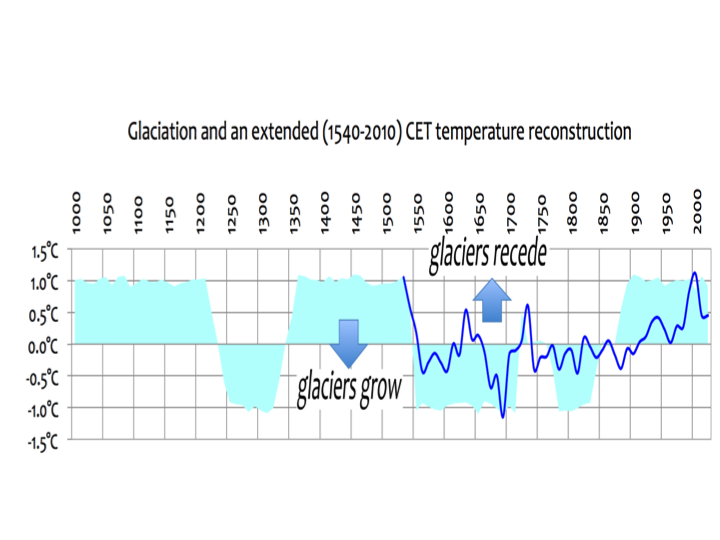
400 years. Wow!!! That would mean since . . Umm 2018-400 years is 1618. It seems I’ve heard something about a cold spell called the Little Ice Age happening about then? Anybody?
Bueller?
Bueller?
Bueller?
While these so-called scientists were polluting the glacier, real researchers discovered that Alaska’s glaciers are about the same size now as during the Medieval Warm Period. Presumably they were even smaller during the Roman, Minoan and Holocene Optimum Warm Periods:
http://www.climatedepot.com/2013/10/23/new-paper-finds-4-alaskan-glaciers-are-about-the-same-size-as-during-the-medieval-warm-period/
Warmists just love the “melting glaciers” gambit, because it provides physical evidence of warming. But skeptics/climate realists don’t deny that there has been some warming, although the temperature record has been skewed, naturally towards warming. Still, the “disappearing glaciers” is good emotion-laden grist for the Warmists mill. The children won’t know what glaciers are! Oh my, think of the children.
From the post:
“The more melt events they observed in a given year, the warmer the summer.
They found melt events occur 57 times more frequently today than they did 150 years ago. In fact, they counted only four years with melt events prior to 1850. They also found the total amount of annual meltwater in the cores has increased 60-fold over the past 150 years.”
1850
Golly that is about the time the LIA ended!
Snicker……………
Alaska was not iced over during the last ice age – animals grazed its grassy plains. It tends to seesaw the other way to the rest of US climate. So not a great bellwether of global climate.
However, Alaska’s mountains, eg the Brooks and Alaska Ranges, had more extensive glaciers during the LGM than now.
But its lowlying areas, such as the Yukon Valley and exposed floors of the Bering and Chukchi Seas continental shelf, were indeed, as you note, not iced over.
http://soccermachine.files.wordpress.com/2011/02/land-bridge1.jpg
The boggy steppe-tundra plains were too dry and windy for ice sheets to form.
http://www.nwtexhibits.ca/steppebison/climatechange/iceagemammals.jpg
http://www.sfu.museum/journey/ressources-resources/s/multimedia/illustrations/image_12.jpg
Minimum cartridge: .375 H&H.
Chimp
Thanks for the science and the nice images!
You’re welcome!
Remarkable the diversity of large animal life which the Beringian steppe-tundra supported.
Some think that people might have entered the New World sooner but for the threat presented by the short-faced bear, which made grizz look like cuddly Teddy bears.
Claim: use of the word “unprecedented” is unprecedented in the last 40 years. It was invented by Paul Ehrlich.
It’s the end of the world 🌍 as we know it and I feel fine.
There is also a preoccupation with the US and ENSO here, that’s regional weather, a significant contributor perhaps, but not net global change, nor typical of the global situation, obviously as that isn’t the case elsewhere, on the facts. Just saying.
Maybe…
One small possibility is refrozen melt pools.
A greater likelihood would be rain puddles that froze.
Without wasting time searching for the “summit plateau” altitude, we can start with Mt. Hunter’s altitude of 13,900 feet (4,260 meters). Considering Mt. Hunter’s location Latitude at 63.4°, it is very doubtful that much melting occurs during their short summers.
However, a warm front could dump liquid water that would likely freeze quickly.
There is also the curiosity regarding the geological instability of the Denali range. How does one trust the data they gather from unstable mountains?
Once again, eager students, activist professors get a fun vacation while confirming their own confirmation bias.
“Melting of Arctic mountain glaciers unprecedented in the past 400 years”
Let’s see, what was happening 400 years ago? Oh, yeah, the depths of the last mini-ice age.
The mountain isn’t even actually in the Arctic.
Bloggers here blithely assert that the world is warmer now than a couple of hundred years age because we are recovering from the Little Ice Age.
By what mechanism?
Are we drawing on a reserve of stored heat?
Or are we intercepting more heat from the sun?
Or has Nature reduced the duration or extent of cloud cover?
Some other way? Like???
If you are to be a credible sceptic, you have to support your assertions with mechanisms and evidence. Geoff
Actually you don’t have to propose a mechanism to observe the fact of a warmer world, if it be a fact, as virtually all paleo proxy and unadjusted instrumental data show.
The correlation between solar activity and climate however suggests a causal link.
Millennial-band climate spectrum resolved and linked to centennial-scale solar cycles
https://www.sciencedirect.com/science/article/pii/S0277379104003063
Spectral comparison of the Hulu Cave, GRIP, and GISP2 δ18O records suggests that the single dominant period centered on 1470 yr in the GISP2 spectrum, the so-called ‘1500-yr cycle’, is an artifact of the age model. The 230Th-dated Hulu Cave record indicates a millennial-band spectrum with a weak spectral peak near this period flanked by two stronger peaks centered on 1667 and 1190 -yr, similar to the GRIP δ18O record. All three millennial-band cycles may derive from heterodynes of centennial-band solar cycles as observed in the Holocene record of atmospheric 14C production. This suggests a link between centennial-scale solar variability and abrupt climate change at the millennial time scale.
As per Javier, 2017:
https://judithcurry.com/2017/12/02/nature-unbound-vi-centennial-to-millennial-solar-cycles/
Holocene climate has been affected in different periods by several centennial to millennial solar cycles. The ~ 1000-year Eddy solar cycle seems to have dominated Holocene climate variability between 11,500-4,000 years BP, and in the last two millennia, where it defines the Roman, Medieval, and Modern warm periods. The ~ 208-year de Vries solar cycle displays strong modulation by the ~ 2400-year Bray solar cycle, both in its cosmogenic isotope signature and in its climatic effects. The Centennial, and Pentadecadal solar cycles are observable in the last 400-year sunspot record, and they are responsible for the present extended solar minimum that started in 2008.
Cyclic rapid warming on centennial‐scale revealed by a 2650‐year stalagmite record of warm season temperature
https://agupubs.onlinelibrary.wiley.com/doi/full/10.1029/2003GL017352
A 2650‐year (BC665‐AD1985) warm season (MJJA: May, June, July, August) temperature reconstruction is derived from a correlation between thickness variations in annual layers of a stalagmite from Shihua Cave, Beijing, China and instrumental meteorological records. Observations of soil CO2 and drip water suggest that the temperature signal is amplified by the soil‐organism‐CO2 system and recorded by the annual layer series. Our reconstruction reveals that centennial‐scale rapid warming occurred repeatedly following multicentenial cooling trends during the last millennia. These results correlate with different records from the Northern Hemisphere, indicating that the periodic alternation between cool and warm periods on a sub‐millennial scale had a sub‐hemispherical influence.
Millennial- to centennial-scale climate periodicities and forcing
mechanisms in the westernmost Mediterranean for the past 20,000 yr
http://www.ugr.es/~grupo179/pdf/Rodrigo%20Gamiz%202014.pdf
Cyclostratigraphic analysis conducted on a continuous high-resolution marine record from the western most Mediterranean reveals well-identified paleoclimate cycles for the last 20,000 yr. The detrital proxies used (Si/Al, Ti/Al, Zr/Al, Mg/Al, K/Al, Rb/Al) are related to different sediment-transport mechanisms, including eolian dust and fluvial runoff, which involve fluctuations in the atmosphere–hydrosphere systems. These fluctuations are accompanied by changes in marine productivity (supported by Ba/Al) and bottom-water redox conditions (Cu/Al, V/Al, Zn/Al, Fe/Al, Mn/Al, U/Th). Spectral analysis conducted using the Lomb–Scargle periodogram and the achieved significance level implemented with the permutation test allowed us to establish major periodicities at 1300, 1515, 2000, and 5000 yr, and secondary peaks at 650, 1087, and 3000 yr. Some of these cycles also agree with those previously described in the North Atlantic Ocean and circum-Mediterranean records. The periodicities obtained at 2000 and 5000 yr support a global connection with records distributed at high, mid, and low latitudes associated with solar activity, monsoonal regime and orbital forcing. The 1300- and 1515-yr cycles appear to be linked with North Atlantic climate variability and the African monsoon system. Thus, the analyzed record provides evidence of climate cycles and plausible forcing mechanisms coupled with ocean–atmosphere fluctuations.
Cited in the above paper:
Holocene climate variability of the Norwegian Atlantic Current during high and low solar insolation forcing
https://agupubs.onlinelibrary.wiley.com/doi/abs/10.1029/2010PA002002
A high‐resolution sediment core from the Vøring Plateau has been studied to document the centennial to millennial variability of the surface water conditions during the Holocene Climate Optimum (HCO) and the late Holocene period (LHP) in order to evaluate the effects of solar insolation on surface ocean climatology. Quantitative August summer sea surface temperatures (SSSTs) with a time resolution of 2–40 years are reconstructed by using three different diatom transfer function methods. Spectral‐ and scale‐space methods are applied to the records to explore the variability present in the time series at different time scales. The SSST development in core MD95‐2011 shows a delayed response to Northern Hemisphere maximum summer insolation at ∼11,000 years B.P. The record shows the maximum SSST of the HCO to be from 7.3 to 8.9 kyr B.P., which implies that the site was located in the regional warm water pool removed from the oceanic fronts and Arctic waters. Superimposed on the general cooling trend are higher‐frequency variabilities at time scales of 80–120, 210–320, 320–640, and 640–1280 years. The climate variations at the time scale of 320–640 years are documented both for periods of high and low solar orbital insolation. We found evidence that the submillennial‐scale mode of variability (640–900 years) in SSST evident during the LHP is directly associated with varying solar forcing. At the shorter scale of 260–450 years, the SSST during the LHP displays a lagged response to solar forcing with a phase‐locked behavior indicating the existence of a feedback mechanism in the climate system triggered by variations in the solar constant as well as the role of the thermal inertia of the ocean. The abruptness of the cooling events in the LHP, especially pronounced during the onsets of the Holocene Cold Period I (approximately 2300 years B.P.) and the Little Ice Age (approximately 550 years B.P.), can be explained by a shutdown of deep convection in the Nordic Seas in response to negative solar insolation anomalies. These cooling events are on the order of 1.5°C.
No, I disagree. Stating one does not find any of the proposed explanations credible, and stating one’s reasons why they are not credible, is sufficient. One does not have to come up with one’s own credible explanation. What you are tending towards is a version of the ad ignorantium fallacy==> because no one has a good argument explaining cycles between Milankovich cycles, it must be CO2.
At 13000 ft what is the range of actual air temperature, and does it go above 32 Dec. For any extended periods during the summer?
[The mods point out that very little air extends past 31 Dec. .mod]
We are now in the Modern Warm Period and what is happening is what one would expect. How does glacial melting during the Modern Warm Period compare to what happened turing the previous Medevial Warm Period? There is no real evidence that what is happeing has anything to do with Mankind’s burning of fossil fuels.
A paper on the last 2000 years of glacial advance and retreat. (just the abstract here)
http://www.whoi.edu/cms/files/solomina16qsr_238964.pdf
“A global compilation of glacier advances and retreats for the past two millennia grouped by 17 regions
(excluding Antarctica) ”
“The timing and scale of glacier fluctuations over the past two millennia varies greatly from region to
region. However, the number of glacier advances shows a clear pattern for the high, mid and low latitudes
and, hence, points to common forcing factors acting at the global scale. Globally, during the first
millennium CE glaciers were smaller than between the advances in 13th to early 20th centuries CE. The
precise extent of glacier retreat in the first millennium is not well defined; however, the most conservative
estimates indicate that during the 1st and 2nd centuries in some regions glaciers were smaller
than at the end of 20th/early 21st centuries. ”
and
“Other periods of glacier retreat are identified regionally
during the 5th and 8th centuries in the European Alps, in the 3rde6th and 9th centuries in Norway,
during the 10the13th centuries in southern Alaska, and in the 18th century in Spitsbergen. However, no
single period of common global glacier retreat of centennial duration, except for the past century, has yet
been identified. In contrast, the view that the Little Ice Age was a period of global glacier expansion
beginning in the 13th century (or earlier) and reaching a maximum in 17the19th centuries is supported
by our data.”
So the question is are we actually seeing exceptional glacial retreat globally now?
Maybe not.
Unprecedented means it’s NEVER happened before. “Unprecedented in 400 years” is an oxymoron.
Wondering what the CCC will say (Climate Change Cult) to this one?
https://judithcurry.com/2015/11/25/the-rise-and-fall-of-central-england-temperature/