The “I’ll never fly again and I’ll get a vasectomy to save the planet” guy, Eric Holthaus, flips out over weather. The guy’s a credentialed meteorologist, but turns a short term regional weather pattern into long term climate. Sad, just sad.
by Mike Bastasch
Warm air made its way up to the high Arctic in the last few days, driving temperatures up to 20 degrees above average.
While it’s not unusual for Arctic temperatures to spike in winter, news drove a wave of speculation about whether the Arctic has reached a global warming tipping point.
Environmental writer Eric Holthaus claimed on Sunday the high Arctic “at its warmest wintertime temperature ever measured” between November and early March.
At this moment, the Arctic is at its warmest wintertime temperature ever measured. (between early November and late March)
A shocking sign of our Earth's accelerating planetary fever. https://t.co/YmJyJ8Teao
— Eric Holthaus (@EricHolthaus) February 25, 2018
Warm moist air from the Pacific and Atlantic oceans have warmed up the Arctic above the 80th parallel. It should be noted, however, that the Arctic circle actually starts at 66 degrees North, meaning the record heat is over a much narrower area.
Greenland hit 6 degrees Celsius on Saturday, 35 degrees above average. The Sydney Morning Herald reported that parts of Greenland were warmer than most of Europe — a little misleading since Europe is engulfed in freezing winter temperatures.
So, how unusual is this?
Cato Institute atmospheric scientist Ryan Maue looked at high Arctic temperature data going back to 1958 shows that warm spikes are nothing new. An EKG-like pattern is clearly visible in the data, but there is a warming tend. Data before the satellite-era — 1976 — has some problems, so it’s hard to say the current spike is for sure a record. Most of the Arctic warming has come during the winter months, Maue said.
https://twitter.com/RyanMaue/status/968184434318041089
https://twitter.com/RyanMaue/status/968184904763805701
NASA sea ice expert Alek Petty said heat from the North Atlantic and North Pacific have hit the Arctic in the past, but told Earther events like this now resemble “a heat wave on steroids” because of global warming.
“The key is they’re happening more frequently, lasting longer and their intensity is increasing,” Petty said. “It’s this triple whammy of factors.”
Warm air from the North Pacific has eaten away at sea ice in the Bering Strait between Alaska and Russia. Sea ice levels are at a record-low for the Arctic as a whole. Satellite records go back to 1979.
Originally published at The Daily Caller. Content created by The Daily Caller News Foundation is available without charge to any eligible news publisher that can provide a large audience.
Meanwhile, the ice cap is still there:

-30C is cold isn’t it?
CAGW gate-keeper Doyle has all the answers!
27 Feb: Reuters: ‘Wacky’ weather makes Arctic warmer than parts of Europe
by Alister Doyle; editing by William Maclean
A freak warming around the North Pole is sending a blast of Arctic cold over Europe in a sign of “wacky” weather that may happen more often with man-made global warming, scientists said on Monday.
On the northern tip of Greenland, the Cape Morris Jesup meteorological site has had a record-smashing 61 hours of temperatures above freezing so far in 2018, linked to a rare retreat of sea ice in the Arctic winter darkness.
“It’s never been this extreme,” said Ruth Mottram, a climate scientist at the Danish Meteorological Institute (DMI). Warmth was coming into the Arctic both up from the Atlantic and through the Bering Strait, driving and cold air south…
As long ago as 1973, a study suggested that an ice-free Arctic Ocean could make regions further south colder. That “warm Arctic, cold continent” (WAC#C) pattern is sometimes dubbed “wacc-y” or “wacky” among climate scientists.
“Wacky weather continues with scary strength and persistence,” tweeted Professor Lars Kaleschke, a professor at the University of Hamburg.
“The question is whether this weather will happen more often. This is just one event so it’s hard to make a causal relationship,” he told Reuters…
Scientists say a long-term shrinking of sea ice on the Arctic Ocean, linked to global warming, exposes warmer water below that releases more heat into the atmosphere. That in turn may be disrupting the high altitude jet stream.
“The jet stream becomes wavier, meaning that colder air can penetrate further south and warmer air further north,” said Nalan Koc, research director of the Norwegian Polar Institute…
Erik Solheim, head of the U.N. Environment, said the rare weather fits a wider pattern driven by a build-up of greenhouse gases, mainly from burning fossil fuels from cars, factories and power plants.
“What we once considered to be anomalies are becoming the new normal. Our climate is changing right in front of our eyes, and we’ve only got a short amount of time to stop this from getting significantly worse,” he told Reuters…
The World Meteorological Organization said the chill in Europe was caused by a “Sudden Stratospheric Warming” above the North Pole that led to a split in the polar vortex, a cold area of air above the Arctic that spilled cold south…
And Mottram at DMI said Europe’s winters had become less severe. “It’s not actually that cold. It’s just our perceptions have shifted from a normal winter.”
https://www.reuters.com/article/us-europe-weather/wacky-weather-makes-arctic-warmer-than-parts-of-europe-idUSKCN1GA2AD
Again, for the mentally retarded, the Arctic Sea is COVERED with ICE, and will be for the foreseeable future. That includes several hundred years, not just 5.
Are you possibly talking about the Greenland glaciers? The Arctic sea is not fully covered by ice, and it remains somewhat elusive under what scenarios, and when, it would/could melt. Like, 2013 didn’t happen, and I think in a few years, the end will be pushed further year by year so that Al Gore III may make his living out of it.
Shall we make a bet on when 1 Wadhams is met?
According to the satellite image at NSIDC it is covered. What should be believed? What can actually be seen or what someone seeking more government funding says? What a conundrum.
I also look forward to the upcoming summer season of environwackadoodles attempting to sail, row or inner tube to the North Pole. Perhaps this time they will be billed for the rescue they receive instead of our tax monies being wasted on them.
A small wooden ship, the St. Roch, sailed through the Northwest Passage and across the high Canadian Arctic twice, in 1942 and 1944. Try doing that in a small wooden ship today.
These voyages followed soon after the global warming period that ended circa 1940. What was the ice extent and thickness then? Probably less than, or no greater than today.
https://www.vancouvermaritimemuseum.com/permanent-exhibit/st-roch-national-historic-site
THE ST. ROCH – A TRUE CANADIAN ADVENTURE.
Built in British Columbia, named after a parish in Quebec, captained by a Norwegian immigrant, crewed by farm boys from across the country, and helped by the Inuit, the St. Roch was the first vessel to sail the Northwest Passage from west to east (1940-1942), the first to complete the passage in one season (1944), and the first to circumnavigate North America.
One of the only ships in service in the Arctic in the early part of the 20th century, the St. Roch is made of an unusual design of thick Douglas Fir planks reinforced with heavy beams to withstand the ice pressure and an outer shell made of some of the hardest wood in the world, Australian Eucalyptus ‘iron bark’.
Between 1928 and 1954, St. Roch logged tens of thousands of miles crossing and re-crossing the Arctic, acting as a floating detachment of the RCMP in the North. At various times a supply ship, a patrol vessel and a transport, the St. Roch was the only link between the various scattered northern communities. Yet it had not yet accomplished the feat for which it would become famous. For many years, it had been the dream of Captain Henry Larsen to cross the Northwest Passage, just as Amundsen had done for the first time in the Goja in 1903. But time and time again, the dream had to remain a dream.
Finally, with the outbreak of the Second World War and the Nazi invasion of Denmark (Greenland), the opportunity presented itself. Launched on its famous voyage on a secret mission to cross the Arctic during the war, this amazing vessel traveled through treacherous and uncharted waters to cross the Northwest Passage and the High Arctic, with only a small crew of steadfast men who had just their skill, talent and no small amount of luck to rely on. Incredibly, they managed to make the crossing not just once, but twice, and in only 86 days the second time!
Yes. My essay Northwest Passage in ebook Blowing Smoke has a photo of RCMP Lt. Larsen, the skipper, at the St. Roch helm during the 1944 single season west transit via the NWP northern route. Gave a whole new meaning to ‘ice free’, one of the essay’s main themes. BTW, one of the currently active Canadian arctic icebreakers is the Larsen, named in his honor.
So…a major ‘cooling’ event is under way in the Arctic.
Oh dear.
https://twitter.com/rarohde/status/967912767608016896
The Russians once thought that the Arctic (87.5-72.5N) had a yearly mean 2°C above the 1970-75 mean in 1937. It would have been interesting to know how many such weather events occurred back then rather than going back to 1980.
We may never know.
The point is simple: You have records, and you have new extremes within those records.
you can speculate and wonder what would be the case where and when you have no data,
BUT that is mere speculation.
Unless you have a method for filling in missing data, a tested method with errors, all your have is the data:
The existing record. new extreme within that record.
SPECULATION about what might have been the case outside that record.
There is no point in speculating about what might have been the case.
As for the significance of the new record? I would say the new records are not scientifically interesting.
YET.
A) we know GHGs warm the planet
B) we know this warming will express itself at the poles more likely than at other places.
C) records that CONFIRM this knowledge are not very interesting, because we already expect
to see things like this. They dont make the science any more solid, because the case is
alrready rock solid.
What is interesting are local areas that see the opposite of what we superficially expect. Now none of these local occurances will ever dislodge the science.. because we can’t absolutely rule out all local cold zones, we simply dont know where they will occur, how severe they will be, and how long they will persist. We do expect them to become more and more rare over the stretch of the decades.
A record that goes back a whopping 30+ years.
Big freaking whoop.
It snowed in Rome today. That is just as significant as this ‘shocking spike’. In other words, it isn’t significant at all.
Mosher, I thought you were above stooping to anecdotes… but I guess not.
…and Loki’s Castle has nothing to do with it?
Riiiight. (Geothermal Feild at 73N) north of Iceland.
LOL. “A shocking sign of our Earth’s accelerating planetary fever.”
Really. LOL! I thought the “planetary fever” thing went away around the same time Al Gore had his famous massage encounter.
We can learn much more about what is really going on by most of you skeptics rather than a guy like Toneb (even though he has been a meteorologist for 40 years) who is so biased with the AGW hoax that to explain things that always are on target with his beliefs he has to keep stretching logic to the point of incredulity. When you start with a false premise that has no physics behind it then it becomes harder and harder to maintain the narrative. Here is another example from David Battisti who has a PhD in Atmospheric Science and is Chairman of that department at University of Washington in Seattle and who has done at least 138 separate scientific climate and earth system studies from 1981 to the present. His connections worldwide are enormous and he is one of the pillars of the AGW hoax. He is an alarmist of the worst kind: witness one of his latest concerns; global warming and food security!!!!!!!!!!!!!!!!!!. That will be the focus one of my future posts about him. When you look at the titles of his studies throughout the years, you begin to understand that he actually has a grand master plan. He has begun in the 80’s studying the tropics and the oceans all with a AGW bias and has slowly built up to atmospheric studies globally. He has then branched out to other scare topics like the food security paper referenced above. This is in stark contrast to other research scientists who usually end up focusing on a narrower and narrower field of their expertise so that their scientific studies do not catch much worldwide attention. Einstein and various others like Max Planck were amazing exceptions to this rule. Dont forget that Battisti said in
2015 Tetreault-Pinard, E., D.S.Battisti, and M.B.Baker: Impacts of Surface Moisture on Surface Temperature Variability. Submitted, J. Climate, Dec.
I quote “A STRIKING FINDING IS THAT ALL LAND AREAS BELONG TO ONE OF TWO REGIMES DEFINED BY THE ROLE OF SURFACE MOISTURE ON TEMPERATURE VARIABILITY. IN DRY REGIONS VARIATIONS IN MOISTURE ENHANCE THE IMPACTS OF FORCING ANOMOLIES ON TEMPERATURE , WHEREAS IN WET REGIONS, SURFACE MOISTURE VARIATIONS ACTING BY A SOMEWHAT DIFFERENT MECHANISM ,DAMP THE TEMPERATURE FLUCTUATIONS.” Let that 2 sentence quote sink in for 30 seconds.in this same report the authors continually compare their model to other computer models and to the famous ERA reanalysis. They write up the report as if the ERA realysis had actual soil moisture data but when you go to the site
https://climatedataguide.ucar.edu/climate-data/era40
You soon understand that you are not dealing with original soil sample data you are dealing with yet another computer model. The only actual data that is in the ERA data is radiation flux data from satellites and climate proxies from the past. There are actually ground water data sets of data that ERA has in its database but these are not actually soil sample data but are satellite or radiosonde data sets. So in the end there is no soil sample data to compare to. The whole study is built on a house of computer models.
Battisti can get away with what he is doing and saying because he really isn’t doing real science. He is using computer models to relate to us his virtual AGW world description of what he wants us to think of how the world works. Also very telling is that there are very very few climate studies which contradict previous climate studies from other climate scientists. Within their community that is shunned and your career wont last long and the grants will soon dry up. I have noticed that there is definitely a world wide pecking order of importance vis a vis the scientists themselves. Battisti for all his experiences and connections( has been invited all over the world to give talks on climate change) seems to be subservient to Trenberth. This is evident in one of Battisti’s 2014 studies where he references a new idea of Trenberth that says that it isnt reduced OLR that is the result of global warming but enhanced ASR(net absorbed solar radiation)!!!!!!!!!!!!!!!. Battisti then jumps in with his own study that of course reinforces Trenberth’s thesis. You will remember Trenberth being the one that made the Earth Energy Budget. So it seems that Battisti is biding his time until Trenberth who is 73 will retire. Since Battisti is in his fifties he is well placed to become the world’ premier AGW hoaxer. Meanwhile I am working back on his studies from 2011 and am delving into his record; study by study to uncover real howlers in his reports. Perhaps I should start at the beginning of his work in 1981 but I will need 2 lifetimes to do that. So I have decided to jump around because obviously his studies are interconnected and sometimes contradict each other. I have already documented several of his howlers (definition is an unbelievably bad case of logic) in previous posts. Here is one of his and his protege Aaron Donohue from March 2011 is titled 2011 Donohoe, A. and D.S. Battisti:
Atmospheric and surface contributions to planetary albedo. J. Climate, 24, 4402-17.
I quote this from the abstract
” The vast majority of the observed global average planetary albedo (88%) is due to
atmospheric reflection. Surface reflection makes a relatively small contribution to planetary albedo because
the atmosphere attenuates the surface contribution to planetary albedo by a factor of approximately 3.”
The word attenuate means “reduces the force of “. The 2nd sentence above is a statement of measurement. It is not a cause and effect statement so he should have ended the 2nd sentence after the word albedo.
A minor point but dont forget these are PhDs not grade school physicists.
“We can learn much more about what is really going on by most of you skeptics rather than a guy like Toneb (even though he has been a meteorologist for 40 years) who is so biased with the AGW hoax that to explain things that always are on target with his beliefs he has to keep stretching logic to the point of incredulity. ”
An entirely to be expected opinion from most denizens.
It is not a”belief”.
That does not require evidence.
Witness the many “imaginary friends millions on Earth worship – some to evil purpose.
32 years actually.
Yes, biased …. by the evidence.
Which only gets posted from the full width of the science when such as myself and especially Nick Stokes turns up, and puts up with the ……… that follows as night follows day.
So denizens remain cocooned in their beliefs.
I read the full science and come to it with a certain knowledge that I know works because I have sat there on a night-shift and watched the GHE work (just as a FI).
As I post here, to the expected opprobrium – but one must deny ignorance (by producing evidence and not by shouting people down (eg our NOT much lamented AndgyG55)) with hand-waving a cheered-on denigration.
So it is logical to assume AGW is a “hoax”.
Really??
Right Oh.
You live in a strange world my friend
Sorry but that is beyond bizarre.
The world works via cock-up and not conspiracy.
That belongs in the minds of the deluded.
Incredulity is a self-fulfilling prophecy if you do not look and the evidence provides in it’s entirety and instead read the one-sided versions produced here and elsewhere on certain Blogs
CAGW is a hoax. The real description, at worst, would be BAGW — beneficial anthropogenic global warming. The best description, congruent w/our present understanding, is BGW — beneficial global warming.
As a proxy for Arctic domain winter temperatures ( northern Canada is often subject to the full PV) …..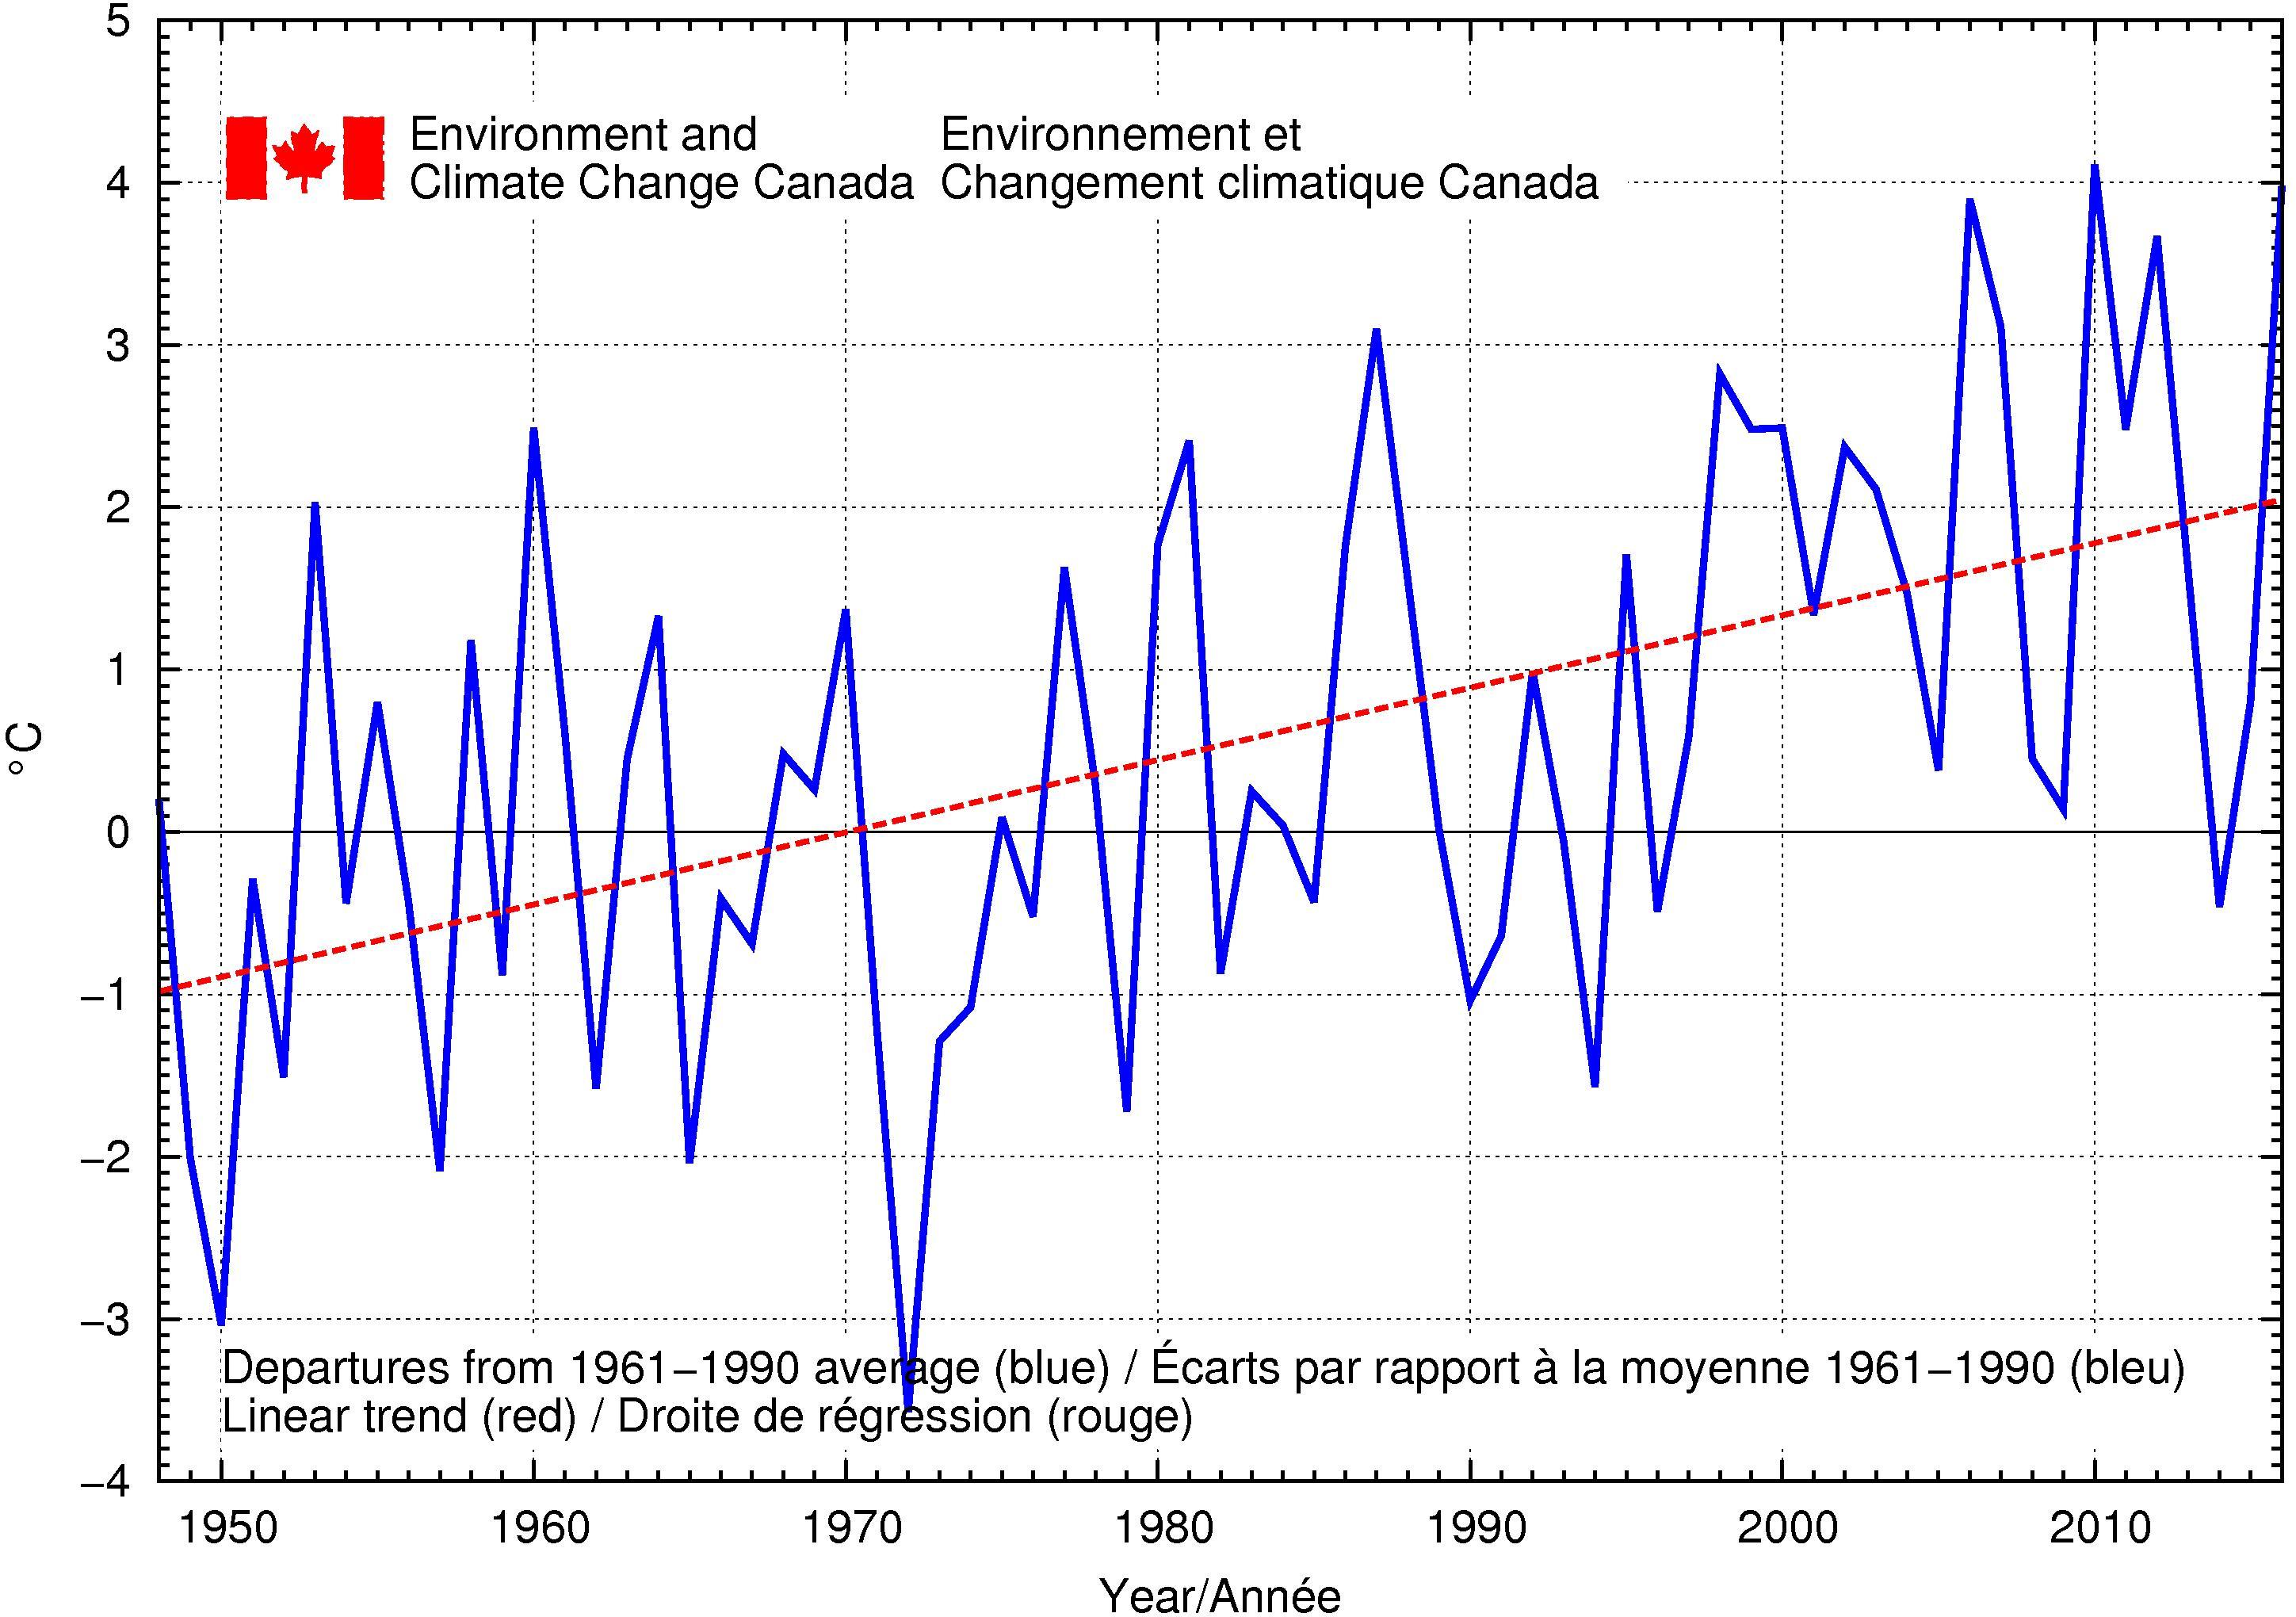
“The time series graph shows that, when averaged across the country, winter temperatures have fluctuated from year to year over the period 1948-2016. The linear trend indicates that winter temperatures averaged across the nation have warmed by 3.3°C over the past 69 years.”
What is the data source? Measurements, Adjusted data or even Model output?
And if measurements: which/where.
Just check the name on top. That name was changed to reflect the AGW cult. The current head is “Climate Barbie”. Canada had the biggest delegation at the Paris feast and our current PM is a big fan of the scam. That graph look like “fake news” to me.
Guy, while you have some point, you’re basically setting charges without evidence. There is a risk of biasing results when your funding depends on whether you find global warming and not weather. But that is just a risk without anything concrete.
Guy, you forgot to include the words Marxist, socialist, rent seeking, virtue signaling, and Agenda 21 in your post.
Remind me again Tone, where’s the catastrophe? +3 degrees C in the depth of the Canadian Arctic winter?
Looks like a stable fluctuating temperature around a zero warming trend up to the 97/98 Super El Niño when the step jump is evident in the trend which sets a new zero warming trend at a higher anomaly with stable fluctuations in the anomaly around the new post 97/98 Super El Niño zero warming trend.
Does anyone know if arctic sea ice is at its lowest ever for this time of year? I read in the paper it was above freezing at the North Pole yesterday and the sun hasn’t risen above the horizon this winter..
Lowest for the date but there is still potentially a week or two until max. and could climb above 2015 – the lowest max.
https://ads.nipr.ac.jp/vishop/#/extent
Sea ice extent is lowest, but sea ice extent is a meaningless number because things other than temperature (wind, currents, waves) affect it also. Sea ice volume is higher now than it was in 2008.
Uh, huh that’s a much better look – really bouncing back.
http://psc.apl.uw.edu/wordpress/wp-content/uploads/schweiger/ice_volume/BPIOMASIceVolumeAprSepCurrent.png
Btw volume is a model output whereas extent and concentration are pixels counted from satellite photos. The irony is that volume shows the biggest decline some 70% in the satellite era. In other words the real loss has been masked by a thinning veneer.
Even by PIOMAS standards volume is flat since 2009.
Holy crap! Are you saying that arctic sea ice has declined by 10,000 cubic kilometres since 1980??? 10,000 CUBIC KILOMETRES- that is an INSANE amount!
Yesh, zazove says (using the linear trend line) it’s gone in 2030 or so. It/she/he is wrong of course.
1000kmx1000kmx1m is 1000 km³, so 10,000 is a not really an INSANE amount.
the headlines could easily have read “much of europe is colder than the arctic ” i wonder why they didn’t ? on second thoughts i don’t wonder that at all.
toneb says winter temps in the arctic are averaging 3 c higher . i strongly suspect if that is the case all living things in the arctic will be happy.
Vasectomy? Another victory for Darwin!
He was a dud anyway?
Alarmists says:
At this moment, the Arctic is at its warmest wintertime temperature ever measured.
Example of Newspeak. It’s never “warm” in the Arctic winter…
Yeah. It served them good to be hauled on-site for 10 minutes.
Good. I want less and less ice and warmer temps. Thank you God.
Yes, Faknews Inc hates Donald Trump, meanwhile Trump is kicking in their heads, growing the economy, expanding American industry and dropping the amount American citizens are paying in federal taxes. And all that really pisses off you adherents of the Church of Man Caused Globall Warmining. And we are enjoying your pain immensely.
Humans are not causing climate to change and can not stop it from changing. Period. Full stop. Stop wasting your life with this fantasy, go out and do something productive and beneficial for your fellow citizens.
I wonder if we will see another surge in growth in arctic sea extent if and when the NAO and the AO both turn very negative, the very positive NAO could be the reason we have had slow ice growth this winter so far.
http://nsidc.org/arcticseaicenews/
http://www.cpc.ncep.noaa.gov/products/precip/CWlink/pna/nao_index.html
http://www.cpc.ncep.noaa.gov/products/precip/CWlink/daily_ao_index/ao_index.html
Just checked NOAA’s GHCN daily files for the seven stations reporting TMAX values. The highest recorded temperature was 3.9°C on Saturday, not 6. The Cape Morris Jesup station is not one of the 7280 station used in the Monthly GHCN data set, nor is it among the 105395 station in the GHCN daily list. So why is it the poster child for Greenland now? Its WMO station id is 04301, but I can’t find any data for WMO stations anywhere. It sure is hard finding this data sometimes. I give credit to NOAA for making it easy to get from them.
If anyone knows how to get WMO station information, I’d really appreciate a link.
Is there some way to get the links on the sea ice reference page fixed? Basically the links to the NRL pages are pointing to an obsolete product that hasn’t updated since last year. The basic fix is to change all links with the path:
https://www7320.nrlssc.navy.mil/hycomARC/navo/
To the path:
https://www7320.nrlssc.navy.mil/GLBhycomcice1-12/navo/
Thanks!