From Dr. Roy Spencer:
UAH Global Temperature Update for January, 2018: +0.26 deg. C
Coolest tropics since June, 2012 at -0.12 deg. C.
The Version 6.0 global average lower tropospheric temperature (LT) anomaly for January, 2018 was +0.26 deg. C, down from the December, 2017 value of +0.41 deg. C:

The global, hemispheric, and tropical LT anomalies from the 30-year (1981-2010) average for the last 13 months are:
YEAR MO GLOBE NHEM. SHEM. TROPICS
2017 01 +0.33 +0.31 +0.34 +0.10
2017 02 +0.38 +0.57 +0.20 +0.08
2017 03 +0.23 +0.36 +0.09 +0.06
2017 04 +0.27 +0.28 +0.26 +0.21
2017 05 +0.44 +0.39 +0.49 +0.41
2017 06 +0.21 +0.33 +0.10 +0.39
2017 07 +0.29 +0.30 +0.27 +0.51
2017 08 +0.41 +0.40 +0.42 +0.46
2017 09 +0.54 +0.51 +0.57 +0.54
2017 10 +0.63 +0.66 +0.59 +0.47
2017 11 +0.36 +0.33 +0.38 +0.26
2017 12 +0.41 +0.50 +0.33 +0.26
2018 01 +0.26 +0.46 +0.06 -0.12
Note that La Nina cooling in the tropics has finally penetrated the troposphere, with a -0.12 deg. C departure from average. The last time the tropics were cooler than this was June, 2012 (-0.15 deg. C). Out of the 470 month satellite record, the 0.38 deg. C one-month drop in January tropical temperatures was tied for the 3rd largest, beaten only by October 1991 (0.51 deg. C drop) and August, 2014 (0.41 deg. C drop).
The last time the Southern Hemisphere was this cool (+0.06 deg. C) was July, 2015 (+0.04 deg. C).
The linear temperature trend of the global average lower tropospheric temperature anomalies from January 1979 through January 2018 remains at +0.13 C/decade.
The UAH LT global anomaly image for January, 2018 should be available in the next few days here.
The new Version 6 files should also be updated in the coming days, and are located here:
Lower Troposphere: http://vortex.nsstc.uah.edu/data/msu/v6.0/tlt/uahncdc_lt_6.0.txt
Mid-Troposphere:http://vortex.nsstc.uah.edu/data/msu/v6.0/tmt/uahncdc_mt_6.0.txt
Tropopause:http://vortex.nsstc.uah.edu/data/msu/v6.0/ttp/uahncdc_tp_6.0.txt
Lower Stratosphere: http://vortex.nsstc.uah.edu/data/msu/v6.0/tls/uahncdc_ls_6.0.txt
This thread will be updated when UAH issues their official press release.
UPDATE:
Global Temperature Report: January 2018 Temperatures fall as La Niña’s effects are felt
Global climate trend since Nov. 16, 1978: +0.13 C per decade
January temperatures (preliminary)
Global composite temp.: +0.26 C (about 0.47 degrees Fahrenheit) above 30-year average for January.
Northern Hemisphere: +0.46 C (about 0.83 degrees Fahrenheit) above 30-year average for January.
Southern Hemisphere: +0.06 C (about 0.11 degrees Fahrenheit) above 30-year average for January.
Tropics: – 0.12 C (about 0.22 degrees Fahrenheit) below 30-year average for January.
December temperatures (revised):
Global Composite: +0.41 C above 30-year average
Northern Hemisphere: +0.50 C above 30-year average
Southern Hemisphere: +0.33 C above 30-year average
Tropics: +0.26 C above 30-year average
(All temperature anomalies are based on a 30-year average (1981-2010) for the month reported.)
Notes on data released Feb. 1, 2018:
A La Niña equatorial Pacific Ocean cooling event is making itself felt in the atmosphere, dropping average temperatures in the tropics to their lowest point since June 2012 (-0.15 C), and temperatures in the Southern Hemisphere (+0.06 C) to their coolest since April 2015 (-0.01 C), according to Dr. John Christy, director of the Earth System Science Center (ESSC) at The University of Alabama in Huntsville.
The drop in tropical temperatures (0.38 C) from December to January tied for the third largest one-month drop in the 470 months of satellite temperature data. The largest was 0.51 C from September to October 1991, which followed the eruption of the Mount Pinatubo volcano in the Philippines. The second largest (0.41 C) was from July to August 2014.

Compared to seasonal norms, the coldest spot on the globe in January was near the Tsambagarav-Uul National Park, in eastern Mongolia. Temperatures there were 3.22 C (about 5.80 degrees Fahrenheit) cooler than seasonal norms.
Compared to seasonal norms, the warmest place on Earth in January was near Wrangel Island, in the East Siberian Sea. Tropospheric temperatures there averaged 4.75 C (about 8.55 degrees Fahrenheit) warmer than seasonal norms.
As part of an ongoing joint project between UAH, NOAA and NASA, Christy and Dr. Roy Spencer, an ESSC principal scientist, use data gathered by advanced microwave sounding units on NOAA and NASA satellites to get accurate temperature readings for almost all regions of the Earth. This includes remote desert, ocean and rain forest areas where reliable climate data are not otherwise available.
The satellite-based instruments measure the temperature of the atmosphere from the surface up to an altitude of about eight kilometers above sea level. Once the monthly temperature data are collected and processed, they are placed in a “public” computer file for immediate access by atmospheric scientists in the U.S. and abroad.
The complete version 6 lower troposphere dataset is available here:
http://www.nsstc.uah.edu/data/msu/v6.0/tlt/uahncdc_lt_6.0.txt
Archived color maps of local temperature anomalies are available on-line at:
Neither Christy nor Spencer receives any research support or funding from oil, coal or industrial companies or organizations, or from any private or special interest groups. All of their climate research funding comes from federal and state grants or contracts.
— 30 —
Do we start a new pause? Or does the temperature lower enough to continue the old pause?
As long as it is a pause and not an extended cooling trend, I’d be happy. It will take cooling to finally destroy the CAGW beast, but cooling kills people and causes crop failures so I’d rather it stay about where it is.
It will take direct targeted lightening strikes against specific persons to destroy the CAGW beast, just look at Mann’s recent comments about the cold weather in the East or any of the nonsense that comes from the facial portal of Algore.
Agree with you OweninGA, but the sad fact is that it IS coming. Four feet of snow in Tehran and snow further south in Iran; snow in the Sahara for the second year running; snow in southern Morocco; a few years ago cattle were found frozen to death in South America; the USA caught in a deep freeze that extends down to Texas. We are at the end of the current interglacial. Please send CO2…..
Even that won’t stop them. They (Hansen et al) are now saying that there might be a decade or two of cooling but that CO2 will come back and be a huge problem. They just move the goalposts. We will be watching glaciers advance for decades and they will still be bleating about CO2.
Am I correct in perceiving that the CAGW cultist dogmatists are intent on forcing “other people” to develop and implement low or no CO2 alternative energy sources while having no intentions beyond sitting back on their dead duffs waiting for those “other people” to ensure they stay warm in winter and cool in summer not to mention be able to make use of air transport when an if it is desired?
Science vs. Science Dogma – Just Think of It
just.thinkofit.com/science-vs-science-dogma
Science vs. Science Dogma. “There is a conflict in the heart of science between science as a method of inquiry based on reason, evidence, hypothesis, and collective investigation, and science as a belief system, or a world view.
Well that is not going to happen. The cooling trend is here and you can see the results of that over at iceagenow who are doing a fine job of collating the extraordinary number of cold events occurring. I am now firmly convinced that the many scientists who predicted this would happen are correct.
God alone knows what is coming as a result of this grand solar minimum, but clearly warming is not on the agenda.
If it drops another 0.11C then the temp wil equal 1997 (prior to the 1998 El Niño warming). That could be viewed as a possible extension of the “Pause” at that point, though statistically it would require several more years at or below that level for an actual continuation of “The Pause”.
So we’re now within .11C of 1997? The fact such piffling fractions and margins are argued about says much of the absurdity of ‘global warming’ hysteria. What a pile of tripe it is.
Why years? Wouldn’t half a year or so be enough to eyeball a flat-line in the trend?
What do you mean by 1997? January 1997 was 0.41C cooler than January 2018, 1997 as a whole was just below 0C, so 0.26C below 2018 to date.
Thanks Bellman, I was looking at the incorrect line from the other peak. It should have been 1996 instead of 1997. And it is already lower than the peak in 1995
Thanks Bellman,
I meant 1996…
Bryan A, it looks to be about the same temperature at January 1998, which was going up, while this one is going down.
It has already dropped 0.6C from the 2016 peak and if it was to follow the fall after 1998 it could end up around Zero.
makes Jan 2018 the 10th warmest January in the UAH data.
for the tropics, January 2018 is the = 20th warmest January (out of 40)
Andy, it is worrying that the Tropics is the Heat Engine for the Whole Planet.
SH: Jan 2018 is in 17th place
NH: the Arctic warm from the El Nino is still yet to fully subside. January 2018 is in 5th place.
A C Osborn
January 1998 was 0.48C, 0.22C warmer than 2018.
By this point after the 1998 peak temperatures were already around 0. January 2000 was -0.27C.
Actually in 1997, NOAA claimed the global temperature to be 16.92 degrees C. However, NOAA claims last year’s temperature (2017) to be 14.74 degrees C.
Third warmest year? Not hardley, as John Wayne would have said.
Nobody has given an acceptable explanation of how those changes to 1997/1998 came about.
“If it drops another 0.11C then the temp wil equal 1997”
Nonsense. Unless you are going to cherry pick individual months. The flakey running average “smoother” that Roy insists on using is a good 0.25 deg C warming than the 1997 peak.
I don’t see this index dropping below 0.3 above the ref. period any time soon. There will be persitent warmth from such a long and strong El Nino run.
No, and no.
I have the Pause at +0.138 deg., so the current +0.26 deg. is still above the Pause line. The last time the Global value was at or below the Pause line was Aug., 2015. It has been a long time above the Pause, with a huge El Nino event. So the old Pause is not coming back any time soon, if ever. Will a new pause become established at some new higher level? That is *the* question. We will just have to wait and see. (at least 10 years)
You have no data to establish such a claim.
But Tony, look at the tropics. Energy wise that is worth more then the NH since that is winter.
la niña todavía es joven
???????
What claim? About the pause coming back?
Last summer I did a “what if” calculation to see what the UAH temp would have to be over the course of two years to reestablish the Pause at the current level of +0.138 deg. The result was implausible, IMO. The temp would have to be near the coldest point in the UAH record, and *stay* there for two years. Judge for yourself how reasonable that sounds.
I did post that graph here at WUWT on one of the comment threads. Nobody commented on it at all, which was surprising to me because the question of the Pause returning always seems to be the question of the day.
Anyway, I did note that to cooling for a three year span to reestablish the Pause was more reasonable. But three years is not “any time soon”.
Well perhaps you should post it, the data and your rational for your assumption then.
Because the temperature is already lower than most of 1998 and so is the 13 month mean, the Earth has already cooled 0.5C from the peak in 2016, so it depends on how you are establishing your “trend”.
Jeager February 1, 2018 at 10:38 am
“But Tony, look at the tropics. Energy wise that is worth more then the NH since that is winter.”
That is a very important point which i was also making, there will be less warmth to transport to the SH & NH.
“the Earth has already cooled 0.5C from the peak in 2016”
I have bad eyes….but looking at the graph…looks like 0.6C
I was being conservative.
“Do we start a new pause?”
I’m sure some will. But at present January 2018 is almost exactly on the long term trend line for UAH.
How can you have a long term “Trend Line” when the Data shows Step Changes with a Known cause?
Including all that El Nino warming, that is the ONLY warming in the satellite data.
By “long term trend” I meant a linear fit across the whole data set. You can fit a straight line to any data – whether it’s a good fit is another question.
At present I don’t see any compelling reason to assume a discontinuous fit would be better. But if you prefer you could fit a zero trend line between the El Niños, in which case you would have to say that January 2018 is somewhat above that trend line.
La Nina is the only cooling. The current stutter (for 13 month mean line) is about 1 month.
I’m afraid the known cause was traditionally called the greenhouse effect 😉
It’s no good waiting for a step down unless you really have a good cause. Otoh, Hansen just did the three edged forecast warming-cooling-or-hiatusing and said the true warming could be hidden behind some natural variation. Dog ate my warming forecasted.
When we look at January temperatures of 2017 and 2018, they suggest that global, southern hemisphere and Tropics temperature decreased but northern hemisphere temperature increased. That means, change in temperature are not global in nature but they are region specific.
Dr. S. Jeevananda Reddy
As I recently predicted:
https://wattsupwiththat.com/2018/01/01/almost-half-of-the-contiguous-usa-still-covered-in-snow/comment-page-1/#comment-2707499
[excerpt]
Global Lower Troposphere (LT) temperatures can be accurately predicted ~4 months in the future using the Nino34 temperature anomaly, and ~6 months using the Equatorial Upper Ocean temperature anomaly.
The atmospheric cooling I predicted (4 months in advance) using the Nino34 anomaly has started to materialize in November 2017 – with more cooling to follow. I expect the UAH LT temperature anomaly to decline further to ~0.0C in the next few months.
https://www.facebook.com/photo.php?fbid=1527601687317388&set=a.1012901982120697.1073741826.100002027142240&type=3&theater
Data:
http://www.cpc.ncep.noaa.gov/data/indices/sstoi.indices
Year Month Nino34 Anom dC
2017 6 0.55
2017 7 0.39
2017 8 -0.15
2017 9 -0.43
2017 10 -0.46
2017 11 -0.86
Incidentally, the Nino34 temperature anomaly is absolutely flat over the period from 1982 to present – the only apparent atmospheric warming during this period is due to the natural recovery from two major volcanoes – El Chichon and Mt. Pinatubo.
________________________________________________________
https://wattsupwiththat.com/2017/11/03/what-you-wont-find-in-the-new-national-climate-assessment/comment-page-1/#comment-2655247
LT Tropical temperature should cool to ~0.0C within ~6 months.
LT Global temperature should follow ~1 month thereafter.
RH
Neither of the above. It was the 10th warmest January in the UAH record and in fact fractionally increases warming trend since 1998 from 0.074 to 0.075 C/dec.
Dropped from the warmest to the 10th warmest, but don’t you worry, CO2 is still a problem.
“In the UAH record.” Which, considering how short the UAH record is, means the “10th warmest” is not all that unusual, and is certainly not alarming.
MarkW
Not quite Mark. January 2016 was the warmest January in the UAH record. 2017 was only the 7th warmest. A similar, though more dramatic fall followed the 1998 El Nino too.
AGW is not Science
Even so, in the top 10 out of 40… hardly the onset of a global cooling apocalypse. And as mentioned above, the January figure for UAH actually slightly increases the long term warming trend in UAH by a small margin. Whether that long term trend is ‘alarming’ or not is another question.
Interesting that the Tropics have gone to a Minus value while the NH is still +0.46C, even though we have experienced a very cold January.
More heat leaving the Planet in the NH.
Heat rises?
No, cold air sinks and displaces warm air.
A C Osborn
lts because they include the Arctic in the NH temps anomaly.
Take a look at the 30 day temp anomaly map on the google Arctic sea ice page. As this clearly shows its been the Arctic where alot of the warming during January has been taking place.
Except the Satellites don’t cover it all and there are very few Weather stations there either.
A C Osborn
lf you look at the 30 day anomaly map you will notice that there has been cooling in central Asia along with the eastern side of N America. This has been due to Polar air moving down across these area’s. When this Polar air flooded south you got warm pushing up into the Arctic to replace it. So l have little doubt that there was warming in the Arctic during January and that it would have had a bearing on the NH temps anomaly.
It’s an artifact of low ice cover. Water is buffered to near freezing where as an ice surface simply plummets in temperature. So you get a warm reading with low ice which is an indicator of the energy exhaust of planet earth.
So is low Arctic ice a proxy for global heating or weather and sea currents?
I personally believe that the Gulf Stream transports more energy out of the tropics than virtually anything and it probably helps keep the seas open in the Arctic.
Is a strong Gulf Stream a sign of cooling or warming I ask?
@ur momisugly taxed.. yes, that is exactly what has happened. The Arctic is one of the spots which I watch almost daily for surface wind changes for the region. Note that recent big spike in temps which has since subsided over the last 4 days. …http://ocean.dmi.dk/arctic/meant80n.uk.php
goldminor
Yes it does show up nicely how these “cold events” over the NH can lead to a spike in temps in the Arctic.
l find a good guide to what’s going on is the Global jet stream forecast. As it shows where and when the movement of air masses is taking place.
To Don’s comment on cold air .if I boil water in a lidded pan with a good but not too tight a fit ,the build up of pressure from the steam will eventually lift the lid,&steam will exit till the pressure equalizes ,the lid then falls back &then the process will repeat (as long as heat continues to be supplied to the water.)Does this mean that the lid is lifted because cold air rushes in to displace it .?
A C, it should be interesting to see where the land data sets wind up for january. Remember uah covers the whole globe, almost. Hadcrut4 already has a very cold southern hemisphere, among the coolest temps since 2000. If the northern land data tanks too, then that would make for a very cool global anomaly. (then it’s a matter of ascertaining whether or not the nh cooling is lasting)…
Unfortunately I do not trust them to tell the truth.
Witht the Tropics, which is where maximum insolation occurs, cooling over 0.6C in less than 5 months there will not be the warmth to spread around.
What i’m saying is that even using their data, which would better reflect the cold snaps, we could see a very cool global anomaly soon. (at some point there would be no dnying cooler temps)…
Where exactly is this anomalous high temperature area of the Northern Hemisphere? We have extreme cold across North America, Europe and Russia as well as snow in North Africa. Is China abnormally warm? Somewhere else in the Northern Hemisphere?
Or just the Arctic, where there is a somewhat higher amount of open water and a severe deficit of inland temperature stations, thus requiring ridiculous infilling from marine temperatures? The raw numbers a re a load of cr@p! A deliberate load of cr@p.
John, you have to remember that the Satellites are measuring the heat leaving the Surface and doesn’t usually reflect what we experience on the surface.
The point is the heat will come back very slowly with a “quiet sun”.
Apparently the high temps aren’t in the Arctic, either. According to the Danish meteorological agency the mean temp above 80 degrees N is about 3C lower than last year.
So, where are these high temperatures? There must be people dying of heat stroke somewhere!
Sorry, A C. It sounds like you’re saying that there is heat at the surface which the satellites detect radiating away but somehow we are here and can’t detect it? You lost me.
China is cool. Look how far south the freeze line has gone, …https://earth.nullschool.net/#current/wind/surface/level/overlay=temp/orthographic=-249.82,38.02,672/loc=117.083,26.934
John, the temperature where the Satellite measures does not necessarily reflect the Tempereature underneath it, ie the jet stream is moving heat around the planet in the Atmosphere, whereas it may not be moving it around on the surface.
We continuously see a major difference in the Tropospheric temps compared to the Surface temps.
It will be interesting to see the Heat Globe to see where the Satellites think all this heat is, compared to what we have experienced.
Indeed, anomalous anomalies strike again! And everywhere where there are no people, no temperature measurements. Its all in the Arctic and the Oceans. The fact that most people in the NH were rather COLD in January is totally beside the point. UAH tends to be a little less C**p than most is not saying a lot. Satellites don’t measure temperatures they try to measure ‘stuff’ that is stuck into over-complex computer models and out pops anomalous anomalies. It is all rubbish!
The truth is, no-one has a clue what ‘global average temperatures’ are, what they are doing , what they have been. The best we have are real max and min temps from some recording stations that have been around for a long time without being moved and without being subsumed in buildings, runways etc. These are mainly in the US, UK and northern Europe. They tell us that a horizontal line is straight. If there is any very slight change its that winter and night mins are ever so slighly increasing, counterbalanced in the main by very slight decreases in summer max. Mildness is frightening don’t you know.
The heat is here in Germany for a lon time now. No Winter – just November for months.
Because the sensors in the Arctic that there say it’s really hot
So what you’re saying is that we’re having some downtrend warming.
Okay, but where does the El Nino get its heat?
Not from CO2.
http://www.drroyspencer.com/2016/01/what-causes-el-nino-warmth
It found the heat hiding in the deep oceans. /partially sarcastic
“It found the heat hiding in the deep oceans.”
Well, there’s this:
“The 2014-2017 El Nino “warm blob” was likely created, maintained, and partially recharged on two separate occasions by massive pulses of super-heated and chemically charged seawater from deep-sea geological features in the western North Pacific Ocean. This strongly supports the theory all El Ninos are naturally occurring and geological in origin. Climate change / global warming had nothing to do with generating, rewarming, intensifying, or increasing the frequency of the 2014-2017 El Nino or any previous El Nino.”
http://climatechangedispatch.com/further-proof-el-ninos-are-fueled-by-deep-sea-geological-heat-flow/
Since our US government said there was no “pause”, I’m looking more for at the “trends”.
And looking at the UAH temps since day one it appears the trend has been / is: sideways, down, up, sideways, down, up, down, up, sideways, down, up, down, up and now.. down.
I’m pretty sure the down thing is in place for a bit as the whole world is trending blue and we all know what that means. After that I’m not so sure.
You see, this is what really annoys me about the AGW scam. 0.5 degrees in 100 yrs, 0.5 degrees in 30yrs and 0.15 C in a month. Do you see the problem?
…absolutely
And 10 degrees overnight. But remember that measuring in different places in the garden yields results that are several degrees away from the official readings read 8 am at the airport.
Hyping 0.2 degrees per decade is not so intelligent.
It’s the committed warming of 9 degrees that our children should be taking pressure. / sarc
Am also expecting this month’s temp anomaly to come in lower as well. As l expect to see lots of cold air flooding down over N America for at least the next 2 weeks. To a lesser extent l also expect to see this happening over northern and central Russia as well. Plus l also expect the mid eastern Pacific will remain cool over this month as well.
Well it ain’t up like they said it would…
So is it cool enough yet for me to come out of my bunker?
Without the “SatanicCO2 Meme” the scientists will run out of things to research methinks.
Meanwhile they need to keep a close eye on the domestic consumption of sandwiches as there appears to be a clear correlation. /?
Perhaps we should all pause to reflect that the chaotic nature of the climate system cannot be dragooned into prediction by the use of linear equations and statistical manipulations. Proving negatives is a fool’s activity.
Perhaps I am getting very cynical; although still interested in the remarkable technical tools now available. Just wish there be more common sense with brains extracted from computer data.
Straws mate, jail time in Cali for serving straws with a drink.
On trend overlaid by noise: https://tamino.wordpress.com/2018/01/31/global-warming-the-relentless-trend/
Multiple temperature indices with ENSO, volcanoes, and solar variation removed: https://tamino.wordpress.com/2018/01/20/2017-temperature-summary/
Adjusted data for all the land based datasets and now also RSS, sorry that just doesn’t cut it any more.
And how, pray tell, does one remove solar variability when it isn’t known?
Don’t they usually use sun spots as a proxy? More sun spots means a more active sun.
(yes, but we have no idea what its effect is on temperature)…
Obviously, the method is described in the article that is linked from the blog post I pointed to. But you do need to skim the blog post, then click that link, then read that article. If you can’t understand the method, you should ask on that blog post for explanation of the parts you don’t understand. http://iopscience.iop.org/article/10.1088/1748-9326/6/4/044022/meta
Tamino…….. roflmao !!
Non-science propaganda pap, at its worst.
Such a palava over one month’s figures? Sceptics grinning from ear to ear? Last month the warmists were dusting off their jackboots. The difference? o,15 degree C. All rather silly. Calm down, lads.
Solar activity may have a role but ‘the concuss’ says it doesn’t.
Sunspot numbers went down a bit in January. The old historic Wolf’s SSN is around 4 points while the new ‘corrected’ SIDC number is at 6.7, corresponding 2017 annual numbers are at around 13 and 21.7 down form 23 and 40 in 2016.
Composite graph is here
SC24 is nearing what might be the start of a prolong minimum with a possible late start of SC25.
The Dec 2017 – Jan 2018 lower troposphere temperature change was -0.15C. If a similar drop occurs in the Jan – Feb 2018 span, we are right back on the ‘no global warming’ zero slope trend line extending from 1997. That is a useful ‘club’ to metaphorically thump the AGW protagonists about the head and shoulders with… but it’s still just temperature wiggle watching to a rational mind.
A C Osborne said:
Due to unprecedented unpopularity, here is my “What If” graph of UAH to reestablish the Pause.
{click to embiggen}
I have the Pause running from May, 1997 through Dec. 2015, with a value of +0.138 deg.
The “What If” question is what does UAH look like for the Pause to reestablish within 24 months. I simply extend the data set by 24 months and add a value such that the usual LLS regression line from May 1997 to the present has a slope of .LT. or .EQ. 0.0 deg.
The value I found according to this criteria is -0.11 deg. I note that this has to be the *average* for the entire 24 months. To me, it seems *possible*, given a strong cooling, but it does not really seem plausible. The temps would have to undergo one of the largest drops in the record, and then stay there for 2+ years.
The mathematical nonsense of calculating linear trends through transient events is thus established. 🙂
TonyL, actually all you need to do is wait five years until they adjust recent temperatures down. If you think that is a bad way to do science then take it up with Gavin the Schmidt and his adjustment henchmen.
So, despite what has happened in the past you don’t think the temperatures can drop below -0.1 for very long.
OK.
“*possible*, given a strong cooling, but it does not really seem plausible. The temps would have to undergo one of the largest drops in the record, and then stay there for 2+ years.”
This is difficult not to agree with. Is a super-duper La Nina possible? Yes I suppose it is. But then that is also just a transient fluctuation; the steady, longer-term trend cannot be caused by the ENSO circulation.
AC Osborn, not really possible with the +AMO.
I have the Pause running from May, 1997 through Dec. 2015
Tsk Tsk TonyL. Your side of the debate first said that a pause was impossible, then came up with dozens of explanations for it, then Karl adjusted the Argo bouys and claimed there never was a pause. You’re one meme behind dude.
????????????
My side of the debate?? My Side?
Since when have I said anything even remotely warmist?
I just present the UAH data and some speculation, and everybody gets on my case about it.
Are you guys all grouchy because of the influence of the full moon or something?
You are confusing TonyL with Toneb
Toneb is the alarmist
@ur momisugly Alan Tomalty
Yes, I think that is what happened. Thanks for the suggestion.
I always thought there were too many Tony characters running around this place.
I still think davidmhoffer is grouchy because of the full moon.
Richard M
I ran UAH forward with a monthly average of 0.14 C to see how long it would take for a ‘pause’ (zero trend to 2 decimal places) starting in 1998 to re-establish. It would take until February 2030.
DWR, you have just demonstrated (with the crystal clarity that you alone possess) just how farcical your definition of the pause is…
TonyL is one of those “cooler heads” which we are told always prevail!
If the trend were to stabilize around the .14 C value over the next few years then I think rational folks would realize this was an extension of the pause. It wouldn’t make the long term trend perfectly flat but really shouldn’t matter. That is just a timing issue.
TonyL,
Your observation about a return of the pause is mathematically correct but scientifically of little relevance. If GSAT returns to values prior to the 2014-2016 El Niño (+0.15 in UAH graph) and remain there or below for over 4 years, then El Niño had a transient effect on temperatures and the pause, defined as a period of insignificant net warming, never went away. So it is all down to how you define the pause.
The 4 year period is because ENSO events can last for a couple of years and be followed by a correction that can last another two. We have to discard the possibility that a La Niña, following the 2014-2016 El Niño, is responsible for a compensating transient downward spike.
I am personally convinced that the pause is linked to the Eddy extended solar minimum and the 60-year oscillation whose period is tuned to solar cycles. Therefore it has not gone away and will remain with us until at least 2035. Temperatures might actually go down a bit (~ -0.2° C below 2003-2013 mean) over the next 15 years. Time will tell. If I am wrong global warming should accelerate over the next decade instead. But just in case, Hansen and Schmidt are joining me in their predictions. Hilarious.
Javier, gotta disagree that tonyl is mathematically correct… Once temps return to that anomaly at which temps have been stuck at, the pause is back. AndyG nails it (once again): if what tonyl is saying is correct, then the timing of the return of the pause depends soley on the magnitude of the transient event (this case being el nino). In fact, we could see temps drop below the anomaly of the pause for an extended period of time without tonyl’s pause even returning. (i think this is a case of eggheads being stuck in the sand)…
Afonzarelli,
A linear trend is very affected by having a big deviation near one of the extremes. The influence of 2014-16 El Niño will affect the trend positively until it is in the middle of the period considered, and it will affect the trend negatively once it is in the first half of the period considered. This is basic mathematics and needs to be understood when discussing what the trend really represents.
If and when Arctic ice max returns to levels approximating pre-1980 we will feel the effects of winter weather coming off of Arctic ice instead of Arctic marine conditions. This will make discussion of “pauses” irrelevant as we deal with crops lost to frost and wicked winter conditions penetrating farther South.
The Arctic loses heat during the long winter night. The more open water there is, the more heat it loses. The more heat it loses the cooler the sea becomes and the more ice grows, reflecting more heat back to space when the sun returns North.
Virtually ALL of the high temperature anomaly globally is represented by the Arctic anomaly. This is nearly ALL a result of the open water present-which is mainly a function of ocean surface temperature- not air temperature.
Ocean surface temperature is a cyclical and natural condition. The only things which can effect Arctic heat loss rates are:
Albedo- High ice extent acts to reinforce summer heat loss (or retard summer heat gain), extending the high ice extent portion of the cycle. High ice extent also reduces the heat loss from the ocean surface which allows the slow warming of the ocean until ice extent and thickness are not sustainable.
Low ice extent acts to reinforce the high summer heat gain portion of the cycle. This exacerbates the warming of the ocean surface temps and extends the low ice extent portion of the cycle. Eventually the higher rate of heat loss from open water cools the ocean surface and the growth of ice extent begins again.
Clouds- Low ice extent may mean more clouds and warmer winter temps but low air temps probably mean this is not so relevant. High ice extent would therefore mean less cloud and the increased albedo would have a clearer path to space.
All reinforcing lags in a natural cycle. This is why it takes 30 or even 60 years to repeat. It takes that long for the Arctic ocean to warm or cool by whatever the balance point difference is. 1C? 7 An actual tipping point!
The big deal if one can call it that is that the effect on temperatures in the Northern Hemisphere is somewhat greater. Not seriously significant but ‘sh!t your pants” for the AGW crowd!
We should be studying this because when the next glaciation starts it will be because something has happened to cut off this cycle and prevent the Arctic ocean from accumulating that critical little bit of heat in its high ice extent phase. Then we really will have something to worry about.
Your chart looks exactly what I did with one or two exceptions. I refined the data into annual averages. I also did a statistical test to determine if the average did change (which it did), then tested to see how good a fit the linear trend was to the data (it really wasn’t). The primary error points occurred in 1998 and 2016. So the linear trend is not very robust.
However, you do have no significant evidence of a change in the average from 1979 to 1997. That is 18 years. You also have no evidence of a change in the average from 1999 to 2018. The year 1998 is an outlier. That would indicate some type of significant event.
So other than 1998 you basically have two plateaus with a greater than zero chance of some type of shift in 2016. The magnitude of differential between those two plateaus is a bit less than .25°. That really puts the entire thing into perspective. At less than .25° you are talking zero significance. What is the measurement variability and accuracy? You have no idea. You know it is greater than zero. The only question is what is the upper bound on measurement variability? How would you even measure that when by definition a temperature measurement is a one time event. It cannot be replicated at a different lab or against a known standard.
Less than 1/4 degree is arguing over nothing. When compared against the inherent day to day, moment by moment variability of even a single location with controlled conditions and rigorous quality checks it is basically zero.
The growth in atmospheric CO2 is also down at around 2 ppm/year, following the temperature, and in spite of human emissions from fossil fuels and industry reaching a record high of 37 Gt CO2/year (4.8 ppm/year) in 2017.
http://www.woodfortrees.org/plot/esrl-co2/mean:12/derivative/scale:12
The NOAA growth reported for 2017 is 2.1 ppm (it will be finally corrected with the March value, probably downwards).
So, the airborne fraction is continuing its downward trend – the consensus prediction was that the sinks would saturate and the AF would increase.
The emissions:
http://www.woodfortrees.org/graph/plot/esrl-co2/from:1985/mean:24/derivative/plot/hadsst3sh/from:1958/scale:0.25/offset:0.1
Ed, the carbon dioxide growth rate has been following the temperature of the southern ocean since the inception of the MLO data set sixty years ago. As you can see, those sst temps have dropped like a stone. If temps stay down and the growth rate stays down with them, there will be a whole lot of splainin’ to do. Keep your eye on those southern hemisphere SSTs and watch what happens…
http://www.woodfortrees.org/graph/plot/esrl-co2/from:1958/mean:24/derivative/plot/hadsst3sh/from:1958/scale:0.25/offset:0.1
(sorry about the graph, ed)…
“So, the airborne fraction is continuing its downward trend” which is a disaster for life on this planet.
Fire-up the coal generator we need some CO2!
And no I’m not being sarcastic, life on this planet needs much more CO2 to thrive.
This might be why the growth rate of CO2 is not behaving as to plan:
http://astroclimateconnection.blogspot.com.au/2017/07/pro-tip-tin-foil-hat-alarmists-tilt.html
To see where we are relative to the current cooling trend see this earlier comment on WUWT https://wattsupwiththat.com/2018/01/30/what-are-in-fact-the-grounds-for-concern-about-global-warming/#comment-2730286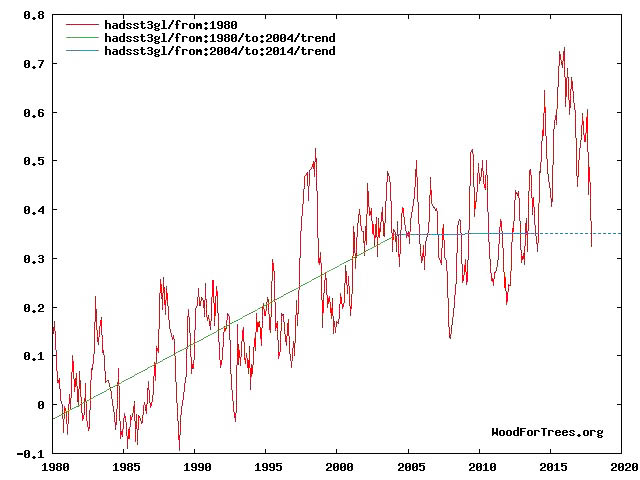
Here is the last graph in that comment
The latest SST data shows temperatures below the pre El Nino trend
Well said Dr. Page.
Seven of the 11 years between 2004 and 2014 had negative ENSO values as they were affected by natural cooling caused by La Nina conditions. So it’s not surprising that you get a flat sea surface temperature trend over that period. Using 2004 as the start of your trend (why not a longer period?) is another example of counting the natural cooling but excluding the natural warming variations.
DWR54 See Comment at https://wattsupwiththat.com/2018/01/30/what-are-in-fact-the-grounds-for-concern-about-global-warming/#comment-2730749
2004 marks the millennial cycle temperature turning point with a 12/13 year delay from the solar activity peak at 1991.
Fig. 10 Oulu Neutron Monitor data (27)
Because of the thermal inertia of the oceans there is a varying lag between the solar activity peak and the corresponding peak in the different climate metrics. There is a 13+/- year delay between the solar activity “Golden Spike” 1991 peak and the millennial cyclic “Golden Spike” temperature peak seen in the RSS data at 2003 in Fig. 4. It has been independently estimated that there is about a 12-year lag between the cosmic ray flux and the temperature data – Fig. 3 in Usoskin (28).
SST Anomaly Time Series.
Meanwhile, in 1984 land:
https://www.wired.com/story/guide-climate-change/amp
Good grief mainstream academic/press/United Nations etc… propaganda is relentless
So if the chart was showing the value of your financial investments, would you feel the values were rising or falling over the last 40 years ?
Falling, as it would not be keeping up with inflation.
Gareth, you have invited us to take a financial analogy , so lets do it .
The global mean temperature of the Earth is 15C or 288K. The increase in 40 years( the length of the average working lifetime) is of the order of 0.4K ,ie if that was a financial investment at the start of my working life , then my investments would have accrued all of 0.14% by the eve of retirement.
I would then have wished I had picked a better financial advisor .
The question is rising or falling?
The answer is statistical signifigance
mikewaite
Two points:
1. The reason Celsius is preferred to Kelvin when considering average global surface temperature is because Celsius is a much better calibrated scale to describe the important changes that relatively small variations can create.
For example, during the ‘Little Ice Age’, Northern Hemisphere temperatures are estimated to have been ~0.5C below pre-industrial on average. In Kelvin that’s a difference of just 0.18% (272.5K versus 273K); yet it was sufficient for the whole period to be called, well, ‘The Little Ice Age’. The peak of the last glacial maximum was about 1.5% cooler than modern temperatures on the Kelvin scale! Clearly small variations in temperature matter when global average surface temperatures are concerned.
Using Celsius basically resets 273K as zero C for very practical reasons. It’s more useful as a guide to meaningful global temperature change than K is for the reasons described above. Using C as the base then, and applying your interest analogy, over the past 40 years global average surface temperature has increased from ~14.3C to ~15.0C; an increase of about 14%. I think we’d all keep a financial adviser who earned that return.
Sorry, my second point was that total surface warming over the past 40 years is in the order of 0.7C (or K), not 0.4. That’s where I derived the 14% increase figure from.
The chart speaks for itself, but left out of consideration is what does CO2 have to do with what that chart shows. Given that since 1998 around 35% of the total human generated increase of atmospheric CO2 was produced. What was it that CO2 was supposed to be doing?
Alternatively, the chart shows that you should have cashed out somewhere in 1997/98.
I wouldn’t be using an anomaly based on 30 year averages but whether the value had actually gone up. And whether it had gone up by a meaningful amount. On that basis I would say meh.
President Trump is making climate great again!
(no, he’s making weather boring again… ☺)
Except for the El Nino pops, the whole recent so called ‘global temperature’ is within the REAL statistical margin of error.
But it is fun arguing over the exact length of the unicorn’s horn even when you know that they have photoshopped the old pictures of them to make their horns look shorter.
This a crock! There is NO “global” warming. All we have is Arctic Warming. The rest of the globe looks pretty tame. I like dr Spencer … but … I’m not sure they have this arctic thing down yet. Simply no way that the arctic is running away.
The slight warming in the Arctic is causing havoc again with the polar bears, when will the poor buggers ever get a break : https://www.theguardian.com/us-news/2018/feb/01/polar-bears-climate-change
Having just returned from Mongolia, I can attest to the below average temperatures in that area. It was so cold in Yakutia in January that 70 people lost limbs to amputation for frostbite in one event two weeks ago when the temperature dropped to -68 C. Photos show frost collecting on people’s eyelashes, water vapour from their warm eyes frozen only 5mm away.
Ulaanbaatar was stunningly cold and windy.
That is pretty harsh.
Not as cold as East Antarctica in 2010 when temperature dipped to -94.7C
https://www.theguardian.com/world/2013/dec/10/coldest-temperature-recorded-earth-antarctica-guinness-book
Gah! At -78°C the CO2 starts to freeze out.
No, the partial pressure of CO2 isn’t high enough for CO2 “snow.”