Guest Post by Willis Eschenbach
I got to thinking about the records of the sea level height taken at tidal stations all over the planet. The main problem with these tide stations is that they measure the height of the sea surface versus the height of some object attached to the land … but the land isn’t sitting still. In most places around the planet the land surface is actually rising or falling, and in some places, it’s doing so at a surprising rate, millimeters per year.
The places that are the most affected, unfortunately, are the places where we have some of the longest tidal records, the northern extra-tropics and northern sub-polar regions. In those sub-polar regions, during the most recent ice age, there were trillions of tonnes of ice on the land. This squashed the land underneath the ice down towards the center of the earth … and as result of that, just like when you squeeze a balloon it bulges out elsewhere, the extra-tropical areas further from the North Pole bulged upwards in response to the northern areas being pushed down.
Now, of course, other than scattered glaciers all of that ice is gone. With that weight removed the land is now experiencing the reverse effect. This is called “post-glacial rebound”, or PGR. The effect of the PGR is the reverse of that of the ice—northern areas are rising and mid-latitude areas are sinking. So when we look at long-term records from northern Europe, for example, the land is actually rising faster than the sea level … and as a result, the tide gauges there are recording a sea level fall rather than a sea level rise.
The issue comes up when we want to know how fast the sea level is rising, both now and in the past. Unfortunately, most tide gauges around the planet don’t have co-located GPS units capable of measuring the altitude to the nearest millimeter…
Me, I’m not that interested in exactly how fast the sea level is rising. I’m much more interested in whether that rate of sea level rise is speeding up. For three decades now climate alarmists have been predicting an imminent acceleration in the rate of sea level rise that is supposed to drown whole cities by 2100, the usual Chicken Little scenario. However, I’ve not seen any convincing evidence for that claimed acceleration.
My thought about how to investigate the purported acceleration was simple. I’d get every one of the tide records, the most recent I could find. These are kept at the Permanent Service for the Mean Sea Level, or PSMSL. They are obtainable individually here or in bulk here. As the curators recommend, I used the RLR version.
Then I’d detrend them all. That would remove any post-glacial rebound. The PGR, whether slow or fast, doesn’t change much in a couple centuries. So detrending would set the PGR to zero. This would allow me to look at the average shorter term multidecadal variations in sea level. I would average the records, and see what kind of acceleration I might find in the results.
I thought about this while reading GLOBAL SEA RISE: A REDETERMINATION, by Bruce C. Douglas, available here. In it, he averages a subset of the 1509 stations after adjusting them for post-glacial rebound (PGR). However, he’s picked a tiny subset, only twenty-four stations … out of the more than 1500 tide stations available worldwide. Hmm … seemed like a very small sample.
So I thought I’d take a look at some other subsets of the tide station data. I decided to filter based on a couple of criteria. One was that I wanted to have long records. So I started with a hundred years minimum. No particular reason, it just seemed like a good place to start.
The other criterion was that I wanted them to be mostly complete, with little missing data. I started with the requirement that they be ninety percent complete. I expected that I’d find only five or ten such stations around the globe, but to my surprise, I found that there are no less than 61 tide station records that meet those criteria.
Following the usual method, I took the “first differences” of these individual sea level records. This is the change in the data over time. Since we have monthly data, the “first differences” in this instance are the month-to-month changes in the sea level for each tide station.
Then I averaged those first differences, month by month. Finally, the cumulative sum of that average of the first differences reconstructs (in theory) the average change in sea level height.
Figure 1 shows the result of that procedure. Remember that this is detrended data. I’m not looking at the trend. I’m looking at the decadal and multidecadal variations within the overall record, to see where the trend changes.

Figure 1. Averaged sea level. The average was taken as the cumulative sum of the month-by-month average of the individual station first differences. No standardization of standard deviation was performed. The yellow line is a six-year centered Gaussian smooth. I put the ocean in the background because … well, because I got bored with plain white, plus … it’s the ocean …
OK, nothing much surprising there. Yes, I know I haven’t made any effort to do a gridded or other geospatial average … but I find that for first-cut investigations the differences aren’t worth the programming time. That can come later to refine the results. First I want to take a broad view and come to an overall understanding of the oddities and the outliers and the overall style and substance of the dataset.
Now, in Figure 1, sixty-one records is not a whole lot. So my next thought was to reduce the completeness threshold a bit. I decided to look at all the hundred-year-long records which contain at least eighty percent data, instead of ninety percent. That increased the station count from sixty-one to seventy-one. And the result was what I love the most about science … a big surprise.

Figure 2. As in Figure 1, except only requiring 80% data instead of 90% data.
Dang-a-lang, sez I, say wut?!? … and I went off to find the fault in my computer program that extracts the data and draws the plots.
However, when I couldn’t find anything wrong with my program, I realized that the answer had to be somewhere in the ten additional stations that were added in between Figure 1 and Figure 2. Here are those ten stations:

Figure 3. The ten stations which were added to the subset between Figure 1 and Figure 2.
You can see the problem, I’m sure. What is going on with the tide record from the Manila South Harbor? So I pulled Manila South Harbor out of the mix … which led to big surprise number two.
Pulling out the Manila record made no particular change. The result still had the big drop seen in Figure 2.
After much faffing about, I finally determined that the miscreant was actually Trois-Rivieres, which is certainly not obviously different from its compatriots. It’s second from the bottom left in Figure 3 above, looks like the rest … except in size. I’d made the mistake of not paying attention to the different scales. Here’re the same ten stations, but this time all to the same scale.

Figure 4. As in Figure 3, but with all stations shown at the same scale.
In this view the problem is evident. We’re doing a “first differences” analysis. But that weights the data in some sense proportional to the stations’ standard deviation, how much it swings from month to month.
Setting that question aside, however, the surprising part to me was the large effect of one single record among 71 others. One bad actor in the lot totally changed the whole average … and it brings up a question for which there is no “right” answer.
How do we deal, not just with this instance of Trois-Rivieres, but with the more general underlying problem that the month-to-month variations in sea level are of very different sizes at different tidal stations around the globe?
Do we scale them all to the same standard deviation, to give them all equal weight? Or as in this case, is it valid to just heave Trois-Rivieres overboard and continue the cruise? Hang on, let me get a histogram of the standard deviations so we have some information. The standard deviation is a measure of how wide the swings in the data are … I’m writing this up as I work my way through the issues, so you can see how I go about understanding the dataset. Here’s the histogram of the standard deviations:

Figure 5. Histogram of the standard deviations of 1,509 tide stations.
OK, that’s a problem for this kind of analysis. This shows a bunch of stations with standard deviations over say 150 mm … and as we saw above, to my surprise, just one wide-swinging station can poison seventy other stations. So any analysis will be dominated by the widest-swinging datasets. Oooogh. No bueno.
As I said above, there’s no “right” answer to this question. About all that I can see to do is to set them all to the median standard deviation, which is about ninety mm. This gives them all equal weight and also makes them comparable to the raw data. Figure 6 shows the same 71 hundred year plus stations as in Figure 2, but this time after they’ve been set to the same standard deviation. Note that Trois-Rivieres is no longer dominating the results.

Figure 6. Averaged sea level. The average was taken as the cumulative sum of the month-by-month average of the individual station first differences. All first difference station data was set to a standard deviation of 88 mm before averaging the first differences.
I think that’s about the best I can do. I say that because I’m interested in decadal and multi-decadal changes … and there’s no reason to assume that tide stations with large month-to-month swings are more representative of those multidecadal changes than any other stations. With no theoretical reason to prefer one group of stations over another, I can only give them all the same weight.
(Upon reflection while writing up my investigations, I just now realized we might also find interesting results by using a yearly average of the data. At least this would get rid of the month-to-month variations … but at the cost of throwing away some data. So many possible analyses, so little time … I return to the current analysis).
Now, I mentioned that I was led to look at this by the Douglas re-examination of sea level changes. So I thought I’d take a look at the twenty-four stations he used. Here’s that result. All the stations have similar standard deviations, so I’ve not made any adjustments. Unlike my own analysis these are not detrended. In addition, the trends have been adjusted for post-glacial rebound using the data from the Douglas paper.

Figure 7. Stations from Douglas GLOBAL SEA RISE paper. These stations have been adjusted for PGR using the data in the cited paper. Note that these have not been detrended.
Hmmm … I’m not seeing any reason to prefer that Douglas subset to any of the others. It is different from any of the others that we’ve seen in that there is a clear acceleration in the rate of rise around 1970. This has not been visible in any of the other datasets. However, my main objection is the tiny size of the sample, only 24 stations.
According to the cited Douglas paper, among other requirements, to be usable the individual tide station records should “be at least 60 years in length” and be at least “80% complete”. Here’s the subset of the 1,509 records, the 235 stations that fit those two criteria.

Figure 8. Averaged of detrended sea levels, sixty year + datasets with eighty percent data. All datasets have been standardized to a standard deviation of 88 mm. This is the median standard deviation of the full 1,509-station dataset.
That’s not much different from the hundred-year-plus dataset shown in Figure 6. Let’s see what happens when we reduce Douglas’s required length of sixty years down to say forty years …

Figure 9. Averaged sea level, forty year + datasets with eighty percent data. All datasets have been standardized to a standard deviation of 88 mm.
As you can see, once there’s very little difference from adding the additional shorter-length station records. Figure 6 shows hundred-year-plus records, only 71 stations. It differs only in the smallest details from Figure 9, which shows forty year plus records and averages 500 stations.
However, there is a final perplexitude. So far, we’ve been looking at records with 80% of the data … but what if we make the requirement stricter? How about if we require that ninety percent of the data be present? It turns out that, just as with the eighty percent criterion, the results at ninety percent look quite similar at records lengths from forty to a hundred years … but the oddity is that they do not look like the eighty percent records.
Here are all the sixty year plus records with ninety percent data, 193 stations:

Figure 10. Averaged sea level, sixty year + datasets with ninety percent data. All datasets have been standardized to a standard deviation of 88 mm.
As you can see, Figure 10 is similar to the eighty percent data shown in Figure 9 in that it has the high point at the start. It’s also similar in the range from about 1875 to about 1920.
From 1920 to the present, however, the eighty percent complete records go up in a pretty straight line … and the ninety percent complete records go down, again linearly. Who knew?
So, after that voyage through the 1,509 records, what can we say? Well, we can’t say anything about the trend, because we’ve been using detrended records. Heck, we can’t even say whether there was a change around 1920, because the records with eighty percent data say yes, the rate of rise increased around 1920 … but the ninety percent records say no, there was no change in the rate around 1920.
However, something that we can say is that the one and only subset I’ve found that shows any recent 20th-century acceleration is the extremely small 24-station subset used by Douglas. It claims that there was an acceleration in the rate around 1970 or so.
All the other subsets we’ve looked at agree, eighty and ninety percent data alike, at all lengths from forty years plus to a hundred years plus. They all say that there has been a uniform gradual sea level change since around 1920, a change which has varied little over that time. In detrended terms, some subsets say it went up since 1920, some say it went down since then.
But not one of them show any recent acceleration in the rate of sea level rise.
In other words, despite thirty years of alarmists telling us that the seas are going to start rising at some accelerating rate any day now … there is no sign of that predicted acceleration in any of these subsets of the detrended tide station records. Of course, this doesn’t prove anything, you can’t prove a negative. However, it joins all the other evidence out there showing no recent acceleration in sea level rise.
My final thought out of all of this is that the sea level data from the tide gauges around the world is very sensitive to the exact selection of the subset of stations used in any analysis. There are differences even what I would have thought would be a trivial change in cr, say between eighty and ninety percent data for all stations over sixty years in length, which only went from 193 stations at ninety percent data to 235 stations at eighty percent data. And despite the fact that both groups contain datasets with what we would call good coverage, and despite the two datasets having over 80% of the stations in common … despite all of that, changing the requirement from eighty percent complete to ninety percent changes the overall change in trend since 1920 from rising to falling …
So I’d say the takeaway message is, be cautious in claims regarding the sea level rise speeding up. I’ve looked a lot of places for acceleration without finding any sign of such an increase in the rate of sea level rise, and this latest peregrination through the tidal data has only strengthened my skepticism about any claims made about the global sea level. It’s just too dependent on the methods used and the choices made to give me any sense of solidity.
Here, I’m very happy to be back from my Solomon Islands adventure. Before I left I had just finished building a large patio here by our hillside home. I rented a backhoe, bought a few pallets of blocks and bricks, and started digging and filling. Then when the rough backhoe work was done … shoveling. And more shoveling. What in a less politically correct time we called “Playing the Swedish banjo”. Here’s a shot halfway through the process with the downhill retaining wall in but not the uphill wall, featuring my weapons of mass construction, a McCloud and a couple shovels, plus my hand grader (a board attached to a rake) at the far right …

Once the level spot was made I had to decide how to treat the flat surface. I decided to brick it in. My artistic vision was to make what would look like a river of bricks running out from under our house to a pool, of brick of course, and then flowing out from that brick pool over the rapids at the far end of the patio where the retaining wall stops.
And here’s how it looked shortly before I left, with my gorgeous ex-fiancee tending her beloved plants …

And finally, here it is this lovely warm December morning upon my return, with verdant, insistent nature starting to push up through the spaces just like I’d hoped … I plan to let it grow and periodically mow it short.

So, propped up against the south wall of our house, enjoying the physical realization of my vision of a river of bricks, and smiling like an idiot up at the sun, I remain,
Yr. Obt. Svt.,
w.
PS—Please, folks, when you comment I ask you politely to QUOTE THE EXACT WORDS YOU ARE DISCUSSING. I can defend my own words. I cannot defend your understanding of those same words. Without the quotation, I often have no idea what you are referring to. I know it’s perfectly clear to you … but on this side of the screen, it is often a total mystery just what it was that I said that someone thinks they are referring to. So do yourself and all of us a favor and quote before replying, so we can follow your logic and comprehend your argument.
Finally, no, generally I don’t remember what I said in some discussion with you six months, six years, or often even six days ago. I’ve written over six hundred posts for the web, many of which have engendered long and complex discussions with a huge number of people, with most of the people using fake names. I make no attempt to remember who said what, or what I said. Instead, I simply do my utmost to tell the truth as best I understand it at all times so I don’t have to remember all the trivia—if I need it I’ll look it up.
So please, if you’re going to say anything resembling “But Willis, you were wrong last time when you said that …” to me or anyone, please follow that with a quotation of the exact words that were said. NOT what you remember about those words. NOT what you’ve understood those words to mean. THOSE EXACT WORDS!
Thanks,
w.
DATA: The data in the PSMSL archive is in a horrible format, with a separate file for each station with individual start and end dates. I’ve combined them into the normal data block, stations in columns, times in rows, as a zipped CSV file here. So … if you have questions about the results or you think I should have done some other kind of analysis … the ball’s in your court. Drop the CSV sea level data file into Excel or your favorite program, do the analysis you think I missed or messed up on, and let us know what you find out.
Separate comment from accelerating SLR. Man, that was a lot of leveling/paving stone work you did. Made me tired just thinking about it. Nice job. In Wisconsin on my dairy farm, we have to use all that energy laying in firewood to heat in winter. Not much energy left for anything else. so we have just gravel the acre plus barnyard in two grades, breaker and crusher run. The tractor with 7 foot grader blade levels it sort of out sometimes, and occasionally (like every 3-4 years) we have to bring in more dumptruck loads. Poor mans solution to your rich (figuratively and spiritually) mans beautiful result.
Thanks, Rud. The tractor work was quick doing the excavation of the notch on the hill and putting it down below.
After that, it took me a number of months over the summer doing just a bit a day. My saying for this kind of work is “At least it’s another tile in the mosaic …”.
I work at not thinking about how many bricks and blocks that it will take to get to the end. I just focus on one tile at a time, and take joy in placing it just right … the whole job took me over six months.
Best to you and yours,
w.
So it appears that the primary difference between Douglas’s trends and yours is that he includes post-glacial rebound (PGR) and you don’t. But (IIRC) PGR was quantified using sea level as a metric — I don’t have the citation. If so, then Douglas is using a “degenerate” procedure, which is to say, sea level and PGR are interdependent so you can’t treat them as orthogonal to draw conclusions about one or the other. That’s my first take on it, anyway.
Also, elevation is an alias for gravitational scalar. Where the Earth varies from perfect spheroid, the “elevation” becomes a matter of convention. The presence or absence of miles-thick ice sheets deforms the Earth’s shape away from spheroid. Lots of tweak-room there, maybe they’re solving for it beautifully, I don’t know, just mentioning it as relevant.
With a such beautiful place and beautiful ex-fiancee, what the Hell are you doing messing with trying to educate us, the unwashed? I’d be heels up next to the pool trying to figure out whether I liked Corona or San Miguel better and not worrying about anything else. I’m starting to think you are not as smart as I think you are.
William Grubel
It’s a sickness … and a joy. Mostly I love the surprises when I do the research, that’s the fun part. The rest is good too, though, even the bad parts where I’ve made some error or mistake. The good news is, mistakes and errors don’t survive long at WUWT. So it is indispensable in my work to publish here, it has saved me heaps of time following blind alleys based on my own foolishness …
w.
It should be noted that:
“Tide gauge data is worthless for determining Global Sea Level and/or its change unless it has been explicitly corrected by on-site CORS-like GPS reference station data capable of correcting for vertical land movement. Since the current standard for Tide Gauge data, the PSMSL GLOSS, is not corrected for vertical land movement, all studies based on this uncorrected PSMSL data producing Global Sea Level Rise findings of any kind — magnitude or rate-of-change — are based on data not suited for the purpose, are not scientifically sound and do not, cannot, inform us reliably about Global Sea Levels or Global Sea Level Change.”
Vertical land movement is not the simple result of “post-glacial rebound” — most tide gauges are attached to piers, quays, docks, and other structures built at the juncture of the sea and land — almost always land that consists of fill — and land that is mud. Dockland subsides — it does not subside evenly over a hundred years.
Only a few lucky sites, such as The Battery, in NY City, are firmly mounted on bedrock — the rest ooze and sink into the mud, slowly or quickly.
No tide gauge data not expressly corrected with an on-site, same structure continuously operating GPS reference station should be consider for use for anything other than determining local relative SLR.
There are other things that impact ground level. Such as drawing down an aquifer or pumping out oil.
kip, see my 2016 guest post on SLR, acceleration, and closure. This is not new news.
ristvan ==> Certaintly isn’t new news — I wrote about here, you wrote about it, the PSMSL writes about it.
Anyone who seriously considers Sea Level Change knows about it and the technological improvements needed to use tide gauge data for global analysis.
Kip, thanks for the reply, but I fear that quoting yourself without attribution, as though you were quoting some independent authority agreeing with you, doesn’t impress me much …
In addition, I’ve looked at heaps of tide station records. The overwhelming majority of them don’t have some kind of kink in them where e.g. dockland “does not subside evenly”. Not saying it doesn’t happen. Just saying it’s not all that common.
To confirm this, I just took a look at the Levelling Connections for 21 tide gauges in Australia … and I didn’t see one GPS record that is anything like what you are claiming, where the settling is not even. The majority of them don’t change in elevation by a single mm in two decades … so no, I reject the idea that the majority of tidal stations are useless because they are on land which is settling unevenly enough to be significant.
w.
willis ==> :eveling is an entirely different subject. The use of “nearby” (which can mean 15 kms) GPS stations is not meant to nor does it capture subsidence of the structure to which the tide gauges are attached.
This is not my opinion, but the opinion of the PSMSL group — which has a program to accomplish this in order to finally be able to use the tide gauges for determination of global sea level changes.
See mine here.
willis ==> You can read about the need and the plan in the PSMSL’s GLOBAL SEA-LEVEL OBSERVING SYSTEM (GLOSS) IMPLEMENTATION PLAN – 2012.
The attempt to use leveling techniques is a stop-gap measure simply because it is better than nothing. In reality, both PSMSL and NOAA fully acknowledge that truly useful data will not be available until there are enough high quality tide gauge stations matched to same-structure continuous GPS reference stations that have been running long enough — 3 years is usually cited — to reliable correct for Vertical Movement of the tide gauge itself.
Thanks, Kip. I agree that visual levelling is not the best, but it is way better than nothing. And yes, you are correct that we need continuous co-located GPS stations to get the final answer.
w.
willis ==> And the good news from the Sea Level field is that, unlike other aspects of climate change science, the Sea level people (at least the professional groups) know this and are actively working to make it possible to have correct and usable data.
Once there is a large enough network of tidge gauges linked to co-located (same structure) Continuous GPS stations, they still will only end up with very good local relative sea level data — we will be able to know what sea surface height is doing at each location.
As the satellite data has revealed, the sea rises and falls differently in different places — some rising, some falling, all at differing rates.
Turning that data into a “global average” will be a complex, complicated technical chore and may, in the end, still return a number that represents something other than how much and how fast the volume of water in the oceans is changing.
Summary: It ain’t easy.
Tru’ dat, Kip, it ain’t easy.
Thanks,
w.
Kip, a further note. You say to be useful a site must be:
This is not entirely true. Actually, in the field any nearby high-resolution GPS can be and often is used as a reference station to visually measure the absolute change in the vertical position of the tide gauge. There are a number of examples in the Levelling Corrections information I linked to above.
Best regards,
w.
Mr Eschenbach, there are other reasons for Tide gauge movement, one absolutely classic is the Earth Quake that caused the Tsunami that hit Japan and took out the Fukushima Nuclear Power Station.
“The Tohoku quake lifted the seafloor by 30 feet (10 m) over an area the size of Connecticut.”, so locally that must affect tide gauge readings as well, especially where the coastline is affected.
What your analysis strongly suggests is that the study you referenced used Cherry Picked data to get the result they wanted.
GPS can measure vertical movement and East-West and North-South Movement. This has revolutionized continental drift movement and theory (we actually know now).
This is the data from the GPS station on the western side of the San Andreas fault at San Francisco (Tiburon Peninsula). The data is actually quite stable other than the earthquakes. Almost all GPS stations are like this with fairly stable trends. Wait five years and that is enough to be reasonably sure.
– west at 19.0 mms/year;
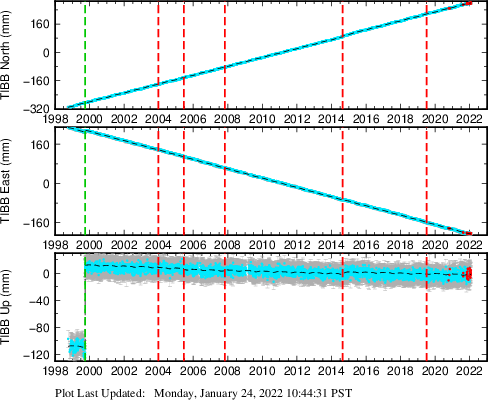
– north at 25.0 mms/year; and,
– down up 1.0 mms/year (a Magnitude 5 Earthquake in 1999 shifted the station up by 120 mms).
Data here:
https://earthquake.usgs.gov/monitoring/gps/SFBayArea/tibb
http://www.sonel.org/spip.php?page=gps&idStation=3024
Cherry Picked data
=======
that was my first thought when I saw the low number of stations used in the study.
the problem is that the cherry picking can be subconscious. the researcher can honestly believe they have produced a fair and honest result and be completely unaware of the bias they have introduced.
thus the importance of experimental design. I personally would be sceptical of any result that doesn’t discuss the experimental controls that were employed to prevent subconscious bias.
willis ==> Leveling is not the same as determining VLM — related but different subject.
“Tide gauge data is worthless for determining Global Sea Level and/or its change unless it has been explicitly corrected by on-site CORS-like GPS reference station data capable of correcting for vertical land movement”
On the other hand Global Sealevel is only usefull for determining the amount of water in the oceans, but that tells little of local level relative to land, and that is the important measure, which tide gauges tell about.
If PGR is real and means the sea floor sinks 0.3mm/year, then the land should rise ~1mm/year, because the Earth has the same volume.
Ooh, Willis, that is a FABULOUS patio you’ve built! Haha–Weapons of mass construction! I really like the flowing water look and the plants growing in the openings.
Thanks, dear lady. As a rank amateur, I was overjoyed that my initial vision could actually come to pass … to make that happen I laid brick, and pulled sections of brick back up and laid brick down again, until I was satisfied.
My criterion was that my eyes should not “catch” as they wandered around the pool of brick. I wanted every part to flow, nothing to hang up free movement.
So once I had bricked over the entire expanse, and even before then, every evening I’d sit and just let my eyeballs roll around on the surface of the pool … and the next day, I’d start by pulling out what caught my eye and replacing it with something new.
That was all done with intact full bricks. Then was the final adjustment. I used a big giant screwdriver. Stand on a brick, insert the screwdriver, lever and you can move big sections of brick. That took some days, I found out that brick doesn’t much care for going around in circles.
The last part of the brick puzzle was cutting filler pieces out of whole bricks using a brick wet-saw. Slow. Plus in the process I noticed some more sections that had to come out and get redone.
Finally got it it all adjusted, nothing catching my eye, so I poured white sand over the surface and swept it into all the cracks to hold it in place. Blew off the excess with my shop vac, called my journey done.
“Ten leagues beyond the wide world’s end,
Methinks it is no journey …”
Always good to hear from you, Joanne, best to you and yours,
w.
PS—As with many things I’ve done in my life, this was indeed my very first foray into both the building of block retaining walls, and also laying patio brick. Go figure … I’d say not bad for a first effort. Given the amount of sweat invested, and given that I generally don’t sweat unless there’s emotional attachment, I figured with any luck there wouldn’t be a second effort, plus it was my own house, so why not go wild?
Enjoyed both the sea level material and the patio work. A very nice addition — both.
Hope you don’t mind this: “The combination tool was created in 1905 by Malcolm McLeod.”
I’ve used, and explained the use of, this tool many times and its name is pronounced as you have spelled it.
Interesting. I always thought it was named after the town in N. California spelled the way I spelled it. I stand corrected … I see I’m not alone in my error, however. Google returns almost half a million results for “McCloud tool” …
Thanks,
w.
Hi Willis,
Happy New Year!
Another story regarding tools is that Ed Pulaski “invented” the pulaski.
This is likely not a “fact”, but an “alternative fact.”
It is possible that he saw a drawing of such a tool in a printed catalogue from a northeastern company (I no longer have the reference), then either made one or had the FS blacksmith make one.
So when legend becomes fact, print the legend.
(I have a very early one, about half the size of the heads sold now. No date.)
He is respected for this (wiki): Drawing on his knowledge of the area and of the dynamics of forest fires, Pulaski led his men to safety in an abandoned prospect mine.
It is said that he lost most of his eyesight because he stayed awake and, with pistol, held his men in the tunnel.
John
I wondered about the Pulaski after I got corrected on the McLeod … thanks for the info. It’s the best tool for splitting kindling, because you can lever on the handle.
w.
Thanks Willis, nice to see you are still looking for the acceleration that *has* to be there to satisfy the CAGW alarmists.
Of course, for me the ‘take home’ is that even if the trend is hard to figure out, compared to wind driven waves, much less the daily ebb and flow, any signal in that trend is really inconsequential. It was pictures of Big Ben drawn submerged beneath projected future sea-level rises that got me interested in Climate. That would be 25 years ago now and I think it’s really time the alarmists were called to account on this particular piece of alarm.
Another point I never hear raised, but which could be of interest to your enquiring mind: Given the very large ranges in tides between geographical locations (eg ~1m max here in Perth, Western Australia, to ~12m up in Broome, ‘just’ 2,400km to the North), it seems to me that any (even quite small) changes in the location of amphidromic points (point locations with no tides, but I’m sure you knew that) could have a major impact on attempts to measure sea-level rise at a location. As with so many cyclic phenomena, I begin to wonder what is driving what!
Good work, but we are subject to the daily vertical displacement of the Solid or Land tide even while we are pretending to measure it. It is nonsense to suppose that the sea tide rises and falls by itself, while the land beneath the sea remains static. At times of king tide, there is a king tide in the land also, hence the clustering of earthquakes around perigees (e.g. watch for an increase around 2-6 January).
There are many lunar factors affecting the height of the sea on any day, and no comparable date in the past when all factors came together. Among them are wind direction, air pressure, currents, declination and perigee, phase, and undersea eruptions most of which are unrecorded and undetected but nevertheless will drive water towards or from a beach. A differential in land mass will change the land tide, so that a mountain range seismically may potentially skew readings at the nearby sea coast, c.f. a flat harbour. Then there is the volcanic atoll, and various Pacific countries which go up and down like elevators.
Comparing sea levels is like counting the barks of dogs across different decades, and declaring dogs to be more disgruntled today, justifying one’s fear of them.
Just saying..
Ken Ring
2 hours ago·
Ken, I looked into this question in a post called “Tides, Earthquakes, and Volcanoes“. I was unable to find any evidence that tides had anything to do with earthquakes …
Regards,
w.
I have written a 264-page book called “How To Predict Earthquakes (in advance)” which explores the fact that the big Christchurch earthquakes of 2010 and 2011 occurred coming up to low tide at their nearest tidal point. Low tide at sea means high tide in land. It was the same with the 7.8mag shake at Kaikoura on 14 November 2016. To me that is direct evidence. Twice the needle on the tidal drum jumped off the scale in the 2011 series.
Ken, you cannot build a theory on three earthquakes, or even six. You need to look at all of the quakes. As I mentioned above, I’ve done that in my post “Tides, Earthquakes, and Volcanoes“.
In that post, I compared the timing of no less than 13,541 earthquakes with a strength of greater than 5 on the Richter scale that occurred since 1900 to the strength of the tidal forces on the earth at the moment of the quake … and I found no correlation. I also looked at 3,396 volcanic eruptions that occurred since 1800 … again, I found no correlation with the strength of the tidal forces.
If you have problems with my analysis of the 13,541 quakes I encourage you to investigate them yourself. The earthquake dataset is from the USGS. I point out in my analysis how to calculate the tidal forces. Perhaps you’ll have more luck than I did, as I could not find a correlation.
Best regards,
w.
So basically you’re saying, that from the existing data, the only way the oceans are going to cover us, is if we’re buried at sea?
Remember that I detrended all the data …
Thanks,
w.
The sea is as high as it ever gets, as we are at or near the end of the current interglacial. So the sealevel can only go down, as the South (wherever it ends up being) Pole attracts more water for ice. But we shouldn’t notice anything for at least 8000 years.
That is the only true climate change, and it happens so slowly that there is plenty of time for everything to adapt. And what cannot change like the millions of already extinct species ends up having no place here.
Ken Ring
20 minutes ago
Huh? Seas all over the ocean are still rising, whether you measure by tide gauges or satellites. So no, the sea is not “as high as it ever gets”.
w.
Willis
Like I did with my data set on minima and maxima, to get a global overview, I think you have to balance your data set to zero latitude.
Alternatively, you could look at one station with good data on the equator, like this one where you just came from:
http://www.psmsl.org/data/obtaining/stations/1861.php
Going by the above result it seems there is down trend from around 2000….
which confirms a [my] cooling trend (from the Gleissberg, remember?)
(sorry, I don’t have the time to actually follow up on my own idea with the tidal gauges, maybe later)
Thanks for the post. Can you more fully explain, in simple terms, “detrending?”
Certainly. “Detrending” means removing a trend from the record. Suppose there were actually no change in the sea level … but the ground was slowly sinking. The measured sea level would show a trend over time, with the sea level rising with respect to the land. The trend might be something like two millimetres per year.
What I’ve done is calculated the underlying trend, and subtracted the trend from the data. In the case of the tides, this should remove any effect of vertical land movement and let me investigate the multidecadal trends.
w.
Stuinflag. Think of the trend as the first derivative of the data curve. The CAGW claim is this is accelerating. That the second derivative equivalent. So subtract the first derivative, and if there is acceleration then the residual has to be rising.
Open question to Willis Eschenbach
Willis We all know that you have seen no evidence that the sun causes warming or cooling semi permanent changes on a global scale. Now the sea level rise for modern times is doubtful as well. So what in your opinion causes long term changes in the earths climate? What is the most likely cause to put mankinds research in? The question is an important one because we think that in less than 2 billion years the suns decreasing furnace will freeze our planet. However much before that we will be hit by an ice age which might doom us as well. So given that an ice age will come, when will it happen and why? In other words why does the climate change?
Alan Tomalty
9 minutes ago
No, the look I took can’t say anything about the rate of sea level rise. It is only useful to show the lack of acceleration in the records.
Back in the Roman times, the world was warm. Then during the dark ages it cooled some. Nobody knows why it was warm, or why it cooled.
Then it grew warmer during Medieval Times … at which point it plunged into what is called the Little Ice Age in the 1600s and 1700s. Nobody knows why it was warmer in Medieval times, and nobody has a clue why we got the Little Ice Age.
Then, and once again for reasons that no one understands, instead of plunging into a real Ice Age the climate started warming again. Who knows why? And that warming has continued, in fits and starts, at about half a degree C per centure for the last couple of centuries.
And again … nobody knows why.
Despite that, a bunch of well-intentioned folks have convinced the world’s population that they can tell us what the temperature will be in the year 2100 …
Sigh.
Short answer? Nobody knows why the Earth goes through such warming and cooling times … but boy, there are a lot of folks out there who claim that the science is settled …
w.
Nice work double checking the Douglas paper, Willis. I don’t recall having seen it. But the fact that he gets just the “right” result by selecting a small subset is notable.
The detrending is a bit unnecessary in this presentation since it will only shift the graphs up or down by subtracting a constant rate from each dataset.
oops , failed to put a slash on the closing blockquote ;(
Yes, this is one of Willis’s best pieces. Finding the problem with Trois-Rivieres was a beautiful piece of detective work. It certainly shows the perils of data selection, and of how just one data series can massively change the end result. And it pretty well destroys the Douglas paper.
I don’t agree with Willis on everything, but I’m sure he is right when he says there is absolutely no evidence of any recent sea level acceleration.
Chris
Trois-Rivieres looks like someone made a transcription error writing mm changes as being cm changes.
Another extremely relevant and well written piece by Willis. Many of the comments are also enlightening. I am a simple person (although a retired engineering hydrologist) and prefer to look for changes in trends at individual stations rather than analyzing the average of a number of stations. I have plotted up annual mean sea levels at 51 long-term locations worldwide and still cannot see any evidence of increasing sea levels in recent decades. https://briangunterblog.wordpress.com/category/sea-level/
Happy New Year to you all. Now only just over three hours left in 2017 here in eastern Australia!
Brian
I looked at your work and found it most interesting. Amazing that the Scandinavian results show a downtrend.
Are we sure that this is due to the land moving upwards? That is quite a volume at that negative rate….
One would have to account for the movement of land as otherwise this whole exercise is fruitless.
Is the arctic ice melt even discernible in the data?
Willis,
could you tell me where you got the figures for the movement of land [at the gauge]
I’ve wondered what happens to tide gauges when waves get bigger or smaller. Then I wonder what would happen if I dumped an oil spill next to a gauge on a windy day. Would it work normally? Dunno.
Like the garden, but as an ex climbing plant nurseryman I think it needs more climbers….
JF
Be grateful that the patio didn’t involve this: wordpress.mrreid.org/2011/02/26/penrose-tiling/
Julian — older tidal gauges generally use a float in a settling tube. The settling tube is sized to filter out waves and ripples, but not tides and other longer term variations. Since all Willis’ sites have many decades of use, they probably use one of the variants of settling tubes. More modern gauges often use radar or sonar to detect the water surface then average the reported heights electronically. (CAVEAT- I’ve never actually seen a tide gauge, just pictures).
Thanks — I’ve wondered if a polluted sea surface would change the way the old gauges react to waves. I’m suffering from the ‘if all you have is a hammer, everything looks like a nail’ syndrome.
JF
Don, somebody did a post on some of the problems with Tide gauges, but I can’t remember who or what Forum.
It may even be on here.
It was a 3 part post by Kip Hansen on here.
https://wattsupwiththat.com/2017/09/13/sea-level-rise-and-fall-part-1/
https://wattsupwiththat.com/2017/10/07/sea-level-rise-and-fall-part-2-tide-gauges/
https://wattsupwiththat.com/2017/12/19/sea-level-rise-and-fall-part-3-computational-hubris/
Great piece of work Willis. Would that Mann, Briffa, et al had the good sense to identify the data set that triggered their $%^# hockey-stick then do a bit of thinking.. (Not that being better at science than Michel Mann seems all that difficult). I’d been thinking about doing pretty much the same thing you did and had actually gone so far as to look at a few sites. I was pretty sure there is no meaningful acceleration in sea level in the past few decades. Now I’m even more convinced. The data is so noisy that I suppose a small acceleration — 0.002 mm/yr/yr or so — COULD be hidden in there.
A couple of points.
1. Because of the way the world is laid out, a lot of tide gauges are close to subduction zones. One of the characteristics of subduction zones is that every few centuries they adjust the elevation of the surface on both sides by a meter or two accompanied by a magnitude 9 or so earthquake. I would have thought that filtering for “step changes” would be necessary. Apparently not.
2. I wouldn’t have thought that a large sample size was necessary. It’s a little disconcerting that a single site can trash the results of a computation that looked on the surface to be pretty robust. How many other “straightforward” computations elsewhere are being controlled by one or two data sets that need to be defanged?
3. Any chance the mild acceleration in the Douglas data is an artifact of the Glacial Isostasy Adjustment that you didn’t make? Offhand I can’t see how. But the widespread use of GIA without any acknowledgment that might not be all that accurate is kind of annoying.
———————————-
The patio looks absolutely terrific. Would that I had the ability to visualize things like that then actualize them. Although my back hurts at the very thought of tackling anything like your project. What do you plan to do about the plants growing in the cracks? I’ve been pulling them out or our patio by hand because my usual herbicide — vinegar (biodegradable, minimal harm to the local wildlife) — probably would degrade the stonework over time. But our patio is nowhere near the size of yours.
Glacial isostasy isn’t a problem over such a short interval – it is linear. The exception being sites really close to an extant icecap where rapid elastic responses to glacial load occurs, e. g. Greenland where medieval norse settlements are now underwater due to icecap growth during the LIA.
Once more I will display favorite example of the constancy of glacial isostasy and the absence of “acceleration”. The tidal gauge at Kungsholmfort in southern Sweden, on solid rock of the exceptionally tectonically stable Precambrian Baltic shield. It was established in 1886 and by pure coincidence at a point where glacial isostatic rise (1,5 mm/year) was exactly equal to absolute sea-level rise (1,5 mm/year). 130 years later they are still equal, average sea level in 2016 was one millimeter lower than in 1886:
http://www.psmsl.org/data/obtaining/rlr.monthly.plots/70_high.png
Footnote 1: There are no tides in the Baltic, so it feels a bit odd calling it a tidal gauge.
Fottnote 2: Because of the self-gravity effect changes of the Greenland icecap has practically no effect in Scandinavia, so there could be some acceleration, provided it is exclusively due to melting of the Greenland icecap.
GIA corrections may be dead on for some places. My problem with GIA is that folks blithely make GIA corrections for place thousands of kilometers from the nearest depths of the previous ice age permanent ice. Lagos, Nigeria -0.13mm/year, Jakarta -0.38. http://www.psmsl.org/train_and_info/geo_signals/gia/peltier/drsl250.PSMSL.ICE5Gv1.3_VM2_L90_2012b.txt
Is a GIA correction for those places needed? Could be. Do we know what the appropriate correction should be? To two decimal places? Seems to me more than a bit dubious.
“Is a GIA correction for those places needed?”
No, but “the forebulge” goes quite some way outside the former icecaps. Lagos and Jakarta, no. Bermuda and the Mediterranean, yes.
That is a beautiful timeseries tty – trusting your explanation of it. Thanks for posting it again as it’s the first time I’ve seen it. Sometimes if you want to test a theory, it makes sense to seek out the very best way you could prove or disprove it. Is that cherry-picking? Probably so when the answer you get from doing it doesn’t fit with your preconceived agenda.
Willis,
Personally, I think the exercise might be more interesting when presented as a lesson in selection of data for further analysis, than as an example of sea level change. That selection lesson has a wide candidate audience in the climate field for topics away from sea level change as well, but that is incidental to the important message of pre-testing different sets of potential input data before one does a larger analysis. By stitching it to sea levels, you have complications from unknown amounts of change in storage reservoirs on land, movement of ocean basin bottoms and so on. But this is only a personal view.
BTW, better to write ‘acceleration of sea level rise with time’ than ‘acceleration in the rate of sea level rise’. Clarifies the differentials. Geoff.
Interesting article from Nature which discusses sea level rise from a satellite perspective.
“Nerem’s team calculated that the rate of sea-level rise increased from around 1.8 millimetres per year in 1993 to roughly 3.9 millimetres per year today as a result of global warming. In addition to the satellite calibration error, his analysis also takes into account other factors that have influenced sea-level rise in the last several decades, such as the eruption of Mount Pinatubo in the Philippines in 1991 and the recent El Niño weather pattern”
https://www.nature.com/news/satellite-snafu-masked-true-sea-level-rise-for-decades-1.22312
Well, yes that’s a problem. The satellites seem to be looking at a different planet than the tidal gauges are. But keep in mind that the “GPS corrected” tidal gauges should be operating in the same reference framework as the satellites. Seems to me you have a few choices.
1. The open ocean sea levels are rising much faster than coastal station sea levels and are accelerating.whereas coastal station sea levels aren’t accelerating
2. There is some sort of problem with GPS that no one is aware of.
3. There’s some sort of problem with processing of satellite Radar Altimeter data.that no one is aware of.
4. Something else
Pick one or more. To me, only 3 and 4 seem remotely plausible.
Don, they were adjusted.
The earlier European Satellite showed Falling sea levels and was quickly discarded, the GIA was added to the Satellite data and we soon have that naughty fall turned in to a rise.
But even NASA admit to no rise in the last 3 years.
https://sealevel.nasa.gov/
Don, they were adjusted.
The earlier European Satellite showed Falling sea levels and was quickly discarded, the GIA was added to the Satellite data and we soon have that naughty fall turned in to a rise.
But even NASA admit to no rise in the last 2 years.
https://sealevel.nasa.gov/
Click on the 3.4mm Sea Level Rise to see graph
5. There’s some sort of problem with the processing of satellite Radar Altimeter data that some people are perfectly aware of.
Here is an interesting paper on CryoSat 2 and measurement of sea-ice thickness:
https://www.researchgate.net/publication/320929563_Estimating_Arctic_sea_ice_thickness_and_volume_using_CryoSat-2_radar_altimeter_data
Check Figure 8 “Mean Sea Level Anomaly” and compare with the claimed precision for sea-level measurements. Some rather considerable difference eh? Note that the scale is in meters, not millimeters. But then there is no political need to measure ice thickness in terms of tenths of millimeters.
ACO – “Don, they were adjusted.”
Indeed they are, but the (bizarre) CU adjustment for GIA is only about 12% – .roughly 0.33 mm per year. Even if one unadjusts it, the resulting (probably) eustatic sea level seems too high compared to tide gauges.
Yes ERS had lower numbers. There is, or used to be, a reassessment of the ERS missions on the internet somewhere. I’ve lost track of it. It came up with a sea level rise of — as I recall — 2.0 mm/yr with a fairly large uncertainty of +- 2.0mm/yr primarily from uncertainty about ionospheric delay. Later satellites use multifrequency RAs that SHOULD have substantially less ionospheric delay uncertainty.
tty — thanks. I found the paper, but my browser is finding it to be somewhat indigestable. Looks interesting, I’ll look at it later, in a different browser if necessary.
I hate to get all nitpicky, but GPS corrections to tide gauges ignore the local gravity.
You need to correct gauges to some hypothetical local isopotential surface, not the distance from the center of the earth. For example, if your entire continent moves upwards 10 mm, the isopotential surface (the level of water in your basin) will shift upwards by some fraction of that, depending on a lot of variables. But if you have a landfill tidegauge that’s sinking, independent of your continent, then the change is actually relative to the local isopotential surface of the average water level.
It may be that this correction turns out to be too small to worry about. I don’t have time to look myself. Have people been looking at this correction? I’ve never seen anyone mention it.
“I hate to get all nitpicky, but GPS corrections to tide gauges ignore the local gravity.”
Only of importance if the gravity field changes, which it does to slowly to matter in nearly all cases. It might be of some slight importance in some very special cases, e. g. if a big new dam is built nearby or if a large glacier changes size quickly or there is a very large volcanic eruption.
However, a 25% localerror in gridded monthly estimates of Arctic sea ice thick-ness derived from CryoSat-2 observations corresponds toan uncertainty of 45 cm for a typical thickness of 1.8 m.This uncertainty is consistent with the spread of differencesrelative to independent estimates acquired from airborneand ocean-based platforms, of 34–66 cm (Section 6.2).6. Results and discussion6.1. Arctic sea ice thickness resultsUsing Baseline-C CryoSat-2 data, we are able to producemonthly sea ice thickness estimates for seven complete sea-sons of sea ice growth (October–April) from 2010–2017,except for one month in October 2010. The thickness dataare output on to a 5 km square Polar Stereographic grid(Section 5.1). We do not run the sea ice processor in themonths of May–September as melt ponds make it difficultto discriminate between radar returns from leads and fromsea ice floes (Section 4.2). Sea ice thickness maps for autumn(October/November) 2016 (Fig. 14a) and spring (March/April) 2017 (Fig. 14b) show that the thickest ice is concen-trated around the coast north of Greenland and EllesmereIsland, and extends into the central Arctic as the growthseason progresses. Over the CryoSat-2 period, the averageautumn sea ice thickness in the Northern Hemisphere was1.28 ± 0.13 m, increasing to 1.94 ± 0.09 m in spring.6.2. Evaluation of Arctic sea ice thicknessTo evaluate the accuracy of our CryoSat-2 sea ice thick-ness estimates, we have previously compared our Baseline-B results to independent estimates of sea ice thickness anddraft acquired from airborne and ocean-based platforms.We used 772,090 estimates of sea ice thicknesses derivedfrom NASA Operation IceBridge (OIB) airborne radarand laser altimeter measurements (Kurtz et al., 2013), 430estimates of sea ice plus snow thickness derived by Haaset al. from ESA CryoSat-2 Validation Experiment (Cryo-VEx) airborne laser altimeter and electromagnetic (EM)sounding measurements (Haas et al., 2009), and 80 millionestimates of sea ice draft derived from upward lookingsonar (ULS) measurements as part of the Beaufort GyreExploration Program (BGEP) based at the Woods HoleOceanographic Institution (http://www.whoi.edu/beau-fortgyre). The OIB measurements were collected over theperiod 2011–2013 (L4 IDCSI4 product) and 2014 (quick-look product), the CryoVEx data over 2010–2012, andthe BGEP data over 2010–2013. Both the OIB and Cryo-VEx measurements were only collected during spring butthey survey a variety of sea ice thickness and type(Fig. 15a and b, respectively), and the OIB data cover a sig-nificant fraction of the western Arctic. The BGEP observa-tions are available year round, but sample a restricteddistribution of ice as the moorings are fixed (Fig. 15c). LikeCryoSat-2 estimates of sea ice thickness, the OIB and Cryo-VEx estimates of sea ice thickness and sea ice plus snowthickness, respectively, are derived products. It is necessary16 R.L. Tilling et al. / Advances in Space Research xxx (2017) xxx–xxxPlease cite this article in press as: Tilling, R.L., et al. Estimating Ar
Estimating Arctic sea ice thickness and volume using CryoSat-2 radar altimeter data (PDF Download Available). Available from: https://www.researchgate.net/publication/320929563_Estimating_Arctic_sea_ice_thickness_and_volume_using_CryoSat-2_radar_altimeter_data [accessed Dec 31 2017].
After reading the above paragraph I have no confidence in any satellite measure of ice thickness measurements.
Given that the inner core responds to the transiting moon to cause the daily land tide, which in turn causes the sea tide, one would expect to see 1. and 2. answered.
Why wouldn’t satellites too, which operate within our geo-sphere? In other words, when everything is in motion due to lunar influence, what is measuring what? There is measuring, and there is just describing from another angle. GPS comes under lunar influence too.
Love the patio, we ‘inherited’ one with a selection of plants already in it. Thyme was the most frequent, but also Erigeron which looks like a small daisy and flowers all summer, as does a dwarf catmint which needs a Chelsea Chop in midsummer. The one problem is a purple leafed oxalis which is very invasive and needs more serious discouragement.
Willis,
just wondering about,;
Tides
1,500,000 earthquakes every year ( a million + under water )
Tsunamis
Cyclonic storms
Tornado’s
Volcanoes
Temperature (Ice ? )
El nino
etc.,
and as the earth is covered by 2/3 water ( you can fly direct from London to Auckland,) 24 hour flight time and not pass over land and the talk about mm ?
What route would that be ?
Polar-Bering-Pacific-NZ
Smashing all the data together is one way of looking at the question, and this is as good a job as could be using that approach. Another approach is to look at just one high-quality record, where there is GPS to control the land subsidence variable (GIA).
My pick is Newlyn in SW UK (Cornwall). Where there has been a benchmark established at the tide gauge (purpose built granite station on granite bedrock) since 1915 and GPS since 20 years has shown the land is sinking at 0.7 +/- 0.2 mm/year (as well as moving away from America at about 20 mm/year). The tide gauge shows a linear rising sea level trend for 100 years of 1.8 +/-0.1 mm/year. Therefore sea level at Newlyn is rising at roughly 1.1 +/-0.3mm/year, at least for the last 20 years. Not really much to worry about.
http://www.tandfonline.com/doi/pdf/10.1080/01490419.2015.1121175
I would be interested if anyone knows a database of which tidal reference stations have co-located GPS to measure accurately the GIA.
Essentially all stations in Sweden have co-located GPS. The GIA is known to a high degree of accuracy:
https://www.lantmateriet.se/globalassets/kartor-och-geografisk-information/gps-och-matning/referenssystem/landhojning/presentation-av-nkg2016lu.pdf
“I would be interested if anyone knows a database of which tidal reference stations have co-located GPS to measure accurately the GIA.”
Check Rud Istvan’s (ristvan) post upthread. http://www.sonel.org is probably what you are looking for. (CAREFUL. that’s .org, not .com)
And keep in mind that “GIA” is computed from models of motion of mantel and core material of the Earth. At any given site, there can be “local” causes of subsidence or uplift that GIA doesn’t know about.
well, from my point of view…the question is what asumptions do you have to make to think you are able to get the global sea level from a set of tidal gauges??????
Just like loking at tree rings and assume it can measure ” temperatures”…
the numbers of conservatives hypothesis is huge…really huge… so huge that the only good answer is , at my opinion ,tides gauges can mesaure sea levl because i have got another way to measure sea level that gives a similar result.
The only “assumption” I need is that Tidal Gauges are where we live and how we will be affected.
sure tidal gauges are a very useful tool to measure local relative sea levels …
what about gloabl sea level? why do we accept so easily that tidal gauge simply can measure gloabl sea level..
Interesting article, thanks Willis.
Vertical measurement using GPS I have noticed in the past to be wildly inaccurate.
With my first GPS unit (Garmin 12) it would give wild reading like 100m altitude on a flat sea position at times.
On my newer boat mounted GPS I don’t find it displayed at all.
http://xcmag.com/news/gps-versus-barometric-altitude-the-definitive-answer/
You’re correct. The “vertical” (radial) component of GPS positions is, on average, substantially less accurate than the “horizontal” component. And without correction, even the horizontal component can easily be of by 16 meters (50 feet). The reasons for this are (probably) pretty well known. Basically, most individual GPS measurements are made against satellites low on the horizon and therefore don’t provide a lot of elevation information. However the experts in this stuff think that using differential GPS (broadcasts of recommended corrections from stations that constantly compare GPS derived positions with known positions) and observing over a long time span can measure even “vertical” position with high precision.
Great job about sea level acceleration and terassing.
Being a Swede I would ask about the banjo “Playing the Swedish banjo”
-but I could guess- and feels like it is not valid for all Swedes any more.