From NASA Goddard: New NASA Instrument Continues Measuring Solar Energy Input to Earth
We live on a solar-powered planet. As we wake up in the morning, the Sun peeks over the horizon to shed light on us, blanket us with warmth and provide cues to start our day. At the same time, our Sun’s energy drives our planet’s ocean currents, seasons, weather and climate. Without the Sun, life on Earth would not exist.
For nearly 40 years, NASA has been measuring how much sunshine powers our home planet. This December, NASA is launching an instrument to the International Space Station to continue monitoring the Sun’s energy input to the Earth system. The Total and Spectral solar Irradiance Sensor (TSIS-1) will precisely measure what scientists call “total solar irradiance.” These data will give us a better understanding of Earth’s primary energy supply and help improve models simulating Earth’s climate.
Video: In terms of climate change research, scientists need to understand the balance between energy coming in from the Sun and energy radiating out from Earth, as modulated by Earth’s surface and atmosphere. Measurements from TSIS, the Total and Spectral Solar Irradiance Sensor, will help our understanding of the Earth-Sun connection and improve climate models. Credits: NASA’s Goddard Space Flight Center/Michael Starobin
“You can look at the Earth and Sun connection as a simple energy balance. If you have more energy absorbed by the Earth than leaving it, its temperature increases and vice versa,” said Peter Pilewskie, TSIS-1 lead scientist at the Laboratory for Atmospheric Physics (LASP) in Boulder, Colorado. Under NASA’s direction, LASP is providing and distributing the instrument’s measurements to the scientific community. “We’re measuring all the radiant energy that is coming to Earth.”
But it’s not so simple: the Sun’s output energy is not constant. Over the course of about 11 years, our Sun cycles from a relatively quiet state to a peak in intense solar activity — like explosions of light and solar material — called a solar maximum. In subsequent years the Sun returns to a quiet state and the cycle starts over again. The Sun has fewer sunspots — dark areas that are often the source of increased solar activity — and stops producing so many explosions, going through a period called the solar minimum. Over the course of one solar cycle (one 11-year period), the Sun’s emitted energy varies on average at about 0.1 percent. That may not sound like a lot, but the Sun emits a large amount of energy – 1,361 watts per square meter. Even fluctuations at just a tenth of a percent can affect Earth.
In addition to those 11-year changes, entire solar cycles can vary from decade to decade. Scientists have observed unusually quiet magnetic activity from the Sun for the past two decades with previous satellites. During the last prolonged solar minimum in 2008-2009, our Sun was as quiet it has been observed since 1978. Scientists expect the Sun to enter a solar minimum within the next three years, and TSIS-1 will be primed to take measurements of the next minimum.

“We don’t know what the next solar cycle is going to bring, but we’ve had a couple of solar cycles that have been weaker than we’ve had in quite a while so who knows. It’s a pretty exciting time to be studying the Sun,” said Dong Wu, the TSIS-1 project scientist at NASA’s Goddard Space Flight Center in Greenbelt, Maryland. Goddard is responsible for the overall development and operation of TSIS-1 on the International Space Station.
TSIS-1 data are particularly important for helping scientists understand the causes of total solar irradiance fluctuations and how they are connected with the Sun’s behavior over decades or centuries. Today, scientists have neither enough data nor the forecasting skill to predict whether total solar irradiance has any long-term trend, said Doug Rabin, deputy project scientist at Goddard. TSIS-1 will continue a data sequence that is vital to answering that question.
These data are also important for understanding Earth’s climate through models. Scientists use computer models to interpret changes in the Sun’s energy input. If less solar energy is available, scientists can gauge how that will affect Earth’s atmosphere, oceans, weather and seasons by using computer simulations. The input from the Sun is just one of many factors scientists used to model Earth’s climate. Earth’s climate is also affected by other factors such as greenhouse gases, clouds scattering light and small particles in the atmosphere called aerosols — all of which are taken into account in comprehensive climate models.

TSIS-1 will study the total amount of solar radiation emitted by the Sun using the Total Irradiance Monitor, one of two sensors on the instrument. The second sensor, called the Spectral Irradiance Monitor, will measure how the Sun’s energy is distributed over the ultraviolet, visible and infrared regions of light. TSIS-1 spectral irradiance measurements of the Sun’s ultraviolet radiation are critical to understanding the ozone layer — Earth’s natural sunscreen that protects life from harmful radiation.
“Knowing the Sun’s behavior and knowing how Earth’s atmosphere responds to the Sun is even more important now because of all the different factors that affect climate change. We need to understand how all of these interact on Earth’s system,” said Pilewskie.
For radiative balances we must use Degrees Kelvin (the absolute temperature). The average temperature of the Earth is approximately 300 K. A 0.1% imbalance might cause a 0.3K change. That is more than the Paris Agreement strives for.
CG,
It’s just Kelvin. Drop the “degrees” when using K.
Yes, but many people don’t know what Kelvin is, so saying Degrees Kelvin helps. In fact Degrees is commonly used in front of Kelvin, Celsius and Fahrenheit by TV meteorologists and the like, so although redundant, it is no doubt accepted and for all those under-educated millennials, required.
We can use any temperature scale, but those that start at absolute zero make the most sense.
And yes, it’s Kelvins. Just like meters, Hertz, seconds, and all those other SI units.
Well a whole one tenth percent change could alter the earth’s Temperature by a whole one fortieth of a percent or about 72 millikelvin which is what Dr S has been telling us for ages.
But that is if the earth does not react in any way to such a change, like alter the amount of cloud cover.
And no it is NOT degrees and it is not Kelvins, it is kelvin (singular) an not capitalized but it is also K since k is kilo or Boltzmann’s constant.
And as far as the most people is concerned they will never learn if those who know, continue to use incorrect units or terminology.
G
And for the curious, yes I DO capitalize Temperature when I am referring to absolute kelvin scale, but I use temperature if I just mean use the pyramid inch system of units.
And no ! nobody has authorized me to make up my own units, but I can make up my own words, and Temperature is one of them; and it is also always a positive number; or more strictly a non-negative number.
Also I use kelvin to mean an absolute Temperature. For a differential Temperature change I use deg. C since a change of one in the kelvin Temperature is identical to a one deg.C change. kelvin is the Temperature on an absolute scale whose origin is zero, so it is not a Temperature differential.
Good point George.
However I think this…
“The second sensor, called the Spectral Irradiance Monitor, will measure how the Sun’s energy is distributed over the ultraviolet, visible and infrared regions of light.”
overwhelms any overall change in TSI, and it key to our understanding.
There are ONLY two ways to change the energy content of a system in a radiative balance; either change the input, or change the residence time of the input within the system. The residence time DEPENDS on the materials encountered, AND the spectrum input. The disparate solar spectrum has vastly varied residence time, and these changes, in conjunction with their affect on the materials encountered, ozone to ocean depth, overwhelm the small change in TSI, are key to understanding the earth’s climate.
Particularly since the oceans do not absorb solar irradiance at their surface, but rather at depth, and the amount of vertical penetration depends upon the wavelength.
The sun’s impact is far more nuanced that just TSI.
No, The relationship between forcing and temperature is not linear (E=sigma x T^4). A change of energy forcing at 300 K would produce a change in temperature of less than 0.1 K.
Should be “A 0.1% change of energy forcing at 300 K would produce a change in temperature of less than 0.1 K”
Well the average Temperature of the earth is not approximately 300 K it is 288K to integer approximation.
G
In 2016 the September 2016 (14 months ago) SILSO Sunspot number prediction for now (2017) was to be a/o 20 by their standard method (SM – red) and around 38 from their combined method (CM – green).
See the graphic screen shot from that 2016 for late 2017 prediction here:
http://i67.tinypic.com/10891qd.jpg
How did they do?
http://i67.tinypic.com/2s0dzzm.jpg
The standard method (left) pretty much nailed it.
The C-M was out to lunch.
That say in 1 year the [Silso SSN (by S-C)] will be likely around < 10. Still a year from minimum.
Cool times ahead.
should be S-C not S-M. (Freudian slip 🙂 )
[Is the edit now correct? mod]
yes. thanks Mr Mod.
This will be interesting to watch how this unfolds. I think that the minimum will set in around September of next year. I base this on the premise that last year’s heavy winter in California/Pacific Northwest was the solar cycle influenced cyclical flood pattern which at times has a 9 year pattern, which then switches to around 11 years for a number of cycles. So if it was a cyclical flood winter, then the minimum should be no more than 2 years away. So around Sept of next year.
SC 23/24 minimum was December 2008 by sunspot number, July 2008 by F10.7. At 11 years do the math. Strong solar cycles have shorter cycle periods. Weaker cycles have longer intervals.
SC 24/25 minimum will likely not occur before Fall-Winter 2019. More likely in 2020. When in 2020 is a wag.
SC 24 was a weak cycle — Weakest in 100 years. So minimum values of geomagnetic activity are quite possible for the next 2 – 3 years as SC 24 closes out — and probably surprises us with a few “nice” CMEs.
At any rate, Sept 2018 is not a likely the actual “minimum”. But the sun will likely stay there for 12 more months.
I tend to agree with joelobryan on this one, however so far in November we have had 19 spotless days out of 29. It can continue to go quieter, there’s room for it, but still 2 full years going quieter? How quiet is it going to get?
It really is time to open a sweepstake on the date of next solar minimum. But, goldminor, I doubt that it can be as soon as next September because we haven’t seen any reverse polarity Cycle 25 sunspots yet. I am sure there will be a big fanfare when that arrives, along with estimates of the implication for the date of Minimum.
I have studied the shape of the “Butterfly Diagram”, and no longer believe that this can be a very long (>12 years) cycle, but I still think early 2020 and 11+ years is on the cards.
Rich.
Thank you for sharing; very interesting and fun to see.
Let’s hope NASA puts together Aerosols, clouds, albedo, magnetic flux, Solar Storms, Geomagnetism, and talks to Svensmark about his theory. May we are getting close to a uniform climate theory.
Enginer (sic),
An Old Appalachian saying:
Hope in the left hand, and [defecate] in the other. See which one fills up faster.
IOW, NASA is not close to anything except a very full right hand.
The graphic (GIF) that has the text :”observed a dip in the irradiance during intense solar flare activity in September 2017.”
What that doesn’t say is the Earth got slammed by multiple X-class (X-ray and EUV events spikes) flares and the Ap geomagnetic index hit a high that was higher that it has been in the last 10 years in that first week in September.
What is misleading about that GIF also is that while sunspots themselves actually darken, and therefore decrease TSI, they are almost always accompanied by surrounding faculae that are brighter than normal, thus TSI usually increases when there are lots of sunspots.
Sunspots are dark (reduced irradiance) while faculae are very bright (increased irradiance)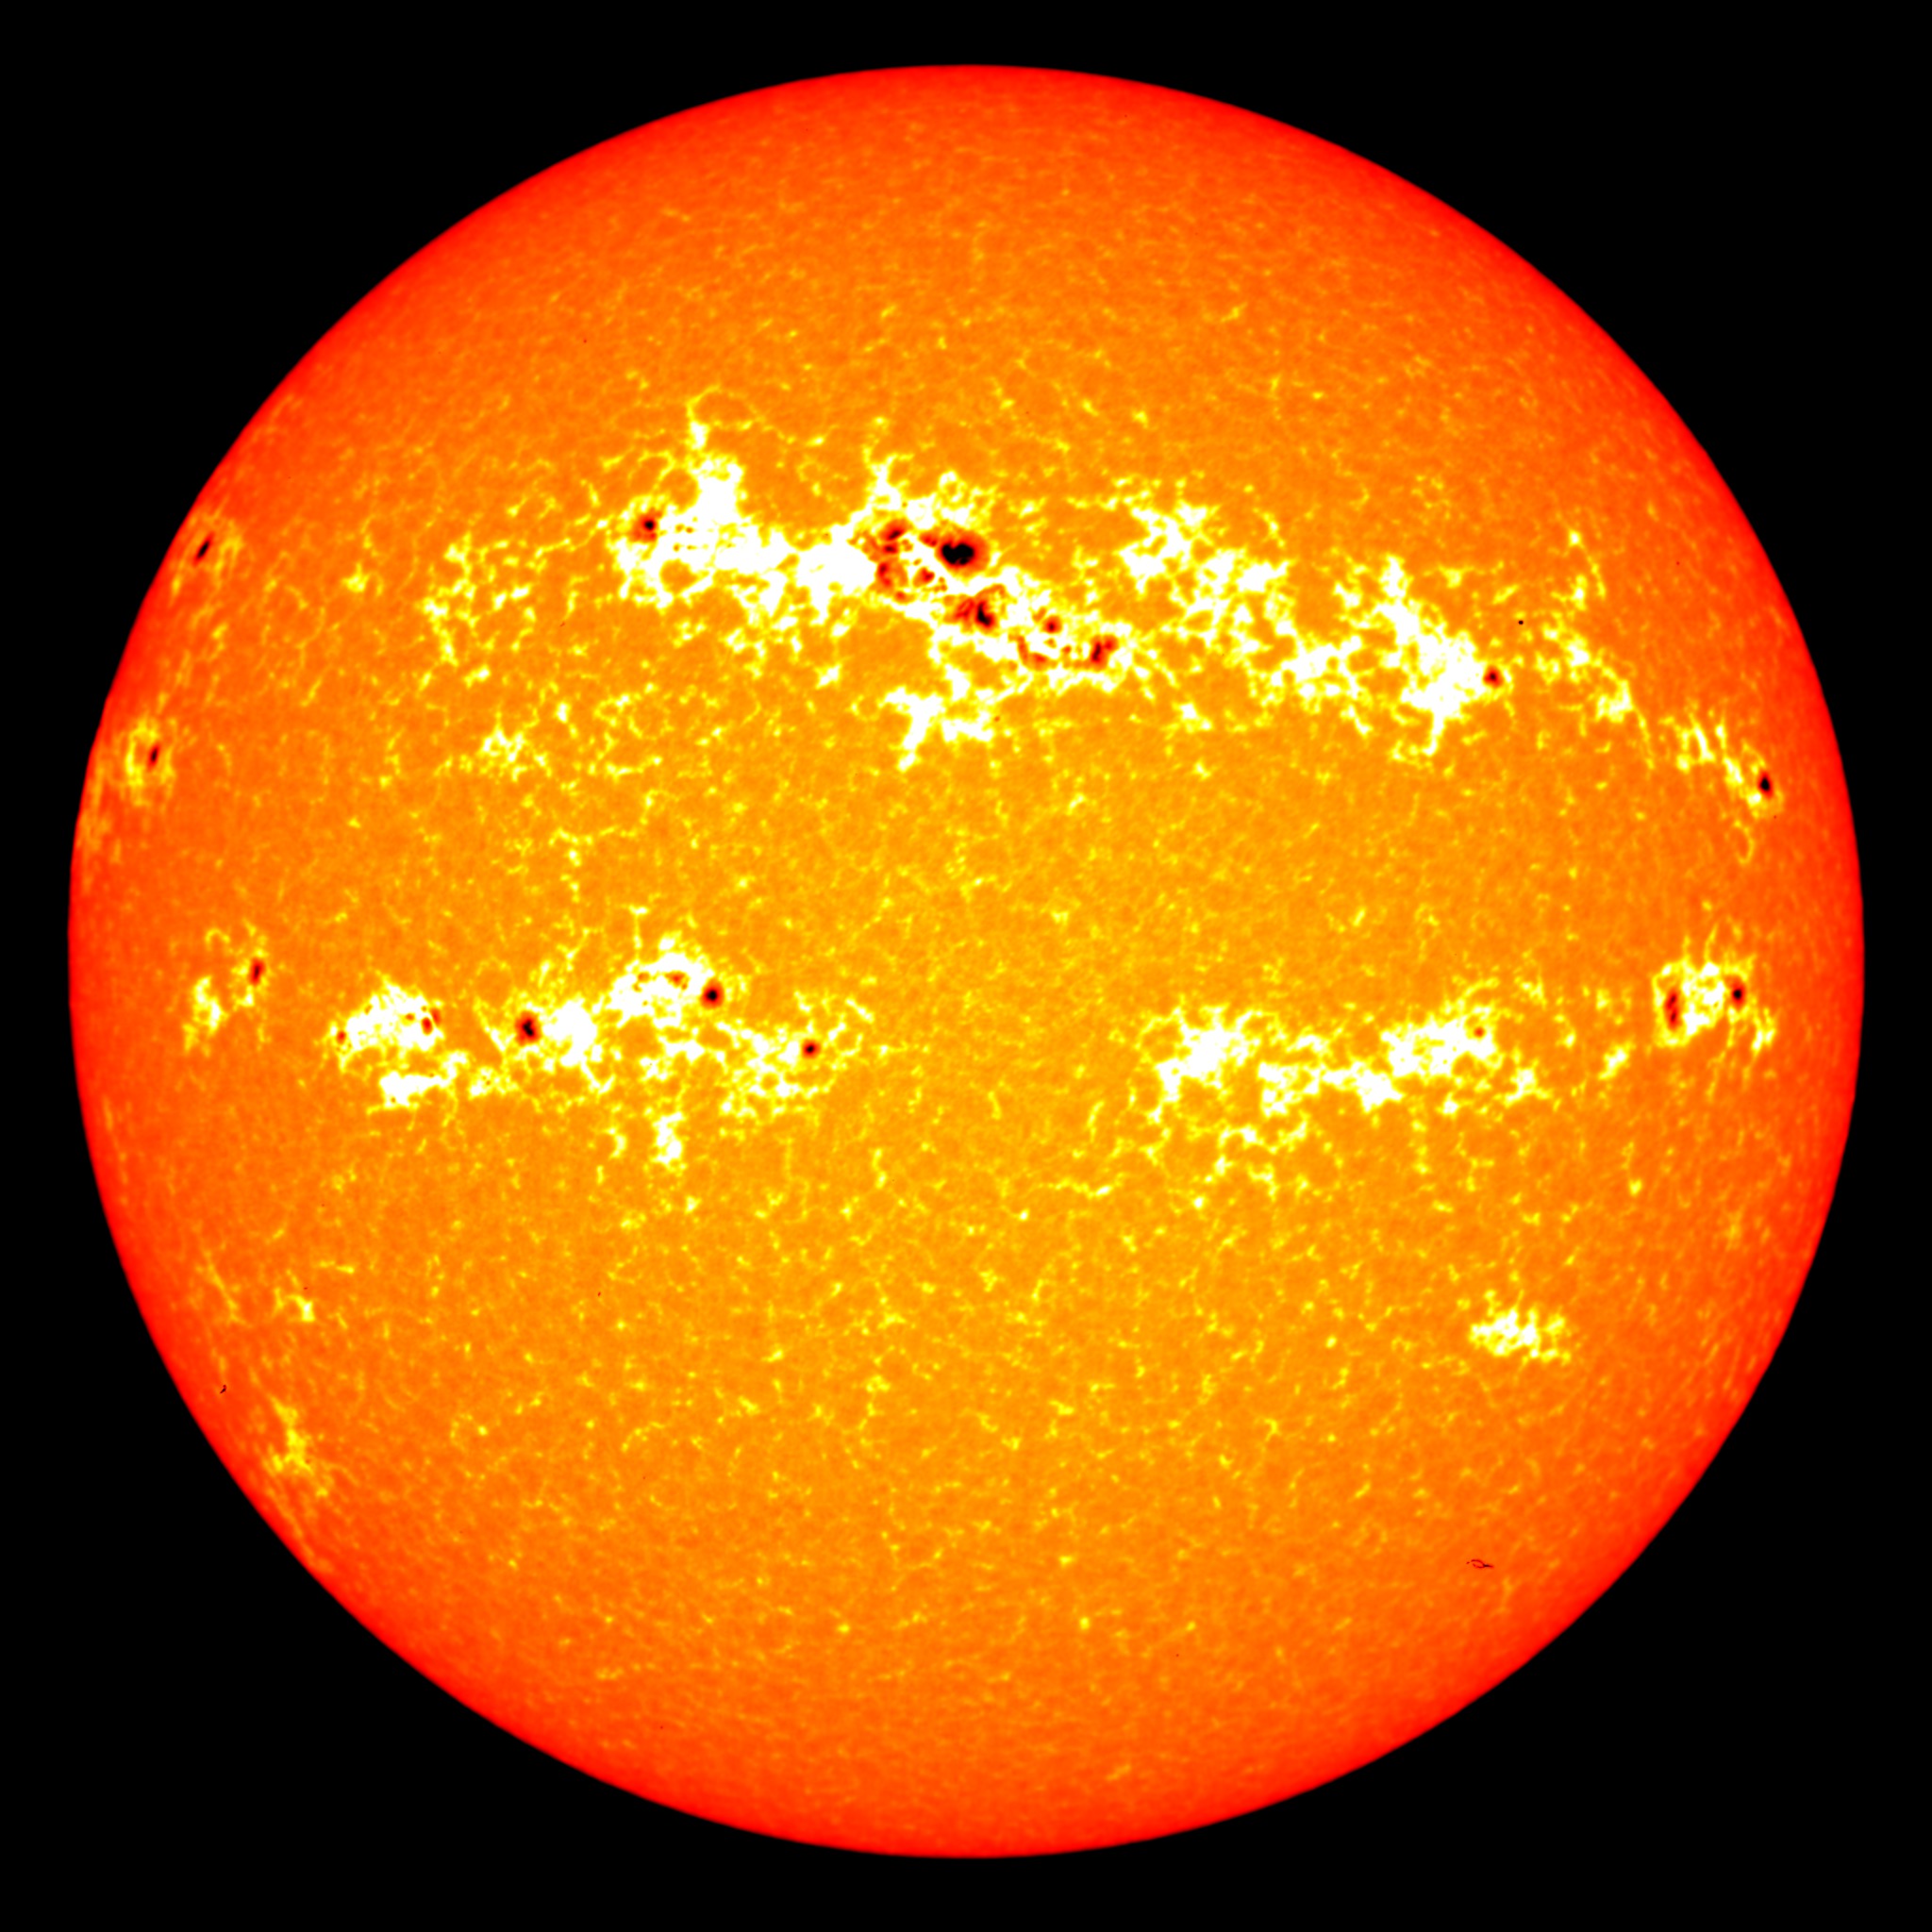
Here’s a movie of those multiple X-flares. Amazing that they occurred at this point in the solar cycle… or is it?
Pop,
“Amazing that they occurred at this point in the solar cycle… or is it?”
Noted.
IF – note the conditional – the science is settled, your question could be answered [by those much more informed than this bum boatie].
I suspect that the science is – again – in no way settled.
Some folk may have a good hypothesis.
Others may do, too – even if there is little-to-no congruence.
But –
Settled?
Not so much.
Oddly, much of that applies to most of the ‘climate’ debate [Hmmmm. Does a debate need more than one ear??].
Auto
So multi, multi millions of dollars are spent for the utmost in sun-interrogation technology and dozens of libraries of data will be collected – but how is it all these analyses always conclude that 0.04% of a constituent of our atmosphere is the cause of impeding planetary doom?
“The Rick November 29, 2017 at 7:03 pm
…but how is it all these analyses always conclude that 0.04% of a constituent of our atmosphere is the cause of impeding planetary doom?”
No, it’s worse than that. It’s not the 0.04%, as that is total CO2. It is only ~4% of 0.04%, the emissions from human activities, that is the problem. Apparently.
The Rick,
So, to the nearest one tenth of one percent, there is NO CO2 in the atmosphere.
And even of the trace there is, much – most?- almost all? – is natural.
And they are spending “multi, multi millions of dollars ” – as you rightly say.
Does someone have an agenda, here?
Is it a matter of belief?
Auto
After pillorying Soon for over emphasizing the role of our Sun in Earth’s natural temperature variations we’re going to prove how important it really is. Is that what’s this is all about besides more alarmism?
Anthony, you said ‘Over the course of one solar cycle (one 11-year period), the Sun’s emitted energy varies on average at about 0.1 percent.’ I thought that parts of the sun’s radiation spectrum varied much more than this (UV?). Does the ‘Total Solar Irradiance Composite’ chart shown actually include all of the sun’s emitted energy, or just what NASA thought was worth measuring?
BoyfromT
EUV is proposed to have an outsize effect apart from TSI. EUV is just a small percentage of TSI, but it is EUV/UV that heats the stratosphere (via ozone’s high absorption of UV, which is why the stratosphere’s temperature profile is opposite of the troposphere).
A series of high EUV event can likely puff-up the exosphere, thus enhances the atmosphere’s ability to hold in heat. So that extra EUV/UV warms the stratosphere and the underlying troposphere responds too, but the effect is temporary (a transitory perturbation from equilibrium). When the enhanced EUV subsides, the enhanced ozone-stratosphere heating slowly subsides as well.
Conjecture: The 6-12 September 2107 X-class flares are why both the Sept-Oct 2017 UAH and RSS TLT anomaly numbers jumped relative to the surface T data sets while TSI dipped. (IOW: the sun gave us a nice experiment on the importance of EUV/UV relative to TSI)
Well actually it is that EUV that creates the ozone layer out of molecular O2, by making first atomic O.
So I don’t see much of anything left over to heat the stratosphere.
And the lesser extreme UV gets absorbed by that same O3 and broken down to O2 again.
Without the Oxygen we would all get sunburned from UV and EUV.
The Ozone layer is just proof that the system is working.
G
Tottenham,
You are correct. Total solar irradiance changes and spectral irradiance changes don’t match. Certain parts of the spectrum vary by a lot more than 0.1%, while others barely change, and some actually are anti-cyclic.
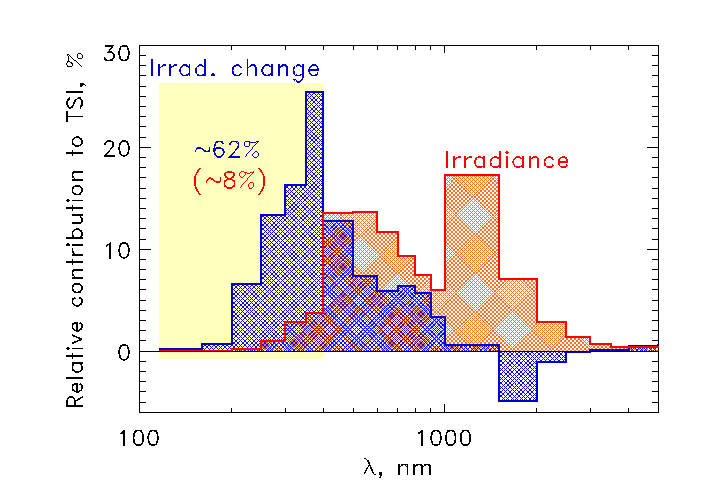
As the graph shows between 200 and 400 nm (8% of the total irradiance) displays a 62% variability with the cycle, while above 1500 nm goes against the cycle.
This is very important to explain solar variability effect on climate, yet rarely mentioned.
Changes in UV frequency content make a HUGE difference to how much energy penetrates into the oceans.
That’s right. There are tens of papers, which give the UV radiation a big influence on the stratosphere and thus also a big influence on the troposphere via influence on the big atmospheric waves.
That is correct. The change on the spectrum is variable and yes, few people bother to explain temperature change in terms of Solar Irradiance. On top of that, it seems that models do not take into consideration solubility of gases in sea water. Nice graph; Can I have the source?
Thank you
Franklin
It’s from Natalie Krivova. I don’t know if it has been published. You can find it here:
https://www2.mps.mpg.de/projects/sun-climate/results.html
Why all this study of our variable star, when the experts say any of the changes are negligible.
Fascinating.
Because the know they are wrong. Roman WP, dark ages, MWP, and LIA are greeting, but this experts put the head in the sand.
Hans-Georg
Plus a whole shedload!
A brief and clear explanation.
Auto
Could the 0.1% be related to weather patterns around the world?
The last time solar activity was quietest in about 100 years occurred back around 2010 and I don’t think this was coincidence with England (CET) recording it’s coldest December since around back then. (late 19th century) Around 2010 the UK had a period of colder winters for few years and cool, wet summers. Soon as solar activity increased the UK’s winters had become mild after 2013 and summers improved.
Coincidence?
Not really as there is scientific evidence between meridional jet stream and quiet solar activity that increases severe weather events and likelihood of colder winters. West to east wind is called ‘zonal’ and north to south wind is called meridional. The meridional wind transports heat from equator to pole and this type of jet stream was common during the LIA with many cold/severe winters in Europe and especially the UK.
Future?
If solar activity becomes as quiet as around 100 years again now, or very soon, the UK will experience colder winters again. There are various signs this change has already occurred or occuring and the first colder winter should be expected for 2017/18 season. This relies on La Nina staying weak or neutral as strong La Nina’s always seem to wake up zonality over the North Atlantic ocean and bring milder winters to the UK.
Why choose the UK?
It is exposed to the North Atlantic ocean and therefore cold winters here indicate a change in the usual jet stream. The region has a fine line between continental (cold) and Atlantic ocean (mild) winters because weather patterns only hundreds of miles away make a huge difference.
Solar activity 0.1%?
While solar activity changes slightly all the time with peaks to troughs, the most important influence is the duration. An increase or decrease in solar activity will influence the planet more when this change remains the same for longer. Over recent cycles the solar minimum has not lasted longer than about 2.5 years.
What would happen if equivalent lasted for 10 years, 30 years, 60 years or 120 years?
The winter of 1962 / 1963 was colder in England than your example than your example see wiki there may have been an isolated cold temp in December. so could you correlate this extreme with your hypothesis?
I understand that Jan 1963 was much colder in England, and was not on a solar minimum.
Matt I agree with your general thrust, the meridional transport is a global cooling signal and its already having an impact on the Southern Hemisphere as we speak.
The mechanism incorporates blocking highs as a key component and the mid latitudes experience severe weather.
If the NAO goes negative and stays below the line for weeks at a time, then cool wet summers and freezing winters will be the norm in the UK.
There is always going to be exceptions because it depends on which side of the meridional jet stream the UK is positioned. What happens is the chance of occurring increases and the 1963 winter was very rare event and the coldest since 1740 for England. January 1963 was indeed much colder month and blocking highs featured during that winter was key. (although December 1962 was considerably less cold) The winter of 1963 was approaching a solar minimum with lowest TSI values between 1962 and 1966.
Carrington Event anyone?
The solar storm of 1859 (aka the Carrington Event) was a powerful geomagnetic solar storm during solar cycle 10 (1855-1867). It occurred on the descent of solar cycle 10’s to minimum.

Plan for the worse, hope for the best — never the reverse.
Hi Anthony, was going to put this over in your ‘tips and notes’ page, but since one of the articles mentions (lol)
solar irradiance … thought I would put them here.
For what its worth…
The Correlation of Seismic Activity and Recent Global Warming
Journal of Earth Science & Climatic Change
Arthur Viterito
April 25, 2016
Abstract
…They (IPCC) add that modelling attempts of past and future climate states are inaccurate and do not incorporate important solar inputs, such as magnetic strength and total irradiance. One geophysical variable that has been overlooked by both groups is geothermal flux. This study will show that increasing seismic activity for the globe’s high geothermal flux areas (HGFA), an indicator of increasing geothermal forcing, is highly correlated with average global temperatures from 1979 to 2015 (r = 0.785). By comparison, the correlation between carbon dioxide loading and global temperatures for the same period is lower (r = 0.739). Multiple regression indicates that HGFA seismicity is a significant predictor of global temperatures (P 0.1). A compelling case for geothermal forcing lies in the fact that 1) geothermal heat can trigger thermobaric convection and strengthen oceanic overturning, important mechanisms for transferring ocean heat to the overlying atmosphere, and 2) seismic activity is the leading indicator, while global temperature is the laggard.
The Correlation of North Magnetic Dip Pole Motion and Seismic Activity
Journal of Geology & Geophysics
Williams B
Abstract
Viterito states in his paper that increasing seismic activity for the globe’s high geothermal flux areas (HGFA)
is correlated with the average global temperature from 1979 to 2015 with a correlation factor r of 0.785 and that this explains 62% of the variation in the earth’s surface temperature. This makes the geothermal
activity the most significant element in the change in temperature of the earth at this time.
Knowing that this is the cause of a major concern for so many and a critical piece to understanding our earth and its processes, the mechanisms surrounding the seismic activity was investigated. It was found that
there is a high positive correlation (r=0.935) between the speed of the North Magnetic Dip Pole
motion and the seismic activity during this time period.
http://www.understandingglobalwarming.com/publicfiles/Williams.pdf
Knock, Knock Vuks are you out there? Check out the above when you get a chance.
You too Dr. S., ref. to the generation of Earth’s magnetic field areas that strengthen or weaken due to viscosity.
My bolds and italics above.
oops link for the first article above
The Correlation of Seismic Activity and Recent Global Warming
Arthur Viterito*
https://www.omicsonline.org/open-access/the-correlation-of-seismic-activity-and-recent-global-warming-2157-7617-1000345.php?aid=72728
Viterito and Williams must have it backwards. Science Daily reports that climate change could increase volcano eruptions. https://www.sciencedaily.com/releases/2017/11/171123095405.htm
🙂
Carla,
For your reading and contemplation.
Earth’s Rotation Is Mysteriously Slowing Down: Experts Predict Uptick In 2018 Earthquakes
https://www.forbes.com/sites/trevornace/2017/11/20/earths-rotation-is-mysteriously-slowing-down-experts-predict-uptick-in-2018-earthquakes/#3b0a54436f24
Whereas the Earth’s surface is not a perfect spherical shell, and internally it is a molten liquid, couldn’t its rotation be expected to periodically vary as the molten interior “sloshes” up against an imperfect spheroidal shell? — as well as correlate with major earthquake frequencies?
Why not divert some time spent on modeling climate change to modeling the interior mechanics of our rotating planet?
Interesting article, but two things weren’t acknowledged, even in the Linked paper:
Both the 2004 Sumatran¹, and tentatively the 2010 Chilean², earthquakes measurably increased Earth’s rotation.
¹http://www.nature.com/news/2004/041229/full/news041229-6.html
²https://m.phys.org/news/2010-03-chilean-quake-shift-earth-axis.html
Much less ignoring volcanism. That’s some massive pressure change.
I recommend people thinking we change the planet now more than it does itself should watch landslide*, iceberg calving, earthquake et cetera videos on YouTube. A few hours of that, gives perspective.
*I watched one from Thailand(?). There’s few decades-old pit mines that have moved as much rock and that one slide did.
I was with my girl visiting Yellowstone. Drive back to Cody, road follows this one distinct bend on the right side of the road (North East) of a tributary. On the inside of this bend was a large flat faced mountain within the inside angle.I
Next morning going back into the park. Hit brakes pull over and take pics. Something around two 15 story office building side one piece section had fallen off. At least with 3′ distance between the new flat face.
I found Griff’s real job.

Where is his man bun?
Are they also measuring the variations in electromagnetic currents flowing through the Earth by means of the solar wind? Perhaps as the magnetic field weakens, the current increases, thus heating up the Earth from within and causing an increase in volcanism and earthquakes. This energy is apparently important to the Earth’s energy budget, too.
aetherwizard November 29, 2017 at 9:35 pm
Shhh you mean a solar effect Shhh quietly…
The mantle rotation pole position. A solar component
https://www.sciencedirect.com/science/article/pii/S1631071317300652
Vincent Courtillot
FernandoLopesaJean-LouisLe MouëlaDominiqueGibertab
open access
Abstract
The direction of the Earth’s rotation axis with respect to the mantle has been studied for more than a century. The time variation of this direction is generally considered to be the sum of three components: the annual wobble, forced by the atmosphere, the Chandler wobble, a free oscillation with a period of 435 days, and the so-called drift of the mean pole. In the present paper, applying the singular spectrum analysis (SSA) technique, we uncover two more components, with smaller amplitude than the three first ones, but well identified, periodic with periods of 11 and 5.5 years, respectively, undoubtedly linked to solar activity. We interpret them tentatively as the result of an exchange of kinetic angular momentum between the atmosphere, in which a flow would be generated by solar activity, and the mantle. The order of magnitude of the required mean winds in the atmosphere computed in the frame of a schematic model is 1 ms−1, compatible with the observed values of the meridional mean circulation.
Agung volcano eruption on 21.11.2017. ?oh=cfab76b383f30ef37175c2e102a493e0&oe=5A93E651
The geomagnetic storm 21.11.2017
Bali must be ready for a strong eruption.
http://files.tinypic.pl/i/00949/vgce2ot9n2o5.png
Our knowledge of the Sun-Earth coupling continues advancing.
Those that think that the solar influence on climate is only exerted in terms of TSI W/m² are hopelessly wrong.
The climate of the Earth depends on the entire dynamic of the Solar System. Jupiter (ancient god of climate) has the last word on the coming of glacial periods through its main influence of the Earth’s axial tilt. He is growing impatient on the human race. A glacial period is slowly approaching. Praying will not help.
There must be more observational data on the energy influx between the Sun and Earth. We are trying to measure only TSI & gravitational tidings, but our geomagnetic field is high unusually massive compare to other rock planets, and that’s cycling a lot of interstellar energy through our core.
Anyone have data? Even a guess? I just have this belief it’s orders of magnitude higher that generally accepted.
Here’s why. Venus & Mars have near absent/negligible fields. Mercury has a field, but faint. Earth, too of course.
What’s the dichotomy to look at to sort this out? Density. Earth is the most dense, Mercury next, then Venus, then Mars. The right dense metals to react with solar winds.
Something I haven’t gone into yet, just a thought, but did the dense metals react and heat from the solar wind or did a radiogenic+pressure heating melt goes to become geodynamos and thus react to the solar wind?
Hmmph! Warming starts before the sun peeks over the horizon if you have a clear blue sky overhead. Atmospheric diffusion. The heating effect is measurable.
Had to re-read the article. No mention of sun’s magnetic influence on Earth’s magnetic field and effect on cloud forming cosmic rays. We seem to be permanently covered in cloud these days.
What altitude does this warming take place? Here in MN the coldest temperature at ground level is almost always about an hour after sunrise when the skies are clear.
But but I thought the science was settled?
Details, details…
Manasvi Lingam and Abraham Loeb (Harvard-Smithsonian Center for Astrophysics and School of Engineering and Applied Sciences, Harvard University) recently published paper ‘Impact and mitigation strategy for future solar flares’.
Abstract:
“We develop a simple mathematical model to assess the economic losses arising from these phenomena over time. We demonstrate that the economic damage is characterized by an initial period of power-law growth, followed by exponential amplification and eventual saturation.”
Claiming that “most of the economic damage arises from advancements in technology. The losses resulting from this factor, which grow exponentially until saturation.”
Their model shows that the advancements in technology will reach saturation point in 150 years. Presumably this is a reasonable assumption.
What is not reasonable is: “We outline a mitigation strategy to protect our planet by setting up a magnetic shield to deflect charged particles at the Lagrange point L1, and demonstrate that this approach appears to be realizable in terms of its basic physical parameters.”(abstract)
Detailed description follows on page 5 of the paper.
So what is this proposed ‘magnetic shield’ ?
It is a massive copper wire coil (weight about 10^5 tones or 100 000 000 kg) to be lifted into orbit and then transported to L1 point. Additionally “an energy source will be required for maintaining the current although, in principle, it could be extracted from the sun by setting up photovoltaic panels in space.”
Not to mention fact that the solar flare may be a million miles wide by time reaches L1 point, and that a contraption of such size would be destroyed by even a smaller flare during its construction in space before it is ‘powered up’ to the required degree, but even if constructed for number of good reasons it’s protective effect would be next to zero.
https://arxiv.org/pdf/1709.05348
This part of the article is incorrect:
“sunspots — dark areas that are often the source of increased solar activity
It’s just the opposite. The sunspots are areas of reduced solar activity, while the associated faculae are areas of increased solar activity. When sunspots reach a certain total area, any further increase in sunspots will actually decrease solar activity as the total area of faculae starts to decrease.
Actually, with all due respect, the article is correct. You are conflating the term “solar activity” with “solar radiation”, which are mutually exclusive concepts.
The term “solar activity” refers solar “activities” related to the Sun’s magnetic field, e.g. sunspots, solar flares, solar wind etc., excluding the normal emission of electromagnetic radiation from the Sun (“solar radiation”).
http://www.dictionaryofengineering.com/definition/solar-activity.html
https://www.ambientweather.com/solarradiation.html
So, to avoid confusion, it would be better to call this non-EMR activity “solar magnetic activity”.
Your claim is not true
The term “solar activity”, when used by solar physicists, always refers to effects regulated by the solar dynamo , the process which generates the Sun’s magnetic field. This process is distinct from the solar thermonuclear process, which generates the Sun’s ‘normal’ electromagnetic radiation emissions.
Sunspots are one of the major solar dynamo effects (i.e., example of “solar activity”) and can regulate (“modulate”) the solar thermonuclear radiation, changing their perceived brightness.
So, the quotation disputed by Javier, …
is actually correct, because certain kinds of solar activity such as solar flares do occur in the vicinity of sunspots much more frequently than in other regions.
Without sunspots, the so-called “solar constant” (https://en.wikipedia.org/wiki/Solar_constant) would actually live up to its name, at least in our human time-frame. :-]
http://www.cdejager.com/wp-content/uploads/2008/11/solaractivandclimate-nethjgeosci.pdf
Why do you think my explanation is wrong?
If one forgets history and the suns behaviour in the past it is possible to believe anything. My understanding is that reduced sunspots and a quite sun over a few cycles gives us ice fairs on the Thames.
With the frivolities comes the crop failures and a lot of misery. The bright side of old Sol having a sabbatical is that the AGW BS will fade into obscurity much like Phlogiston did in the past.
Wayne, while I hope your statement yo be accurate, I observe that the human ability to reason itself into or out of anything, is nearly infinite.
David A
nearly infinite? i think you underestimate it.
But…….But, I thought the science was settled!
I am surprised by the claim that if energy enters and doesn’t leave, the only option is for that energy to appear as an increase in temperature.
This mistake highlights the inappropriateness of the use of temperature rather than enthalpy as a measure of the energy in the system, and overlooks two enormous stores of energy: total biomass and absolute humidity.
It is well established now that increased availability of CO2 leads to an increase in the rate of plant growth. That is energy not returned to space.
It is also true that an increase in the absolute humidity of the atmosphere requires a net input of energy.
If the polar regions warm more than the rest of the planet there will be an enormous increase in the net plant productivity and an increase in the water vapour content of the air. The effects of these factors will produce a radiation deficit measurable with this new instrument.
It is cold in Lincoln UK at the moment and yesterday I had to drive home last night through a heavy snow. Why the long range weather models have not been accurate either this winter or last winter is because they have westerly (zonal weather) built into them, they are just like the climate models that have co2 forcing built into them. The high pressure over North Western Europe has not been pushed south and east easily by low pressure from the Atlantic as the weather models predicted, I would say that this is due to reduced solar activity rather than the weak La Nina in the Pacific Ocean and that they will continue to be inaccurate going forward( I have been following what these models have been predicting on you tube).
“Why the long range weather models have not been accurate either this winter or last winter is because they have westerly (zonal weather) built into them”
Err, no they dont.
They have the global climate drivers “built” into them.
Vis: QBO, ENSO, Solar. The rest is chaos.
BTW: what whould be thte point of building in a zonal PJS….. completely negates the point of a predictive model.