![clip_image002[4]](http://wattsupwiththat.files.wordpress.com/2017/09/clip_image00241.jpg?resize=489%2C357&quality=83 "clip_image002[4]")
NCAR
Guest Post by Clyde Spencer
Because of recent WUWT guest posts, and their comments, I decided to do what I have been putting off for too long – reading what the IPCC has to say about climate modeling. The following are my remarks regarding what I thought were some of the most important statements found in FAQ 9.1; it asks and answers the question “Are Climate Models Getting Better, and How Would We Know?”
IPCC AR5 FAQ 9.1 (p. 824) claims:
“The complexity of climate models…has increased substantially since the IPCC First Assessment Report in 1990, so in that sense, current Earth System Models are vastly ‘better’ than the models of that era.”
They are explicitly defining “better” as more complex. However, what policy makers need to know is if the predictions are more precise, and more reliable! That is, are they useable?
FAQ 9.1 further states:
“An important consideration is that model performance can be evaluated only relative to past observations, taking into account natural internal variability.”
This is only true if model behavior is determined by tuning to match past weather, particularly temperature and precipitation. However, this pseudo model-performance is little better than curve fitting with a high-order polynomial. What should be done is to minimize the reliance on historical data, using first-principles more than what is currently done, doing a projection and waiting 5 or 10 years to see how well the projection forecasts the actual future temperatures. The way things are done currently – although using first-principles – may not be any better than using a ‘black box’ neural network approach to make predictions, because of the reliance on what engineers call “fudge factors” to tune with history.
FAQ 9.1 goes on to say:
“To have confidence in the future projections of such models, historical climate—and its variability and change—must be well simulated.”
It is obvious that if models didn’t simulate historical climate well, there would be no confidence in their ability to predict. However, historical fit alone isn’t sufficient to guarantee that projections will be correct. Polynomial-fits to data can have high correlation coefficients, yet are notorious for flying off into the Wild Blue Yonder when extrapolated beyond the data sequence. That is why I say above that the true test of skill is to let the models actually forecast the future. Another approach that might be used is to not tune the models to all historical data, but only tune them to the segment that is pre-industrial, or pre-World War II, and then let them demonstrate how well they model the last half-century.
One of the problems with tuning to historical data is that if the extant models don’t include all the factors that influence weather (and they almost certainly don’t), then the influence of the missing parameter(s) is/are proxied inappropriately by other factors. That is to say, if there was a past ‘disturbance in the force(ing)’, of unknown nature and magnitude, to correct for it, it would be necessary to adjust the variables that are in the models, by trial-and-error. Can we be certain that we have identified all exogenous inputs to climate? Can we be certain that all feedback loops are mathematically correct?
Inconveniently, it is remarked in Box 9.1 (p. 750):
“It has been shown for at least one model that the tuning process does not necessarily lead to a single, unique set of parameters for a given model, but that different combinations of parameters can yield equally plausible models (Mauritsen et al., 2012).”
These models are so complex that it is impossible to predict how an infinitude of combinations of parameters might influence the various outputs.
The kind of meteorological detail available in modern data is unavailable for historical data, particularly prior to the 20th Century! Thus, it would seem to be a foregone conclusion that missing forcing-information is assigned to other factors that are in the models. To make it clearer, in historical time, we know when most volcanoes erupted. However, what the density of ash in the atmosphere was can only be estimated, at best, whereas the ash and aerosol density of modern eruptions can be measured. Historical eruptions in sparsely populated regions may only be speculation based on a sudden decline in global temperatures that last for a couple of years. We only have qualitative estimates of exceptional events such as the Carrington Coronal Mass Ejection of 1859. We can only wonder what such a massive injection of energy into the atmosphere is capable of doing.
Recently, concern has been expressed about how ozone depletion may affect climate. In fact, some have been so bold as to claim that the Montreal Protocol has forestalled some undesirable climate change. We can’t be certain that some volcanos, such as Mount Katmai (Valley of Ten Thousand Smokes, AK), which are known to have had anomalous hydrochloric and hydrofluoric acid emissions (see page 4), haven’t had a significant effect on ozone levels before we were even aware of variations in ozone. For further insight on this possibility, see the following:
Continuing, FAQ 9.1 remarks:
“Inevitably, some models perform better than others for certain climate variables, but no individual model clearly emerges as ‘the best’ overall.”
This is undoubtedly because modelers make different assumptions regarding parameterizations and the models are tuned to their variable of interest. This suggests that tuning is over-riding the first-principles, and it dominates the results!
My supposition is supported by their subsequent FAQ 9.1 remark:
“…, climate models are based, to a large extent [my emphasis], on verifiable physical principles and are able to reproduce many important aspects of past response to external forcing.”
It would seem that tuning is a major weakness of current modeling efforts, along with the necessity for parameterizing energy exchange processes (convection and clouds), which occur at a spatial scale too small to model directly. Tuning is ‘the elephant in the room’ that is rarely acknowledged.
The authors of Chapter 9 acknowledge in Box 9.1 (p. 750):
“…the need for model tuning may increase model uncertainty.”
Exacerbating the situation is the remark in this same section (Box 9.1, p. 749):
“With very few exceptions … modelling centres do not routinely describe in detail how they tune their models. Therefore the complete list of observational constraints toward which a particular model is tuned is generally not available.”
Lastly, the authors clearly question how tuning impacts the purpose of modeling (Box 9.1, p. 750):
“The requirement for model tuning raises the question of whether climate models are reliable for future climate projections.”
I think that it is important to note that buried in Chapter 12 of AR5 (p. 1040) is the following statement:
“In summary, there does not exist at present a single agreed on and robust formal methodology to deliver uncertainty quantification estimates of future changes in all climate variables ….”
This is important because it implies that the quantitative correlations presented below are nominal values with no anchor to inherent uncertainty. That is, if the uncertainties are very large, then the correlations themselves have large uncertainties and should be accepted with reservation.
Further speaking to the issue of reliability is this quote and following illustration from FAQ 9.1:
“An example of changes in model performance over time is shown in FAQ 9.1, Figure 1, and illustrates the ongoing, albeit modest, [my emphasis] improvement.”
Generally, one should expect a high, non-linear correlation between temperatures and precipitation. It doesn’t rain or snow a lot in deserts, or at the poles (effectively cold deserts). Warm regions, i.e. the tropics, allow for abundant evaporation from the oceans and transpiration from vegetation, and provide abundant precipitatable water vapor. Therefore, I’m a little surprised that the following charts show a higher correlation between temperature and spatial patterns than is shown for precipitation and spatial patterns. To the extent that some areas have model temperatures that are higher than measured temperatures, then there have to be areas with lower than what is measured, in order to meet the tuning constraints of the global average. Therefore, I’m not totally convinced by the claims of high correlations between temperatures and spatial patterns. Might it be that the “surface temperatures” include the ocean temperatures, and because the oceans cover more than 70% of the Earth and don’t have the extreme temperatures of land, the temperature patterns are weighted heavily by sea surface temperatures? That is, would the correlation coefficients be nearly as high if only land temperatures were used?
![clip_image004[4]](http://wattsupwiththat.files.wordpress.com/2017/09/clip_image00441.jpg?resize=318%2C494&quality=83 "clip_image004[4]")
The reader should note that the claimed correlation coefficients for both the CMIP3 and CMIP5 imply that only about 65% of the precipitation can be predicted by the location or spatial pattern. If precipitation patterns are so poorly explained compared to average surface temperatures, it doesn’t give me confidence that regional temperature patterns will have correlation coefficients as high as the global average.
To read any or all of the IPCC AR5, go to the following hyperlink: http://www.ipcc.ch/report/ar5/wg1/
*Intergovernmental Panel on Climate Change, Fifth Assessment Report: Working Group 1; Climate Change 2013: The Physical Science Basis: Chapter 9 – Evaluation of Climate Models
When I was running complex models which were also matched to history, I was taught to do the match by ignoring the last 10 years of available history, and then allowing the model to run forward to see how well it matched actual history over that period of time. As computer horsepower increased we started running multiple models based on alternate descriptions, to create a model ensemble.
What I found after decades of watching how this evolved, how reality departed from forecasts, I concluded the models were only useful as qualitative tools, for two reasons: 1. We really couldn’t describe the system nor the dynamic behavior, and 2. We couldn’t predict the external parameters very well (external parameters being those which were model inputs estimated using other models, or were simple guesses).
Fernando:
With regard to the two reasons you cite above, would it be correct to assume that 2) is a direct consequence of 1) or have I misunderstood you?
The difficulty in creating a computer model stems from the chaotic behavior of the conjunction between the contesting natural cycles. If we could develop a computer model that could accurately shuffle the cards to describe the current climatic situation, when we reshuffle the deck using the same methods the order of the cards WOULD NOT repeat itself as previously. The first order underlying principles would be the same, but each and every run would be different. Will these be close enough to discern a trend? Results have been poor.
” I concluded the models were only useful as qualitative tools,” In other word, it all goes back to the simple maxim that “You cannot model that which you do not understand.” Models based on nothing but conjecture, suppositions and guesstimates are totally useless. However, models limited to known and fully understood physical processes can be quite useful in understanding the relationship between system inputs, system operation, their results.
Joe, I disagree. Models of things one doesn’t understand can be very useful. For instance, if you had a hypothesis – that human emmissions of CO2 are the primary cause of global warning – for example. Then you could build a model based on that assumption, run it for 20-30 years into the future and if it didn’t match reality very well – you have falisfied your hypothesis. That’s it. You were wrong (to paraphrase Feynman). Falsifying hypotheses is one way in which science progresses. But the key thing, that seems to be overlooked (all the flaming time), is that: if your model worked well, it would not prove your hypothesis was true – it would just lend some credibility to the idea, and make further testing and observation worthwhile. We have the great spagetti monster to thank that the global temperatures didn’t continue to rise…then the out of control train of mass stupidness would be barrelling along without any chance of stopping.
Sorry Jay, I have to disagree with you on the credibility issue. That might be true if you fully understood and correctly modeled all of the system functions except one and only had to guess at and parameterize that one function. The probability of getting meaningful data with only a single tuneable parameter are fairly good as your selected value for that parameter approaches reality. However, as the number of ‘guesses’ increases, especially when it reaches the 20 or 30 tuneable parameters in the GCMs, the probability of more than one combination of those parameters correlating with either the past or the future goes up.
I can’t find it now but someone referenced a paper on this site recently that had studied one of the GCMs and found that several combinations of the 30 or so tuneable parameters in that model were at least fairly good at matching the past climate. So, if multiple combinations can match the past, I see absolutely no reason that should not hold for the future as well. Once you have more than one set that matches some portion of reality, if you don’t fully understand those functions and their interactions, how can you tell which is valid and which is/are useless?
I’d like to see the models that have been calibrated against say the last 50 years of recent data to be run from 1850 to see what they predict.
temperature history has been adjusted to show more warming…..they would predict exactly what they are predicting now….run hot
I don’t think there was much if any adjustment prior to 1920. Hence my interest in what would happen.
Why not use the climate models to predict the stock market and use the money earned in place of a carbon tax? Why is “more tax” the solution to every problem? Seems to me that “less tax” would solve a lot more problems.
“Why not use the climate models to predict the stock market and use the money earned in place of a carbon tax? “
You’d have to create a corresponding commodity index that evaluates how well the model predicted the market…and then bet against it.
The people I work for actually do that with two big differences.. our models actually work and we use the money to buy fossil fuels and enjoy this glorious planet.
@ferdberple, Actually I have made a similar point especially when the “using known physical laws” is attributed to Climate Models. Why are you not rich when you can model the well know physical laws that govern a Roulette Wheel? It is all well and good to model using know physical laws, it’s the unknowns and The Butterfly Effect that will catch you out every time!
Climate models are unvalidated and not fit-for-purpose (unless the purpose is political).
IPCC TAR: “In research and modeling of the climate, we should be aware that we are dealing with a chaotic, nonlinear coupled system, and that long-term predictions of future climate states is not possible.”
IPCC TAR: “In research and modeling of the climate, we should be aware that we are dealing with a chaotic, nonlinear coupled system, and that long-term predictions of future climate states is not possible.”
To combat this lets start a carbon tax system, lets add 5 cents on every litre of gas sold, let’s install hundreds of thousands of wind turbines, let’s install hundreds of thousands square kilometers of solar panels – and this surely drop the planetary temperature by 1.5 deg – for what ever that’s worth
The chaos is in the path from one equilibrium state to another and this is what we call weather. What the end state will be is dependent on the sensitivity and we call this climate. Obviously, if you are trying to simulate the weather in a vain attempt to see the climate end state emerge, it will fail and this is exactly what GCM’s attempt to do.
Fitting a model to history is very misleading because given enough degrees of freedom, any model can be matched to any behavior and the worse the unfit model is, the worse its projections of the future will be after being curve fit to the past.
Climate models have absolutely no correspondence to best practices physical modelling, yet the climate science community seems oblivious to this obviously fatal flaw in their methodology.
The idea that the climate system is a non linear coupled system is nothing but arm waving designed to introduce wiggle room so that results that otherwise contradict the laws of physics seem plausible.
First of all, the system is very linear in the energy domain. Each Joule does the same amount of work, in fact, the units of work are Joules and it takes work to maintain temperature, otherwise the system radiates its stored energy away and cools. The system is only non linear when you relate forcing to temperature owing to the non linear relationship between temperature and emissions as a consequence of the SB LAW. I emphasize LAW since SB is an immutable law of physics and there is exactly zero evidence that this law does not apply to the climate system. Look here under ‘demonstrations of linearity’ to see the data (from GISS) that shows how linear the system really is in the power/energy domain.
http://www,palisad.com/sens
The presumed complexity of the coupling between the atmosphere and ocean is another red herring. The sensitivity (climate change per change in forcing) is only relevant as an LTE attribute. Most of the energy stored by the planet is in the oceans and over the course of a year, the energy entering the oceans from the atmosphere will be equal to the energy leaving the ocean into the atmosphere and any NET coupling will be zero. The only reason this becomes a factor is because of the flawed modelling methodology they use.
Let us not get ahead of ourselves, as Einstein commented:
It is unknown whether SB properly deals with gases, nor if it did precisely how it would work out in the volatile mix of Earth’s atmosphere. Our planet is not a blackbody, nor are the gases that make up our atmosphere, and as such we not know whether it applies, or does not apply properly, to our planet’s climate system.
Richard,
SB doesn’t apply to gases as they emit and absorb narrow band energy. Planck spectrums and SB are macroscopic manifestations of interacting electron shells where the degrees of freedom for storing energy increase by so much, the line spectra of gas molecules morphs into the broad band absorption and emissions characteristic of liquids and solids. It can even be considered the limit of collisional broadening. The constraints on emissions are no longer spectral, but becomes based on distributions of probabilistic behaviors.
In the absorption bands, the GHG’s in the atmosphere, and even clouds at all wavelengths. are most trivially modelled in LTE as a semi-transparent mirror between an approximately ideal BB surface and space.
Consider a semi-transparent mirror between an ideal BB and its ultimate output. If the mirror reflects 38.5% of the energy emitted by the surface back to the surface and is transparent to 240 W/m^2 of incoming energy warming the surface, it will accurately model the LTE behavior of the planet over the whole range of total yearly solar forcing received across the planet. In other words, the effective e (1 – .385) is nearly constant across a wide range of stimulus.
It turns out that the atmosphere actually absorbs about 77% of the energy emitted by the surface which is twice what it needs to ‘reflect’ back in order to be in its current state. So, while we can’t model the emissions of GHG’s with SB, the area ratio between the absorbed and emitting surfaces still applies since energy is emitted by the atmosphere over twice the area (top & bottom) from which it’s absorbed (bottom).
And it all works out. 77% of 390 W/m^2 is 300 W/m^2, leaving 90 W/m^2 to pass on through. Half of 300 is 150 which when added to the 90 passing through offsets the 240 arriving. The other half, when added to the 240 arriving is 390 W/m^2 offsetting the emissions of the surface at its average temperature.
More convincing is that this analysis works not only on the planet as a whole, but on individual hemispheres, slices of latitude and even down to the individual cells in a slice.
CO2,
I can grant in your narrow definition of linearity that our climate could be considered thus. But, only in the extreme long term, at some hypothetical future equilibrium state, will the examples you cite be necessarily true. For example, today it’s almost certainly not true that at any given instant of time the joules entering the ocean equal joules exiting the ocean. How else does the ENSO cycle charge and discharge if not an imbalance in energy?
Likewise, whereas you and I probably share a similar conclusion regarding the nature of climate change, remember that the idea that CO2 is “the” control knob is only tenable in a linear system. In the non-linear system described by the IPCC, the idea that a single variable must drive linear changes to the system is nonsensical. So, I guess what I’m suggesting is that the very unpredictability of our climate is evidence, prima facie, that the system is non-linear…and that same evidence also supports the conclusion that there isn’t a single controlling variable.
rip
ripshin,
“But, only in the extreme long term, at some hypothetical future equilibrium state, …”
This is what LTE means and climate change is only relevant to the change in the LTE average surface temperature in response to a hypothetical change in forcing. LTE is the average steady state the system would arrive at it stopped changing, excluding periodic stimulus, the solutions to which are readily deterministic.
Yes, CO2 is definitely not a control knob, but the non linearity between temperature and emissions nor the chaos of weather is specifically why. Incremental CO2 adds a static component, or bias, to the average of the dynamic behavior.
The question is whether the net dynamic ‘feedback’ attenuates or amplifies the change in bias. The net bias is about 0.6 W/m^2 per W/m^2 of forcing where the average of the dynamic feedback seems to be zero around this mean, so the answer is that it’s neither attenuated or amplified.
What modulates and controls the transition of the climate from one steady state to another is the chaos of weather manifested by the hydro cycle as water changes phase. This comprises symmetric, reversible, thermodynamic cycles implementing heat engines manifesting weather, Hurricanes being the limiting case.
There’s no real controlling ‘thermostat’ except for the relationship between temperature and emissions. Storing additional energy increases the temperature and emissions while emitting energy decreases the temperature. Energy is stored when the input energy is transiently more than the output energy and released otherwise.
It attenuates it. That is what I keep trying to explain, that I seem to fail at.
micro6500,
I looks to me like the net dynamic feedback is zero which is neither attenuating or amplifying. This means that incrementally, 1 more W/m^2 from the Sun after reflection, or a change to the system (CO2 concentrations) equivalent to 1 more W/m^2 from the Sun after reflection will result in 1 more incremental W/m^2 of surface emissions. I consider this the theoretical lower limit sensitivity and is about 0.19C per W/m^2. At the maximum ‘feedback’ of 1 W/m^2 of feedback per W/m^2 of forcing, the 2 W/m^2 of total input per W/m^2 of forcing corresponds to a sensitivity of about 0.37 C per W/m^2 representing the theoretical upper limit.
There’s another factor of two that I haven’t talked much about because I don’t need to in order to make a convincing case. This is that the 3.7 W/m^2 of equivalent forcing from doubling CO2 looks like the instantaneous decrease in the size of the transparent window upon instantly doubling CO2. This being the case, in LTE, only half of this is ultimately returned to the surface to warm it while the remaining half escapes out into space, thus the solar forcing equivalent of doubling CO2 is only half of 3.7 W/m^2.
if your doubling increases daily Tmax by 1.1C, and following am Tmin goes up by 0.33C that is 66% attenuation.
Tmax should increase by less than Tmin since higher temperatures take more W/m^2 to sustain than lower temperatures. Consider an ideal BB starting from 0K, the first W/m^2 increases the temperature by about 65C for a sensitivity of 65C per W/m^2. Starting from 288K, the next W/m^2 increases the temperature by only about 0.19C for a sensitivity of about 0.19C per W/m^2. This is simply the consequence of the non linear T^4 relationship between temperature and emissions.
In any event, we only care about how the equivalent average LTE temperature changes which is calculated based on the equivalent BB temperature corresponding the average emission integrated across all of the nights and days over a whole number of years.
None of this matters. It isn’t doing it because of the T^4 power, it’s extracting energy out of the atm column to warm the surface. That’s why.
micro6500,
You’re focusing on short term variability owing to only a small part of the hyrdo cycle. Yes, condensation warms, but evaporation cools and in the steady state the two occur in equal and opposite amounts and combined has no NET effect on either the LTE temperature or the sensitivity.
Everything I talk about is related to how long term averages change and only how these averages respond to change is relevant to climate change. Anything else is noise that only serves to confuse and defocus from the task at hand.
And I also keep showing how the long term average is Min t follows dew points.
More importantly that seems to be lost is how it’s actively regulating temps. Like you would with a transistor
And this is wrong, or at least incomplete.
Water vapor stores heat in the tropics, and then is blown here or there to cool. There’s vastly different changes to surface temps, where it’s blown to cool, and the surface and hemisphere’s are not symmetrical, so it matters to climate, since the ocean cycles are so long, you see the same thing with El Nno’s, all they do is use stored energy to greatly change the measured surface temps, just because the way the wind blew the warm water vapor.
Micro6500,
Differences between hemispheres and the net transfer of energy from the tropics to the poles are all quantifiable, can be considered static and ultimately deterministic properties of the system. El Nino/La Nina seems to be overshooting/undershooting the next equilibrium state, but has little influence on what that next equilibrium state will be.
There doesn’t seem to be a natural thermostat, otherwise, we would see a smaller difference between summer and winter. We do observe a lag between min/max solar input and min/max temperatures, but that’s just the physical manifestation of a time constant.
The test for your hypothesis is to identify where the long term effect of 1 W/m^2 of incremental forcing from the Sun (after reflection by albedo) will result in less than 1 W/m^2 of additional surface emissions.
There does seem to be sort of a natural upper limit on the surface temperatures of oceans in the low 80’s F, above which Hurricanes form dissipating the stored energy.
It’s plainly visible in the data.
How much energy enters the oceans indirectly by way of greenhouse effect forcing from the atmosphere versus the amount that enters the oceans directly by way of absorbed (full spectrum) insolation energy? Then, does atmospheric CO2 even have a detectable role to play in the indirect process?
Thomas,
GHG related energy returned to the surface is exactly that, returned and in principle is no different than be reflected back. It was originally emitted by the surface and microseconds to seconds later, the same energy (albeit as a different photon) is returned to the surface and combined with solar insolation to make the surface warmer than solar can do alone.
The bottom line is that the tenth of a degree or so attributed to all prior CO2 emissions is detectable, but not necessarily discernible from natural variability.
George
I do not strongly disagree with your original post, to the contrary, many good points were made.
My carp is the claim to there being an immutable law of physics That is a very strong claim, and one that I do not accept can be made in such unequivocal terms.
As regards the point regarding long-term predictions of future climate states is not possible. much depends upon how inflexible and narrow meaning one ascribes to prediction and perhaps more significantly what does one mean by climate states?
Thus, if temperature, which is but one of many constantly varying parameters that goes to make up climate, has changed by say 0.2 degC or 0.3 degC or 0.5 degC, is that a different climate state?
What magnitude of change does there have to be to any one or more parameter such that one would say that there is now a different climate state?
Climate is regional, and the IPCC acknowledges that models do not do regions well, and this may lie behind their caveat with respect to chaos.
Isn’t it only when a region changes from one Koppen (or equivalent) classification to another Koppen classification that there has been a change in climate state, at least on a regional basis.
On a global basis, perhaps it is only when one is no longer in an inter-glacial climate, that the globe has changed its climate state.
Richard,
What about COE, the speed of light, the energy of a photon or the mass energy of matter? I consider such relationships immutable first principles and any understanding beyond them must converge to those first principles at the appropriate limits.
SB is one of those first principles relationships. It’s not an empirical formula, but is derived and has been accurately measured. The SB constant itself can be expressed in terms of more fundamental constants, moreover; non ideal black bodies can be precisely quantified by applying an equivalent emissivity less than 1.
Fundamentally, prediction is limited by accurately knowing what will change. Given the trend in the strengths of B-fields around sunspots, the approaching Maunder minimum it suggests is certainly not a predicted change. We can’t really predict volcanoes or impacts and we know that they can have significant climatic impacts as well.
Any change in the stimulus or the system, even that incrementally approaching zero, manifests a change in the LTE output of the system and a transition to a new steady state. Note that the steady state is not a constant value, but is the average periodic response to periodic seasonal change. This steady state periodic response does have an average and changes to this average are representative of changes to the stimulus (solar forcing) or equivalent changes to the transfer function (CO2 concentrations).
Richard,
There are some climate zones, such as the Atacama Desert, bounded by the Pacific Ocean and the Andes Mountains, that have fairly hard boundaries. There are others where the changes are gradational, and may even move back and forth through the years. I think that the climate zones with the more fuzzy boundaries are more subject to reclassification, or at least having the boundaries re-assigned. When the day comes that weeping willow trees are found to be growing abundantly in what we now call the Sahara Desert, we can be certain that the climate has changed for that climate zone. I have previously suggested that instead of citing global averages for variables like temperature, we should be tabulating how much each and every Koppen climate classification is changing.
“. Another approach that might be used is to not tune the models to all historical data, but only tune them to the segment that is pre-industrial, or pre-World War II, and then let them demonstrate how well they model the last half-century.”
exactly.
Every modeler is taught that he MUST split the data in two parts, one used to fit the model, the second used to verify that the fit is not overlearning (aka “fitting the elephant”).
A model that didn’t used this standard (I repeat: standard!) procedure is just crap, and the modeler just a con artist.
Agreed. I used to use something similar for Futures Market trading. You have to split the data into two halves to get anywhere near predictive. You also have to determine the length of the first half of the data that repeatedly works. This is a bit like a moving average, as new data comes along you need to drop the oldest data accordingly. Of course for this to work you need thousands of data points and back tests.
One hundred years of climate data simply doesn’t cut it.
PS, Even with thousands of data points and back tests there is no way you could project this 25, 50,100 years into the future.
it seems the modelers tuned to the rise in temperatures 1976 to 1998, then hindcasted back from there with additional tuning, for example aerosols. Result is future forecasted to warm five times as fast as the past.
https://rclutz.wordpress.com/2015/03/24/temperatures-according-to-climate-models/
Ron C wrote:
“it seems the modelers tuned to the rise in temperatures 1976 to 1998, then hindcasted back from there with additional tuning, for example aerosols. Result is future forecasted to warm five times as fast as the past.”
I suggest this edit:
“it seems the modelers tuned to the rise in temperatures 1976 to 1998, then hindcasted back from there with additional tuning, for example FALSE FABRICATED aerosols DATA. Result is future forecasted to warm five times as fast as the past.”
Re aerosols:
Fabricated aerosol data was used in the models cited by the IPCC to force-hindcast the natural global cooling from ~1940-1975). Here is the evidence.
EVIDENCE OF FALSE AEROSOL DATA
http://wattsupwiththat.com/2015/05/26/the-role-of-sulfur-dioxide-aerosols-in-climate-change/#comment-1946228
Every modeler is taught…….the people doing this are not modelers
I thought Gavin Schmidt (?) was hired as a computer expert when he was hired by Hanson.
Why just split it into 2 parts? My thought is to split it into 3 parts. Use the middle 50% to set up the model and then see how well you do predicting/projecting the first 25% and the last 25%.
As soon as you use the validation data to select one model over another, or one set of tuning parameters over another, the validation data becomes training data. In this case what you think is validation is in fact a form of manual curve fitting via selection.
very true, and always disregarded.
Tilting at chaos is a wind turbine to far!
saying that “performance can be evaluated only relative to past observations” is a self serving, out-of-the-hat, pretext not to submit models to REAL predictibility tests. This is rubbish, like everything other spins the goebel warmers put out to defend their Nintendo “science”. As it has been said, models can very well be evaluated by using only data prior to 1980 then let’s see how they fare in simulations of climate from 1981 up to now.
But modellers won’t never submit their garbage to such tests because they know the only result is garbage. What a travesty, horribly costly one at that.
It will be interesting to see how the haters find ways to blame the skeptics for this.
Regarding predictive skill, the models are not improving.


Hansen et al., 1988…
CMIP3 initiatialized to 2000…
CMIP5, initialized to 1979-84…
CMIP5…
CMIP5 RCP4.5…
From Hansen et al., 1988 to CMIP5 in 2017, the 2016 El Niño spikes toward the model ensemble mean (P50)… Despite the fact that it was an extremely low probability weather event (<2.5%). This happens irrespective of then the models are initialized. Whether the models were initialized in 1979 or 2000, the observed temperatures all bounce from the bottom of the 95% band (P97.5) toward the ensemble mean (P50) from about 2000-2014 and then spike to P50 or slightly above during the 2016 El Niño.
David,has anyone tried to eyeball what the models would predict…using raw temp data?…not adjusted data
Lat… exactly. Everyone of the graphs above ar nothing but representations of a virtual world that does not exist!!!
If they were playing mindcraft, they’d be doing great …. but as we know reality and computer virtual worlds are not the same thing.
Baseline temperatures in the various models vary up to 3 deg. C, Latitude. This means that the physics of those models have to vary greatly. Truly virtual worlds, not ours.
It’s not just the adjustment of data, it’s the sparse collection of it. There is nowhere near the necessary collection of data available to adequately model what weather actually accomplishes over land, much less oceans.
Dave, do you have any data comparing models to UAH? This would seem to be the only data that hasn’t been massaged to match the models.
I think Ross McKitrick ran some UAH comparisons. There’s a link somewhere in these comments.
https://judithcurry.com/2017/09/26/are-climate-models-overstating-warming/
UAH = black
RSS = blue
David,
Your last graph in particular speaks to an exchange with Nick Stokes in a recent post. First, the El Nino and La Nina temperature excursions don’t appear to be symmetrical. The behavior of the 1998 El Nino spike is exactly what I speculated one could expect. Whereas, the 2016 El Nino spike strongly suggests that the upper-bound for the forecast range is much too high, as is the mean value. It would appear that the model(s) is/are running about at least 0.2 deg C too warm. That doesn’t seem like a lot; however, over 100 years that would amount to a 20 deg C overestimate!
0.2 C/yr adds up pretty quickly!
And averaging the outcome of a bunch of runs of different models (with different tuning) and calling it anything meaningful is just cr@p to the nth power!
+1
Even better is splitting the data set into three: training, validation and test. That’s how it is done in machine learning and (serious) predictive modelling.
“- Training Dataset: The sample of data used to fit the model.
– Validation Dataset: The sample of data used to provide an unbiased evaluation of a model fit on the training dataset while tuning model hyperparameters. The evaluation becomes more biased as skill on the validation dataset is incorporated into the model configuration.
– Test Dataset: The sample of data used to provide an unbiased evaluation of a final model fit on the training dataset.”
https://machinelearningmastery.com/difference-test-validation-datasets/
If the models are hindcast to match GISS et al through to the 1940’s ….
They are always going to be WRONG.
Real temperature data had a large peak though the 1940’s then cooling to the mid-late 1970s
This has been has been systematically removed to create an unreal warming trend since the 1940s
If models don’t recreate that peak… they are going to be meaningless at any sort of prediction.
Right – the appearance of model fit to observations – such as it is – is one of the intended consequences of the rampant fraudulent adjustments to the surface temperature datasets.
That 1940’s warming “blip” was formerly consensus science. And then it was disappeared.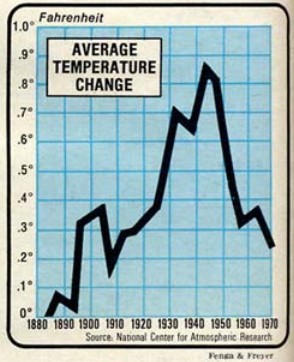
And now for my next trick.
And just to be complete, here is the leak of the private discussion among the creators of HadCRU, demonstrating their deliberate intent to remove that 1940’s warming, via manipulation. It’s always good to put this story out there, repeatedly:
http://assassinationscience.com/climategate/1/FOIA/mail/1254108338.txt
That’s a very astute point.
Oh, yes. For whatever reason,the 1940-75 drop in temperature was eliminated, so the models are being run with an unphysical input, so it seems obvious that that unreality will persist in the forecast model outputs.
Very good point, hind casts may only work if adjusted to real natural observations,
The models will never be able to recreate a temperature trend that was made up, not naturally occurred. Until this is resolved the models will never match observations for future scenarios.
1) Peak warming trend around the 1940’s reduced. (should be about 0.2 c – 0.3 c warmer)
2) Cooling between the 1940’s until 1970’s almost removed completely. (should be about 0.5 c cooler)
3) Recent peak should be around 1), but because of adjustments to 1) and 2) they are way out.
4) Reducing by 0.5 c in 3) makes the trend after look 0.5 c warmer than it would otherwise been.
5) Recent warming on surface has about an additional 0.2 c artifact. (up to 0.4 c on GISS)
6) Past ERA40, NCEP/NCAR and CRO global temperatures showed the difference between 1) & 2) of ~0.8 c.
7) This value in 6) has continually reduced over the decades since, before the global warming scare began.
Its a loverly Catch22 situation, isn’t it.
Fix the temperature series… the AGW farce goes away, but at least their models might stand a chance of working
Don’t fix the temperature series.. and their models will always be wrong
Delicious ! 🙂
We must respect the fact that a vast amount of work over three decades has now gone into tuning the data to fit the models.
And then to tune the models to fit the data which has been tuned to fit the models.
And so on.
Eventually they’ll get a perfect fit. For sure.
Whilst reality may potentially have been completely abandoned, in the process.
Even bigger is their parameterization of water/ air boundary and added mass conservation, this is how they control the positive water feedback. As water molecules jump into the air, some % fall back into the water. They adjust this to increase the amount that stays in the air. Causing warming.
The models are likely very good with a broad stroke. The entire application to the changes that have occurred or are expected is on the order of 1K out of 300K. The fact that the models are useless when better than 99% accuracy is required is not surprising. However, until they get to that level they are not a useful tool for the problem. Right of the bat there isn’t an IR computational program that claims 99% accuracy, and certainly not one that computes to that level in the active region of the atmospheric spectrum. The highly absorbing region will be computed empirically, not ab initio, and the non-absorbing region will be computed ab initio, then the two will be combined to provide a spectrum. The papers supporting the computational program will not claim 99% accuracy. At that level the result will be in the noise of the computation.
The complexity of the US tax code has been increasing – does that make it better? I suppose that depends on where one stands.
Think of all the accountants, tax lawyers, etc. who would be without jobs without an overly complex and burdensome tax system! I mean, where are your priorities?
The complexity of the tax code is not accidental. It is easier to govern a population in which those that are governed don’t know the rules and cannot hope to.
Edward Norton Lorenz was a pioneer climate modeller and discovered chaos theory as a result of trying to model the climate. In his last interview he laid out conditions under which climate modelling might be valid. The IPCC models don’t meet the test. In fact, Judith Curry uses Lorenz’ remarks to point out the circularity of the IPCC’s reasoning. link
‘Celestial spheres’ were introduced to model the paths of celestial bodies, including planets, with the underlying geocentric assumption. The model worked quite well. Does this confirm the geocentric assumption and the existence of celestial spheres?
John von Neumann:
“With four parameters I can fit an elephant, and with five I can make him wiggle his trunk.”
The “new and improved” models only show an aceptable skill (do they really?), because of all the adjustments made to the data(!) and the fudge-factors. They are totally divorced from first-principles. Therefore they are inappropriate to support the Reality-Haters claimes.
Indeed, and the symptoms are described right there:
Or in other words, they enough parameters to make the elephant sing, dance, and blow kisses at the audience.
You possibly don’t want to fit to a LOT of parameters. The more variables, the more potential inflection points in the curve. I suspect that if you fit to a lot of parameters, you may end up with pretty good correlation over the range of the “training data” and a curve whose behavior outside the range of the training data is influenced mostly by a handful of initial and final data points.
I could be wrong about that. I’m not much of a mathematician
DK,
That was exactly the point I was trying to make about the behavior of polynomial fitting.
You are NOT wrong!
That’s exactly the point. And even if the results of these kind of models outside the range of the “training data” matches the real world observations pretty well (like a lot of neural networks do) it’s due to some black-box fudging and no vindication for the alleged underlying first-principles.
So when is Lord Stern going to lower his future economic impact cost of CO2 now that it is clear his projections are based on exaggerated models?
Shooting down the models will not have much effect, except on those already capable of understanding the technology. More effective by far would be to address the import of the long-term (glacial/interglacial) history. Laymen are likely to understand that what has happened repeatedly over millions of years — without mankind’s influence — is almost certain to happen again. the layperson is also likely to be impressed by the magnitude of sea level changes associated with glacial periods: at the depth of the most recent glacial excursion, sea levels were about 400 feet lower than they are now. Let’s drag some paleoclimatologists into the present to work with public relations folk on ways to educate laypersons on climate change reality.
“Let’s drag some paleoclimatologists into the present to work with public relations folk on ways to educate laypersons on climate change reality.”
With respect, no. With regard to the layman, employ the KISS principle which precludes scientists and scientist-speak.
Rather, educate the layman that according to the very scientists who are pushing AGW the following is true:
1) Scientists admit they do *not* understand how earth’s climate works, period
2) Scientists admit predicting future climate states (temperature) is *impossible*
3) Scientists admit that the only evidence they have for AGW are software models *programmed by men*
4) Scientists admit they don’t have the computers to run the models that don’t work anyway
5) Scientists admit that even if they had 3) and 4) they can’t test the software models for accuracy
I know I’m beating a boring drum around here, but I am a layman and speaking as a layman, the best education I received was the following statement from the IPCC. Before I read this I didn’t believe the hype of AGW, but neither could I get past the first objection the average layman will pose, e.g., “Well YOU’RE not a scientist, how do YOU know so much, HUH?!?!”
I know because they told me:
“In sum, a strategy must recognise what is possible. In climate research and modelling, we should recognise that we are dealing with a coupled non-linear chaotic system, and therefore that the long-term prediction of future climate states is not possible. The most we can expect to achieve is the prediction of the probability distribution of the system’s future possible states by the generation of ensembles of model solutions. This reduces climate change to the discernment of significant differences in the statistics of such ensembles. The generation of such model ensembles will require the dedication of greatly increased computer resources and the application of new methods of model diagnosis. Addressing adequately the statistical nature of climate is computationally intensive, but such statistical information is essential.”
http://ipcc.ch/ipccreports/tar/wg1/505.htm
“The generation of such model ensembles will require the dedication of greatly increased computer resources and the application of new methods of model diagnosis.”
And that has not happened.
“The generation of such model ensembles will require the dedication of greatly increased computer resources and the application of new methods of model diagnosis.”
And all those greatly increased computer resources and new methods of model diagnosis will do is enable us to get the wrong answer quicker.
Such is the way of effectively infinitely large open-ended non-linear feedback-driven (where we don’t know all the feedbacks, and even the ones we do know, we are unsure of the signs of some critical ones) chaotic systems – hence subject to inter alia extreme sensitivity to initial conditions, strange attractors and bifurcation.
Forrest,
I agree with you about accumulating straws. This is my 8th posting and each one has dealt with a different topic. I’m hoping that, by documenting how many things are wrong with the alarmist’s supposed consensus position, it will become evident to those who either have not taken sides, or perhaps even those who conditionally support the supposed consensus, just how insubstantial the evidence is. That is, it is my hope to contribute to a preponderance of evidence that the AGW argument is too weak for one to unquestionably support it.
It would be nice if Global Warming Enthusiasts bothered to read the document they use to justify their beliefs. If they did, perhaps their beliefs might be a bit shaken.
“The way things are done currently – although using first-principles – may not be any better than using a ‘black box’ neural network approach to make predictions, because of the reliance on what engineers call “fudge factors” to tune with history.”
Little more than a tweakable “black box” of encoded but non-validated guesstimation (a small amount of rationality mixed with a huge amount of tweakable codified guesstimates).
At least with models that really do curve fitting (a la Jennifer Marohasy (http://jennifermarohasy.com/2017/08/recent-warming-natural/) and the rest) the idea is to tease out the basic variation parameter and build a model that can be verified and validated by both the past temperatures and the coming events.
The other gross problem is the unerring belief the ‘global temperature’ is (somehow) climate — it is not, alone it is just a meaningless figure. Climates and their changes are regional elements of weather persistence (or variability), and as such are the result of many influences including the temperature shift.
But on it’s own temperature is not climate! And temperature is NOT energy!
Until grid cells get down into the sub centi-meter range. Any hope of modeling from first principles is futile.
Unfortunately, computers will have to get several trillion times more powerful before grid cells can get anywhere close to that small.
It is an exercise in futility anyway, if the underlying basic principles are misunderstood then no amount of finer graduation of the grid will help.
Take for instance a very simple example…
Say a 0.1°C change in temperature ultimately causes a persistent but minor directional shift of below 1 degree in the prevailing winds across all temperate zone areas during the summer months. Would this minor weather effect be an indicator of a change in climate? Would anyone notice a change in prevailing wind direction at less than a degree level?
And similar could be said of oceanic currents, or minor but persistent changes in cloud cover that only affect a particular region, etc, etc…
MarkW,
No, they only have to get down to a spatial resolution of one meter. That is the standard measure of forcing — watts per square meter. 🙂
They need to small enough to accurately describe the physical processes going on in them.
The fact that forcing is typically measured in watts per square meter is meaningless in this context.
MarkW,
I guess you missed my ‘smiley.’
If the complexity being added to models, is an attempt to match up with the complexity of the climate, than there is a chance that the models are getting less inaccurate.
If it’s just complexity for complexities sake, then things are getting worse.
Does this modeling take into account wind patterns and changes thereto? Does it include humidity levels changing on a monthly, weekly, or daily, basis? Or even a seasonal basis?
When you have a system as complex as an Earth-type planet inhabiting the Goldilocks zone around a central yellow dwarf star like ours, these things are part of a chaos pattern, not something that a computer program can take into account. Chaos does not care about data points. This is why some glaciers are growing and others are stable or continuing to lose size.
The chief meteorologist at a local station (really good as a weather guesser) said yesterday that there is still no explanation for why Harvey increased to a Cat 5 as rapidly as it did, and ditto Irma. It may have been the low pressure in the eye that dropped even more as those two storms moved, or there may have been several other factors included. Meteorologists deal with facts, with real world information, and with the variables in weather that are constantly changing.
I would be less likely to view the IPCC’s climate modeling if they stopped fudging their data to suit their needs for cash and the fact that their own software fails to account for geological and topographical variables, but instead relies on something called “smoothing”. You cannot expect a chaotic planetary system like ours to follow a computer prediction.
Eeewww, didn’t proof read. Not enough caffeine! That should be “I would be less likely to view the IPCC’s climate modeling with a very leery eye if they stopped….”
Sorry about that!