(and other nonsense from Australia’s Bureau of Meteorology, the University of Melbourne and The Conversation).
Dr. Bill Johnston[1]
Main points.
- Australia’s Bureau of Meteorology and climate scientists at the University of Melbourne should know that nowhere on planet-earth could rainfall be less than none!
- The Bureau’s latest Seasonal Summary (winter 2017) spuriously claims rainfall is ‘very much below average’ or the ‘lowest on record’ at locations such as the Pilbara coast of Western Australia, where median rainfall for June, July and August is zero; or across the northern 2/3 of the continent where zero winter rain occurs in 10% or more years.
- Australia’s latest record-hot winter is evidenced by a “hottest ever winter day” maximum temperature of 39.6oC reported by an automatic weather station (AWS) at Mandora on 24th August 2017. Mandora in the middle of nowhere is surrounded by salt marsh to the north and desert to the west and daily data are not available from climate data on-line. The same AWS reported record-low maximum temperatures of 0oC on 19 July 2008 and again on 29 November 2010; colder than all but one minimum temperature value (-0.6oC on 21 July 1965)!
- The AWS is unreliable. Careful analysis shows Mandora’s low quality data are not fit for estimating trends, frequency of extremes or trends in extremes.
Between Broome and Port Hedland on the Pilbara coast of Western Australia is a lonely AWS near an unsealed airstrip (Latitude -19.7419, Longitude 120.8433). North is a 6 km-wide salt marsh bordering the Indian Ocean; east is a homestead and sheds surrounded by watered lawns and beyond, extending over the horizon is red-sandy desert. Like most AWS, Mandora’s is serviced perhaps once/year; and get this: the station-summary says that between 26 July 1999 and 19 November 2016, air temperature failed field performance checks three times and rainfall failed 10 times; so for periods between infrequent visits it is probably wrong. (Maximum (Tmax) and minimum (Tmin) thermometers were removed in 2012.)
Etched forever into the Bureau’s records is that the AWS located in a dusty paddock, in the middle of nowhere, at a place that hardly anyone has heard-of; and whose data isn’t accessible from climate data on-line, reported Australia’s hottest-ever winter-day on the 24th August 2017 (39.6oC). Furthermore, that single number is the only evidence proffered in the recent Seasonal Climate Summary supporting the Bureau’s claim that 2017 is Australia’s warmest winter on record. (To get data and replicate the following analysis search for station number 04019.)
[Interestingly, the same AWS recorded probably the record-coldest maximum temperature for all but Australia’s alpine areas of 0oC on both 19 July 2008 and 29 November 2010.]
So just how bad is Mandora’s data?
It hardly ever rains in August. Since 1914, 76 years received zero August rain; 20 years received less than 10 mm; while only a couple of years received anything like enough to bog a duck (highest August rainfall was 73.9 mm in 1930!) Across the winter months of June to August median monthly rainfall is ZERO. Less than 5 mm/month is recorded in 75% of years. Fair to say winter is dry generally.
Zero winter rainfall is normal across the Pilbara (and not unusual across the northern two-thirds of Australia). Given that nowhere on the planet can possibly receive less rain than none; how can the Bureau claim winter rainfall in 2017 is the lowest-on-record or very-much-below-average (Figure 1) when zero is zero and for much of inland Australia no winter-rainfall is normal?
And how could Dr. Andrew King, research fellow at the ARC Centre of Excellence for Climate System Science at the University of Melbourne (who is interested in climate extremes and their attribution to human induced climate change); with his Master of Meteorology from the University of Reading and PhD in climate science from the University of New South Wales possibly conduct a conversation on The Conversation without checking the veracity of data he used?
(See: http://theconversation.com/australias-record-breaking-winter-warmth-linked-to-climate-change-83304)

Even winter hot-spots like Bourke Post Office in north-western NSW, receive less than 5.4 mm of rain/winter month in 25% of years; and less than 1.3 mm in 10% of years. That climate change causes less than zero rainfall is an interesting but obviously fake hypothesis.
About Mandora’s record winter heat.
From 1962 until June 2001 thermometers housed (probably) in a large (0.23 m3) Stevenson screen were observed inside the homestead-paddock near areas that are watered. The replacement AWS and small (0.06 m3) screen is about 15 m outside the fence, surrounded by bare red soil. Thirteen of 40 years of pre-AWS data had less than 300 observations/yr; 28 had less than 330/yr. Missing data after 2001 indicates the AWS broke-down frequently or that out-of-range data were culled. Nine of the 16 years to 2016 have less than 335 observations/yr (equivalent to a missing month).
For the 55 years of data, average Tmax is uncorrelated with rainfall and the relationship explains only 4.6% of Tmax variation (vs. >50% for a consistent well-maintained site) (Table 1). Lack of significance is caused by missing data, poor site control (possible watering on hot days; poorly maintained equipment etc.) and possible lack of observer-diligence. Outlier data are coarsely identified by elimination: years with less than 330 observations don’t reflect the weather; 1980 and 2011 (N=348 and 336 observations/yr) also identify as statistical outliers (Table 1).
Table 1. Effect of missing-data on relationships between Tmax and rainfall; and Tmax, sites and rainfall. (ns, not significant; *, P<0.05; **, P<0.01; ***, P<0.001 (significant to highly significant); variation accounted for is the R2adj statistic. Data for 1980 (348 obs/yr) and 2011 (336 obs/yr ) are statistical outliers.)
| Tmax vs. rainfall alone | Significance | Variation accounted for (%) |
| All years of data | ns | 4.6 |
| N >= 300/yr | ** | 13.7 |
| N >= 320/yr | * | 12.1 |
| N >= 330/yr | ** | 20.6 |
| N >= 340/yr | * | 24.5 |
| Tmax vs. Site + rainfall | ||
| All years of data | * | 23.8 |
| N >= 300/yr | ** | 27.8 |
| N >= 320/yr | *** | 29,9 |
| N >= 330/yr | *** | 45.2 |
| N >= 340/yr | ns | 56.2 |
| N >= 330/yr & not 1980 or 2011 | *** | 77.3 |
Multiple changes happened in June 2001 (the site moved outside the fence; the large screen was replaced by a small one and a single electronic AWS probe replaced thermometers) and independently of rainfall, average Tmax stepped-up 0.66oC in 2002. Thus there are three data groups: (i) 28 of the 55 years have less than 330 observations/yr; 1980 and 2011 are also outliers; (ii), thermometers in a large Stevenson screen are observed before June 2001; and (iii), after 2001 temperature is reported by an AWS/small screen at the relocated site (Figure 2).
As more than half the years are missing substantial numbers of observations, it is questionable that Mandora data are fit for the purpose of estimating temperature trends, frequency of extremes or trends in extremes.

Figure 2. Three classes of data are shown in the left panel; data before 2001, where N>330 observations/yr (grey circles); sound data after 2001 (green triangles); and outliers (including 1980 and 2011) (open red squares; solid after 2001). Rescaled rainfall residuals in the right panel embed a step-change (solid line) in 2002, which aligns with site changes in June 2001 (dotted line). The main cause of variation is missing data.
Winter (June to August) probability density plots (smoothed frequency histograms) and percentile differences [AWS percentiles (from 1 June 2001 to 31 August 2017) minus pre-AWS percentiles (1 June 1984 to 31 August 2000) about 1400 data-days per tranche] visualise how data changed after 2001 (Figure 3).
Pre- and post-AWS Tmax distributions (Kolmogorov-Smirnov non-parametric test) and medians (Mann-Whitney test of central tendency) (29.4 oC vs. 30.3oC) are different (Psame <0.05). Tmin distributions are the same, but medians may be offset 0.3oC, which is immaterial (Psame = 0.04) (Figure 3). AWS-Tmax less than the 75th pre-2001 percentile (31.5oC) is stepped-up generally by 0.5 – 0.8oC but at higher temperatures the difference for the warmest 3% of daily values declines to within the error bandwidth (+/- 0.2oC). AWS-Tmin less than the 25th and warmer than the 75th pre-AWS percentiles (11.0oC and 16.0oC) is biased low.
Extreme Tmax and Tmin values (28 August 2017 and 7 June 2016) are about 1.5oC over-range (o/r) relative to the general distribution (and trajectory) of respective data percentiles. So both values are rank-outliers (data-spikes). There is no test as such for a single outlier; however, as AWS temperatures >75th percentiles consistently trend down relative to pre-AWS data there is no likelihood that such extremes are representative of respective data populations.

Figure 3. Probability density plots of Tmax and Tmin calculated over identical ranges for about 1400 data-days each side of the site change on 1 June 2001 (a); P refers to the Kolmogorov-Smirnov non-parametric test for equal distributions. Percentile temperatures are daily values ranked by 1%-frequency increments: 1% of observations are less than the 1st percentile; 2% are less than the 2nd percentile and so on. Percentiles calculated for about 1400 data-days each side of the June 2001 changepoint are differenced [AWS minus pre-AWS percentiles (which is the reference)] in (b). (Pre-AWS quartile temperatures are shown.) Possibilities are that differences are random around zero or an offset; random for a segment of the data-range; or systematically biased – the difference increases (reduces) with the temperature being measured, over all or part of the percentile range.
Discussion.
Rainfall can’t be less than none. For climate zones where zero winter rain is normal (or highly unlikely) claims of ‘very much below average’ or ‘record-low rainfall’ in winter2017 are misleading.
Rarely serviced AWS in dusty paddocks are unreliable. It is unlikely that maximum temperature on both 19 July 2008 and 29 November 2010 was truly 0oC. Supported by percentile analyses, it is also unlikely that the “hottest ever winter-day” temperature of 39.6oC lies within the Mandora AWS percentile bandwidth. It’s a shame that Dr. Andrew King, research fellow at University of Melbourne would blindly support such a fragile argument on The Conversation without first checking veracity of the Bureau’s data. (Nice map Dr. King but mostly a work of fiction!)
[1] Former NSW Department of Natural Resources research scientist. Due to his scientific approach to data analysis, Dr Johnston is proud to be banned from commenting on The Conversation’s conversations.
Shows what charlatan climate activists they have in the group BOM. The reason Australia is mostly desert because it is normal to have no rain for months. Trying to claim a desert is much drier than normal speaks volumes of the intelligence involved with some of these alarmists. There is no doubt alarmists are increasingly desperate from the garbage that keeps getting reported.
There is scientific evidence that the main reason for recent warming is not down to increase in energy, but a decline in water vapour contained in the atmosphere. Many countries show increased sunshine levels and decreased RH levels explaining the warming. It is not known was it causing this, but it is opposite of AGW conjecture.
Why is this significant?
For one it explains that AGW has nothing to do with the warming and two, the mystery why optimum warm periods during inter glaciers always cool soon after. It also explains how ice ages occur by declining water vapour in the atmosphere leading to increasing dust levels.
We could be experiencing a long term decline in global water vapour atmospheric levels that eventually leads us to the next major ice age. The reason being declining water vapour causes temperatures to increase even with the same amount of energy involved. This is the first phase where warming peaks in the optimum interglacial period. Continued declining water vapour and increasing dust levels in the atmosphere reached a threshold that favours cooling rather than warming. This triggers the end of the optimum warm period. Now the planet not only increasing atmospheric dust levels and declining water vapour also cooling too. This continued pattern is difficult to get out off and leads to the next Ice age. The question remains what could trigger this in the first place and keep it in place long enough?
In Figure 2, the r² of 0.78 looks optimistic. The scatter diagram resembles a shotgun blast more than well-correlated data.
True (sort of). The R^2 value is ex-the missing and faulty data years (red squares). Including faulty data there is no relationship (which is the point of Table 1).
Cheers,
Bill
Hey, Aussie BoM-shut up and dust off your skis…! http://www.mtbuller.com.au/Winter/snow-weather/snow-report
“So just how bad is Mandora’s data?
It hardly ever rains in August. Since 1914, 76 years received zero August rain; 20 years received less than 10 mm; while only a couple of years received anything like enough to bog a duck (highest August rainfall was 73.9 mm in 1930!) Across the winter months of June to August median monthly rainfall is ZERO. Less than 5 mm/month is recorded in 75% of years. Fair to say winter is dry generally.
Zero winter rainfall is normal across the Pilbara (and not unusual across the northern two-thirds of Australia). Given that nowhere on the planet can possibly receive less rain than none; how can the Bureau claim winter rainfall in 2017 is the lowest-on-record or very-much-below-average (Figure 1) when zero is zero and for much of inland Australia no winter-rainfall is normal?”
What a mind bogglingly stupid thing to say (and publicly). Reread your text.
What don’t you understand Bruce?
Median rainfall in June, July and August (individually) is zero. So (over) half the years experience zero rain. That being the case for average years, how can rainfall in 2017 be very much below average (or record low, when the average expectation (median) is zero)?
Other weather stations having similar rainfall distributions (medain = zero/month for June to August) include for example, Darwin, Alice Springs (above average this winter), Birdsville and Marble Bar. Respective monthly medians (mm) for Longreach is 1.2, 0 and 0.2; Rockhampton, 8.9, 4.0 and 4.6; Thargomindah, 2.5, 1.5 and 0,7; Tibooburra, 2.5, 0.8, and 1.4; and Barcaldine, 2.3, 0.6 and 0.1.
Of course I have not not analysed every weather station across northern Australia, but for those listed,rainfall in winter 2017 was either not significantly different from or greater than their median values.
There is no such a thing as rainfall being very much below average (=zero).
Cheers,
Bill
The satellite trend for Australia to July shows the El Nino effect but the overall trend since ~2002 is flat.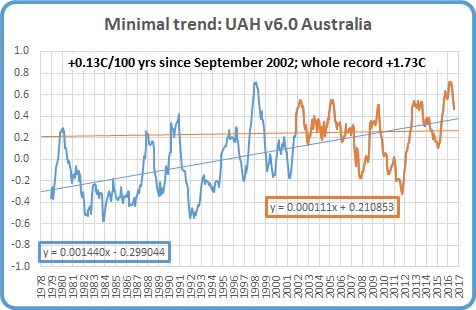 ?w=450
(Ken’s Kingdom).
Don’t know if it’s any use finding BOM stuff ups and exposing them , they will just announce another enquiry and three years later they will release the report to themselves which will say what a wonderful job they do .
Averages and anomalies seem a mite meaningless for sites such as this.
I downloaded the BOM’s rainfall records for the Mandora site ad note:
Total days of records: 38250
Days with 0 rainfall: 32310 (84%)
Days missing data: 3558 (9%)
Highest rainfall: 281.4mm (6th March 2000)
ANY rain at this site could be considered an outlier.
It seems that this site is generally rain free and the occasional storm comes through.
I am a regular traveler in the Mandora area, which adjoins the Great Sandy Desert, a spectacular area containing desert vegetation of wattles, highly resinous spinifex grasses and Eucalyptus species. Fires devastate the area on a regular basis, so this AWS station is compromised a lot. It is also one of the most common landing points for strong cyclones during the wet season.
But there are multiple problems with the site. Moat years are missing significant numbers of observations; the AWS reported zero MAXIMUM degC, twice; the “highest ever record winter temperature in Australia” is clearly an outlier too.
It is just bad data from a poorly maintained weather station stuck in a dusty paddock in the middle of nowhere that they plucked off the shelf to support their press release..
Cheers,
Bill
Due to a modelled wind change, some parts of northern NSW will get to 40c this w/e. Yet more proof of AGW.
If recent hurricanes are stronger because of global warming then I declare this cold event colder because of global warming.
http://www.wrh.noaa.gov/climate/monthdisp.php?stn=KBOI&year=2017&mon=9&wfo=boi&p=temperature
“Australia’s Bureau of Meteorology and climate scientists at the University of Melbourne should know that nowhere on planet-earth could rainfall be less than none!”
This is an outrageously anti-Australian remark. Australia is the driest continent on Earth, and with our ingenuity we can make it even drier. Not only does no rain fall, but we send rain up!
“Mandora in the middle of nowhere…”
I have to admit that not much of Australia isn’t.
As Ralph in Groundhog Day said “That about sums it up for me”.