Guest post by David Middleton
Caribbean battered as Irma, most powerful hurricane ever, makes landfall
Winds of 151mph recorded before monitoring equipment is destroyed by the storm, as eye of hurricane passes over Barbuda and neighbouring Antigua
The most powerful Atlantic Ocean hurricane in recorded history has made its first landfall on the islands of the north-east Caribbean, following a path predicted to hit Puerto Rico, the Dominican Republic, Haiti and Cuba before possibly heading for Florida over the weekend.
The eye of Hurricane Irma passed over Barbuda at about 1.47am local time, the National Weather Service said. Residents said over local radio that phone lines had gone down. Heavy rain and howling winds hit the neighbouring island of Antigua, sending debris flying as people huddled in their homes or government shelters.
[…]
Oops! Wrong article. I should have quoted this pack of lies in part one.
Let’s try again…
Hurricane Irma Is Now The Most Powerful Atlantic Ocean Storm In Recorded History
Fresh off the back of the devastating Hurricane Harvey, the US is preparing for an even more dangerous storm – Hurricane Irma.
With wind speeds of 300 kilometers per hour (185 miles per hour), Irma now ranks as the most powerful hurricane in the Atlantic Ocean. It is the second most powerful in the Atlantic basin, which includes the Atlantic Ocean, Caribbean Sea, and the Gulf of Mexico, behind Hurricane Allen in 1980 that hit the latter two with winds of 305 km/h (190 mph).
[…]

If Irma is the most powerful hurricane ever recorded in the Atlantic Ocean, excluding the Caribbean Sea and Gulf of Mexico, what’s that major hurricane just north of the Caribbean Sea?

Almost all of the historically similar major hurricanes since 1851 formed east of the Caribbean Sea. Irma is anomalous because it achieved major hurricane status well-east of the Caribbean. The as-yet unidentified hurricane at the northern edge of the historical ensemble achieved Category 3 and 4 status while north and east of the Caribbean Sea and was actually more “powerful” than Irma while still in the newly redefined Atlantic Ocean.
Addendum: Corrected Map

Who cares?
[Technically, we do not know the answer to that question. Further, we can never know the answer to that question. .mod]
Not everyone lives an apathetic existence replying to everything with: “who cares?”
Do you ever wonder why someone would bother to post, “who cares?” if they really didn’t care?
Who cares?!
That old hurricane that achieved Cat 3-4 status northeast of the Carribean was less powerful than Irma which achieved 185 MPH there. And what is so newly defined about the Atlantic Ocean? With the Atlantic Ocean and the Atlantic Basin distinguished from each other?
We could have a vote to see who cares.
“Who cares?”
What’s on second?
Thathe was his last name, ‘cares’ was his middle name.
I have to agree.
But I still have to credit David Middleton for finding a couple of good examples on climate alarmism.
Right you are ………………
And, …… in that ….. “the Most Powerful Atlantic Hurricane Ever” …… is being discussed,….. I have always figured that the “leftward” or ”westward” curvature of the Atlantic Ocean shoreline from southeast Florida up to and including North Carolina was probably the result of ……. monster hurricanes and tropical storms beating and pounding and eroding away at the shoreline during the past tens of thousands of years.
No, the shoreline was shaped by the mid-Atlantic rift that separated southeastern North America from northwest Africa.
Horton heard a Who.
Do you know the last name of the guy on third?
“Irma shattered the global record for a cyclone to maintain 185-mph winds for such a long duration, 33 hours. Super Typhoon Haiyan previously set the record in 2013 when it maintained winds at that level for 24 hours.”
As I stated in Part One…Irma is a really bad hurricane. It could be the most severe hurricane to hit Florida since 1935. It just isn’t the most “powerful” Atlantic hurricane ever recorded, no matter how one chooses to redefine the Atlantic Ocean.
Redefine it as if the ocean’s definition changed? I remember maps from the 1960s, the 1950s, the 1940s, and older, and when one is referring to the Atlantic Ocean, that was not the Gulf and Carribean. When referring to including those, the term was never simply Atlantic Ocean but something else such as Atlantic without the term “ocean” and/or with a term other than “ocean”.
Geography 101
The Caribbean Sea and Gulf of Mexico are in the Atlantic Ocean, just as much as the Sargasso Sea is in the Atlantic Ocean.
Caribbean Sea, suboceanic basin of the western Atlantic Ocean, lying between latitudes 9° and 22° N and longitudes 89° and 60° W. It is approximately 1,063,000 square miles (2,753,000 square km) in extent. To the south it is bounded by the coasts of Venezuela, Colombia, and Panama; to the west by Costa Rica, Nicaragua, Honduras, Guatemala, Belize, and the Yucatán Peninsula of Mexico; to the north by the Greater Antilles islands of Cuba, Hispaniola, Jamaica, and Puerto Rico; and to the east by the north-south chain of the Lesser Antilles, consisting of the island arc that extends from the Virgin Islands in the northeast to Trinidad, off the Venezuelan coast, in the southeast. Within the boundaries of the Caribbean itself, Jamaica, to the south of Cuba, is the largest of a number of islands.
Britannica
Gulf of Mexico
The Gulf of Mexico is a smaller part of the Atlantic Ocean, but it is the ninth largest body of water in the world.
[…]
Deepsea Waters
If Irma is not the.most powerful hurricane in the Atlantic no matter how one chooses to redefine the ocean, can anyone name one to have achieved higher wind than 185 MPH over an an area of water that by all definitions is the Atlantic Ocean?
Irma achieved Category 3 status east of the Caribbean. It reached 4 and 5 in the Caribbean region of the Atlantic Ocean. The storm at the northern side of the historical ensemble achieved 3 and 4 status while north of the Caribbean Sea.
read that harder. GLOBAL record..
The Barbuda station records do not support the claim of a Global record. Please see my comment here.
[How] do you know[?] your measure is speed and that is not a measure of power. You need to bring in mass in there somewhere.
A car traveling uphill at 70 mph is not as powerful as a train going up the same slope at 50 mph
You have become stuck on stupid. The density of the atmosphere at seal level is fairly constant everywhere in the world. There may be small barometric pressure differences, but, otherwise, wind speed during a storm is implicitly a measure of power, because the atmospheric density is fairly constant.
David Middleton: Regarding the map of hurricane tracks and “Irma achieved Category 3 status east of the Caribbean. It reached 4 and 5 in the Caribbean region of the Atlantic Ocean. The storm at the northern side of the historical ensemble achieved 3 and 4 status while north of the Caribbean Sea”:
The first NHC public advisory reporting Irma as a Cat-4 is #22a, reporting 140 MPH wind. Its coordinates then were 16.7N 55.0W. That’s about 400 miles outside the Caribbean.
The first NHC public advisory reporting Irma as a Cat-5 is #25, along with an update statement issued just before, reporting 175 MPH wind. Its coordinates then were 16.7N 57.7W. That’s about 200 miles outside the Caribbean.
David Middleton: Regarding the map and the black-bordered box: The black edges of that box are not the boundaries of the Caribbean Sea, but merely a rectangular box with latitude and longitude ranges that one source said the Caribbean Sea is within. The Caribbean Sea is well known as being defined as the body of water south/west of an obvious island chain. Hurricane Irma achieved Cat-5 east of the eastern part of this island chain.
Also, your black-edge box has its eastern and western boundaries being drawn 5 degrees farther east than claimed in your map.
If we use a descriptive outline of the Caribbean Sea, then every major storm north of the Greater Antilles and east of Florida formed in the newly redefined Atlantic Ocean…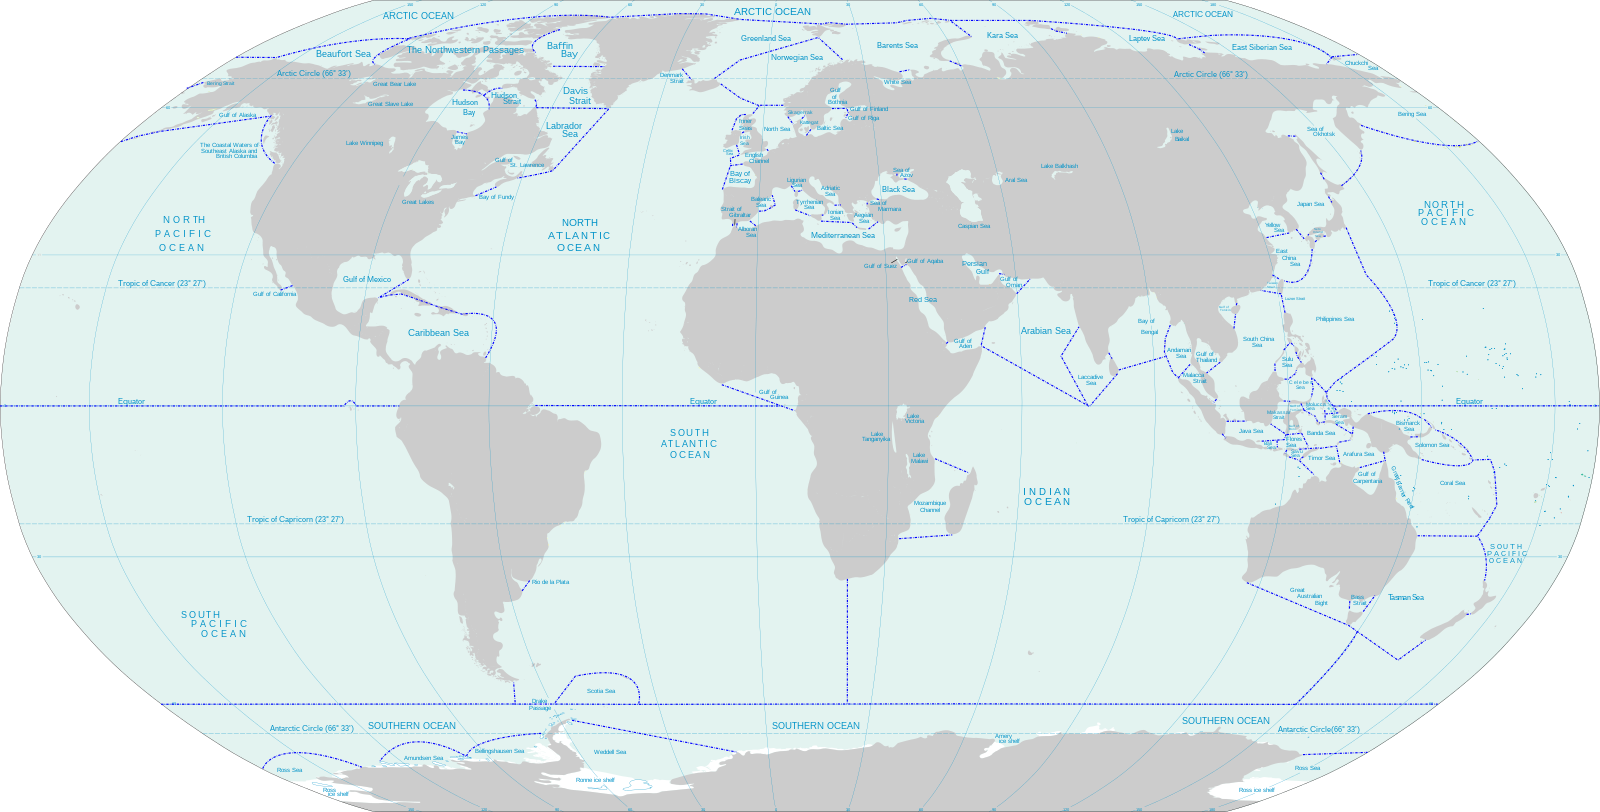

The box encloses latitudes 9° and 22° N and longitudes 89° and 60° W. If the eastern boundary was 5° too far to the east, multiple storms would have become major hurricanes while east of the Caribbean region of the Atlantic Ocean.
The longitude labels are to the left of the lines.
David Middleton: If the longitude labels are to the left of the lines, then the longitude of New Orleans would be about 95 degrees W, which it is not. It is about 90 degrees W. Multiple hurricanes have become major ones in the open Atlantic ocean, east or north of the Caribbean. Irma was more powerful than any of the others there, with NHC-determined wind of 185 MPH.
New Orleans does look out of place. I will double check the boundaries. However if the box is off 5 E, then multiple hurricanes would have been major hurricanes, including a couple of Cat 4’s, while east of the Caribbean.
The diatinctive things about Irma are that it became a major hurricane much farther east in the Atlantic Ocean than any other hurricane on record due to a lack of wind shear and that it has maintained Cat 5 status more a very long time.
However, its entire track has been in the Atlantic Ocean, which includes many seas, like the Caribbean.
You’re right about the box. When I transferred it from a more clearly annotated map, I shifted it 5 E.
It is the “worstest” in history. Even Trump quoted that today. And he is not susceptible to the usual myth-making propaganda.
Irma is the strongest in history probably because the ocean temperature is lower than last year when there was no hurricanes. It must be caused by global warming. Lower sea surface temperature, bigger hurricanes. Obvious. In short, the global warming believers need to keep pushing the religion even if is fake.
Irma is only in the top 20 so far. Might get stronger yet but there is very little damage except for the eye-wall intercept areas.
The Atlantic Basin has short term negative correlation between global temperature and number/severity of hurricanes. This negative correlation is only a short term one. This happens because El Nino spikes global temperature and causes a regional wind sheer pattern that suppresses Atlantic Basin (or “greater Atlantic Ocean” or Atlantic without the term “ocean”) hurricanes.
Donald , do you mean short-term as in last 12 years or short-term as in inter-annual across the whole record? Not clear what you are suggesting.
My look at ACE and SST showed short-term positive correlation during the warming phases of the 60y cycle and much less short term correlation during the cooling phases.
Well now, to be picky, picky, picky, ……. I just hafta say that , ….. as far as anyone knows for sure, it very well could be ……. “the worstest in recorded history”.
But now given the fact of the much warmer water temperatures during the Holocene Climate Option of 8000 to 4000 BP, ……. it is intelligently logical to assume that some really “monster” hurricanes formed in the Atlantic Ocean somewhere between the African and North American coastlines.
http://www.dandebat.dk/images/1570p.jpg
Greg: Your graph with 2-year lowpass filtering of ACE makes it hard to see dips of individual El Nino years, and the other parameter shown is not global temperature.
Off course it’s not global temp, it is SST of the N. Atlanitc basin, same as you were talking about.
I produced a graph which supports what I said, where is the evidence of your claim of neg. correlation?
…except that so many reports of “strongest Atlantic hurricane ever” were made well before it had set that record of duration and therefore clearly weren’t referencing duration but sustained winds. Are you really this ignorant or just playing the role of petulant child?
Yup. First the false claim is made, then a basis for it is sought. That’s post-modern “science” for you.
But then Mosh is marketer, not a scientist, as BEST falsely claims.
Also, those prior ones were “Atlantic” hurricanes without restriction against having such extreme winds being achieved only after the storm leaves the ocean itself and enters a connected body of water that always had a distinct name of its own.
I think the “hypers” should be made to watch a Dragnet marathon. Maybe then they’d learn what “Just the facts” means.
PS I don’t know when Irma was downgraded from a Cat 5 to a Cat 4. I think it was sometime during the night?
This morning The Storm Channel just said it was “Now a Powerful Category 4”.
Maybe they did say it at sometime but I didn’t notice any use of the words “downgraded” or “weakening”.
Please show the data to back this statement up. Satellite technology and resolution limits in the early Satellite era and fewer hurricane hunter crossings along with fewer open Ocean surface observations before 2000 mean this statement can only apply to the last 20 years at best probably fewer.
Redefining the setting allows all manner of records to be set and broken.
No. there are multiple records. just like in baseball. people keep track of things.
Stratomatic Baseball rocks!
Station BARA9 – 9761115 – Barbuda, AG
Sep 6 at 4:54 AM Sustained Wind: 119 mph Gust: 154 mph Bar. Pressure: 932.1 hPa
Sep 6 at 5:00 AM Sustained Wind: 108 mph Gust: 156 mph Bar. Pressure: 927.9 hPa
.(Anemometer Failed Apparently)
.
.
Sep 6 at 5:18 AM Pressure: 921.2 hPa
.(Barometer stopped)
.
.(Barometer resumed)
Sep 6 at 6:00 AM Pressure: 922.4 hPa
And then pressures continue to rise, so it looks like the eye came over at about 5:00 AM and left at about 6:00 AM.
The measured surface winds only justify a rating of Category 4. The measured barometric pressure is just below Category 5, but it might have gone lower during the time that no data is reported. The Barbuda station is right on the beach where the eye apparently came over and it looks like there are wind speed measurements as the eye wall was coming over. Even though the anemometer failed, it looks like sustained surface winds of 185 mph are unlikely.
Irma has apparently set a 24-hr ACE record…
https://twitter.com/philklotzbach/status/905385156076126212
Kind of like breaking the record for homeruns in a single game.
Maybe someone should make hurricane cards, with all the stats and records for each storm. People could collect and trade them like baseball cards, or Pokemon.
That would be cool!
Last week I began tracking the time it takes the hitter to round the bases after hitting a 2-run homer.
The all time global record was shattered two days ago.
It was again completely shattered yesterday.
This new & unprecedented trend must mean something … what’s going on in baseball today?
Pokemon Hurricane Sandy Card:
http://www.mypokecard.com/my/galery/gU63pVONTEDI.jpg
Davis cool one LOL should make a deck of all the hurricanes/typhoons 😀
It’s like arguing with a social justice warrior (SJW) that it’s possible for a white male to be the victim of racism. If you drag out the dictionary, and point out that the accepted meanings of racism make it possible for anyone to be a victim, the SJW will argue that the dictionary is wrong. link
I couldn’t really read that stuff because I don’t speak English natively and I get headache easily for words like oppression, but I could agree on dictionary definitions being problematic. But more importantly, I have never seen anyone claiming white man can’t be a victim of racism. The attitude I see is more like ‘as a white man you should not complain on racism’. Which is totally wrong. Racism is racism, be it racism by pink, brown or spotty person against pink, brown or spotty people. And it is all something you should be able to fight against.
That particular article didn’t say white men can’t be victims of racism, but it did say white men can’t do dictionaries. Which is pretty much racism. And sexism, because women can and do make dictionaries.
Apparently, the 12-year hiatus in major hurricanes has left a mark. The only way for CAGW hucksters to save face is to find a way to tweek labels so as to allow them to claim “…but its _______ is unprecedented”. ( fill in the blank: wind strength, rainfall, slow movement, eastward formation,….)
SR
If only we in the West were able to cool the planet by 2 degrees – none of this would have happened…
David,
Thanks for the clarification.
Possibly you could clear something up regarding the wind velocity.
We know they fly an airplane at some elevation to measure the wind velocity as well as other parameters.
The velocity they measure is not necessarily the velocity at ground level yet we hear reported just one velocity max and gust..
Is it misleading to not also report the velocity at ground level or is there little difference which I doubt.
I know that few structures are designed for 185 mph, maybe more now. I know that design wind velocities were increased per the engineering standards a while back, but none that I saw for the Continental US are even near 185 mph the last time I looked..
Appreciate your clarification
I just assume that the folks measuring the wind velocities know how to calibrate the various measurements to be “apples & apples.”
Irma is now 5.5x the integrated kinetic energy (IKE) of hurricane Andrew. Where Andrew was a tight hurricane with a small eye, Irma is very large with a big eye. Currently Irma has an IKE value of 113 TJ which corresponds to 24 megatons of TNT energy per sec every second.
When pne looks at Miami in Google Earth you get some idea of the potential destruction. Yes the IKE indexes has problems but seems better than wind speed, especially for low lying areas. Yes there are other indices of destruction but they are also not mentioned by the talking heads. IMO, Sandy was a good example of why wind speed is only part of the picture.
My following comment should read 24KT of TNT not MT of TNT . Sorry
But don’t assume that those that report them to the public do! If they did Sandy would have never been classified a “super storm” and so many people would not believe that it was a hurricane when it made landfall in NJ.
I see Florida increased wind velocity recently
http://www.floridabuilding.org/fbc/Wind_2010/Flyer_Wind_January2012.pdf
FL Engineer September 7, 2017 at 2:12 pm:
There’s a recon flight in progress right now. Snippet of data is available at: http://www.nhc.noaa.gov/text/URNT15-USAF.shtml
There is a supplement to help decode all the values. The key ones are the last 5 fields. The 6 digit number is actually a concatenation of wind heading and 30 second average speed. The next two 3 digit numbers are peak 10 second reading and SFMR approximate surface reading. Last value is quality flag with a value of 0 meaning all measurements nominal and 3 indicating SFMR parameters suspect.
I’ve been importing the full data into a spreadsheet to help make more sense of it. The current data indicates the maximum peak wind speed recorded at flight level was 146 kts (168 mph). This was measured at 21.19N 71.59W at 2644 m altitude. 1 minute before and after that measurement the recorded speed was 127 kts and 124 kts (~145 mph).
A dropsonde was launched at 23:37z in the NW eyewall. The flight observations just after that point show peak winds of 139 kts. The dropsonde data as it falls from 2500m shows an average reading in last 150 m of 122 kts and surface reading of 104 kts (120 mph).
The dropsonde data only shows about 15 points as the pressure increases from the fall down. I haven’t seen anything that could correlate the fall time or the free fall position information. The final surface latitude and longitude are 21.3N 71.9W. The plane dropped it at 21.16N, 71.55W so the turbulence as it falls can take it quite far from the flight observations and may account for some of the difference in measurements.
Maybe someone a little more familiar with the dropsonde sensors can shed more light on sample rate, average vs peak reporting and whether the data continues to be collected from surface or is only live for that brief fall time.
All of this is raw data so there may be some valid adjustments before it is fed into any of the models or used for public advisories, but there definitely seems to be at least 20-30 kts difference between flight level peak measurements and dropsonde surface measurements.
Seems like the intensity should be based off surface instead of flight level altitude measurement as that is what will be impacting any buildings and coastline. Also seems like past intensities reported a 60 second sustained value instead of a peak measurement in 10 second intervals.
The raw data does plot the peak winds as a function of location pretty well and the most extreme winds are confined to a relatively tiny area. The satellite and IR images show this massive 500 mile wide storm but the maximum peak winds only affect a few miles in the NE corner of the eye. Southern exits from the eye are measuring 20-30 kts less. Also helps explain why San Juan missed the center by a scant 30 miles or so and the weather station at the airport only showed a maximum gust just over 60 mph. The Providenciales station data linked above showed max gust of 82 mph with NE eye passing very close by.
Storm is still very dangerous and 20-30+ kts difference in peak winds isn’t going to translate to storm surge being substantially lower.
Estimating good surface wind data from aircraft in a turbulent hurricane is not easy. Surface anemometers are sparse, not scientifically placed and tend to fail. There is a pesky surface boundary layer involved. Making models from resulting data that are useful for structural engineering design are keeping people busy. Engineers will be doing their best to design economical structures against wind damage for a long time. One example of learning from past storms, is Andrew.
The last two papers in this list are a good starting point to understanding post-hurricane analysis of surface wind fields.
http://www.aoml.noaa.gov/hrd/data_sub/wind.html
I noticed most of the weather buoys in south Florida are ‘off line’.
Suspect that NOAA is aware that people have figured out their BS and doesn’t want to provide us with anymore data to use against their reporting.
Chaos precludes prophecy of Catastrophic Anthropogenic whatever and everything else outside of a limited frame of reference in time and space, past, present, and future.
I think what also should be considered is that the maximum sustained winds of Irma do not coincide with its measured Barometric pressure relative to the BP’s and sustained winds of historical storms. My point is I believe there is, at least since I have been watching hurricane data, a fudging of the wind data to indicate a higher velocity than what exists in reality. I have been watching Hurricanes for 50 years since the age of 6 and I have noticed recently this trend. I’m not downplaying the danger of this hurricane but only to say it seems to me that as we have noticed with Anthony Watts discovery of the recording temperature near locations that falsify true temps, so we also see now in the same vane a process over time which misrepresents the true velocity of modern Hurricane wind velocities.
I can go further with how I know this is true but to keep it short,,,those playing with the anemometer are forgetting to play with the barometer as well 🙂
In my experience, nature often ends droughts with heavy rains and flooding.
We had a natural 12 year drought of US landfall major hurricanes…
and now we have a year with several major hurricanes.
Is it a ‘flood’ of hurricanes? Not yet.
Is it ‘unprecedented’? No.
It is shaping up to be an active year for hurricanes though, after our 12 year hiatus, as predicted by good folks at Weather Bell.
This is just nit-picking about headlines. The article you quote clearly states that “it is the second most powerful in the Atlantic basin, which includes the Atlantic Ocean, Caribbean Sea, and the Gulf of Mexico”. Headlines are “click bait” nowadays and not to taken seriously. Almost every article I have read has distinguished between the most powerful in the Atlantic ocean and the most powerful every. Which would appear to be a valid distinction since the enclosed waters of the gulf of mexico and the Caribbean are in general much warmer and so you would expect more powerful hurricanes.
The Caribbean Sea and Gulf of Mexico are in the Atlantic Ocean. The Atlantic basin is the Atlantic Ocean. ?w=720
And Irma isn’t even the most powerful Atlantic hurricane ever recorded outside of the Caribbean Sea or Gulf of Mexico.
Irma achieved Category 3 status east of the Caribbean. It reached 4 and 5 in the Caribbean region of the Atlantic Ocean. The storm at the northern side of the historical ensemble achieved 3 and 4 status while north of the Caribbean Sea.
Dave, sorry to have left one needs to get to wor sometimes.
With regards to your thesis. Tornadoes are believed to achieve a wind speed of 300 mph. Ref wiki. This according to your metrology of relying on speed to rank power in rotating columns of air would mean that a tornado is more powerful than a hurracane.
If you feel that you need to find an other unit to describe power in a rotating air column, invent and DEFINE a new unit, that is what Paul Dirac did.
There’s your homework for today.
Ouote the exact passage in either post where I misused either the word power or powerful.
“Hurricane Irma is NOT the most powerful Atlantic hurricane Ever Recorded”
By now I can see lots of people have criticised your use of wind speed for power.
Just consider, which is the most powerful a 500kg car going at 70mph
a 40 tonne truck going at 60 mph
or a 1000 tonne train going at 50 mph
By your reasoning the car is the most powerful.
Ask any layman the same question.
You used speed only to allocate power this is wrong and the entire is a misquote.
Since you can’t quote the exact passage in either post where I misused either the word power or powerful, I’m done replying to your comments,
Hair splitting.
There is a truly huge hurricane out there… the descriptions from (e.g.) National Hurricane Center make it clear that those who study these things haven’t seen anything like it.
Now, climate science predicts that hurricanes will be more intense due to warming…
Here we have 2 intense hurricanes in a season…
The driving force of these is (essentially) ocean temperatures/heat…
I think it would be a foolish person who did not keep an open mind to the possibility that warming has influenced the scale of these and/or didn’t look at the ocean temps/factors which result in the most intense storms.
Finally, if the predictions are right, this happens more often. time to look at preparedness. Can the area take one of these every 5 years, for example.
Or you can keep spending your time explaining how all the storms aren’t the worst, how this has happened once before, so it has ‘just’ happened now, etc.
Griff: Do you believe in coincidence? I’m wondering, because we just went 13 or 14 years without a Cat 3 or higher hurricane making US landfall, and NOW that one finally does, it’s because of the warming. Did the warming also cause the LACK of hurricanes the previous decade and a half, or was that just… you know.
I think it is stupid for anyone to declare that climate change is effecting the strength of tropical cyclones without science or even a correlation of historical data to back the claim as you have. Just as It was stupid for anyone to declare that Harvey loitering over the Houston area was the result of climate change as you and Michael Mann did and other have.
If it’s “global” warming, why is the Pacific so quiet right now ?
And the whole southern hemisphere which has had a nearly record quit season.
Climate is the result of weather trends. Climate change is derived from weather trend change. The climate cannot change until weather records show changing trends. Cart horse problem. The hurricanes may be indicators of a change in future climate if they indicate a trend change. Two hurricanes are not a trend. A 12-year hiatus is an interesting statistic, though. I doubt anyone agrees on how to quantify climate in any event.
1) Here we have 2 intense hurricanes in a season…
2) Here we have 2 intense hurricanes in 12 seasons.
Griff, do you agree that the second line is not lend credence to any argument since it is without context?
You are correct. I have estimated the impact of global warming on Hurricane Harvey in a comment, which I will repeat below. I have removed the snark and editorializing in my original comment.
What was the impact of global warming on Harvey rainfall? Let’s crunch some numbers. First of all, according this article in Wired magazine:
.
Converting to metric, 86°F is 30°C and 87°F is 30.55°C. It takes one calorie to heat one gram of water one degree Celsius. Likewise the heat of vaporization of water is 540 calories per gram. Thus, starting at 30.55°C, it would take 69.45 calories to heat one gram of water (ignoring that it is salt water) to 100°C plus 540 calories to evaporate it for a total of 609.45 calories. 609.45 calories per gram equals 609,450,000 calories per cubic meter.
According to this article in the Washington Post, 1 trillion gallons of water fell on Harris County alone in four days from Saturday (Sep. 2) through Tuesday. According to Wikipedia, the area of Harris County is 4,602 sq. km. One trillion gallons is 3,781,998,708 cubic meters. Dividing by 4,602,000,000 sq. meters, the height of the water column that fell on Harris County would be 0.8225579713 meters or about 32.3841720984 inches.
If we take the 609,450,000 calories per cubic meter it takes to evaporate that water and multiply it by the 3,781,998,708 cubic meters that fell on Harris County, we obtain a total of 2.3070192117588E+018 calories which is the energy that Harvey used to evaporate the water that fell on Harris County. Assuming that all the water that Harvey evaporated also was condensed, then we can use this energy to calculate how much water Harvey would have dropped on Harris County if there had been no global warming (i.e. if the SST had been 86°F instead of 87°F).
Starting at 30°C, it would take 70 calories to heat one gram of water (ignoring that it is salt water) to 100°C plus 540 calories to evaporate it for a total of 610 calories per gram or 610,000,000 calories per cubic meter. Dividing 2.3070192117588E+018 calories by 610,000,000 calories per cubic meter, we obtain a new estimate of the volume of water that Harvey would have evaporated sans global warming: 3,781,998,708 cubic meters. Again, we divide by the area of Harris County and we obtain a water column of 0.8218163207 meters or about 32.3549732559 inches, which is what would have fallen on Harris County sans global warming.
Subtracting, the latter water column from the former, we obtain an estimate of the effect of global warming:
0.0291988425 inches or about 29/1000 of an inch!!!!!!
Of course, my estimate might be wrong. If somebody spots an error, please do not hesitate to point it out. It is surprising that it would make so little difference (honestly).
Hair splitting.
ALL those who study these things or just those who were still in school 12 years ago haven’t SEEN anything like it?
(minor mess up with the quote. the “myself” should have been after my “hair splitting”.)
One would think you would be correct but no. I was in the Navy when Camille hit. I sat through several hours of debrief afterwards. The NWS/ HUC had no data because their instruments have blown away but the Navy did. The Navy made no claim about it being the worst or whatever, just gave us a description of the storm and compared it to others. Yet since then NOAA has tried to down grade Camille to something less than what it was. I can only “speculate” as to why since it has happened since the AGW crowd took over. I didn’t do a lot of searching but Camille now is reported as have been in the 900 pressure (my memory says it was lower, but I don’t depend on my memory for reporting data) and Irma is supposedly in the 930s. The Labor Day Storm of 1935 was at about 890.
Let’s be specific, people! Let’s get it down to fractions of degrees of longitude and latitude, and choose our adjectives accordingly. This way, you can have a hurricane located a mere half a degree from another hurricane and make extraordinary claims about its power in relation to the hurricane a mere fraction or two degrees away.
Effective alarmism requires precision, in order to blow things out of proportion. Learn this basic principle, and you are good to go.
I just took the deepest breath that I have ever taken on a Friday at 10:29 AM on September 8. It was an inhale lasting thirty seconds. I do not ever remember taking a breath of this depth in my entire previous history on this exact date. This is HUGE ! Oh, and it was a sunny clear day too, with a humming bird buzzing around and a myriad of other details that would serve to make this one breath truly unprecedented.
[The mods point out that the observed high-speed hummingbird wings at 10:29 EDT 08 Sept 2017 will have a much larger impact on the trajectory of every modeled hurricane than any theoretical butterfly. .mod]
Thank God it was a hummingbird and not a butterfly! 😎
I thought that the depth of my breath at this time would have more than compensated for (by subtracting from) the effects of humming-bird wing flapping.
Of course, I have not factored in fart convective cells. [can I say that here? — I forgot]
BTW if Joe Bastardi is correct in his morning update today Irma could be the strongest hurricane on record to have made landfall on the US. He says Irma will gain strength before it hits the Keys and Florida coast and said “it could rival what happened in 1935”. The labor day hurricane of 1935 that struck the Florida Keys is said to have been the most intense hurricane to have struck the US. He now has the track west of Miami.
Yes it could. I seem to recall that I started Part One with…
https://wattsupwiththat.com/2017/09/07/hurricane-irma-is-not-the-most-powerful-atlantic-hurricane-ever-recorded/
113 TJ apparently a record, can you beat that?
Thankfully, I think we finally convinced my sister to head north. She lives in Naples. I just wish she’d left three days ago.
Tough getting out right now though it may be somewhat easier on the west coast. Even though they suspended the hours of service regulations for tanker drivers heading into Florida and the POTUS has ordered police escorts for them, they still have to fight the oncoming traffic and even worse, a whole lot of the gas stations have closed up shop as their employees head for the hills.
Yep. She thinks it will take 12 hours to get to Orlando… Normally about 3 hours.
My family has a shared use vacation home in Port Charlotte. At times like these I’m glad it’s on a channel and not on the shore of the bay or the Gulf. Since this winter is probably going to be quite a bit tougher one than we in the east have seen for a few years. And because I get sent where the forecast for winter storms are in the east during the winter. We have plans to head down and use that home in Charlotte the first couple weeks of Feb. next year to get a break during the coldest month of the year. Hope the it weathers the storm well.
I’d heard about the local gas shortages but never considered that the stations would need employees who had not evacuated to run the pumps.
If it is not already part of a states Emergency Plan, perhaps include provisions/legal allowance for National Guard troops to run the stations? Maybe develop mobile pumps that could hook to a tanker?
(Just typing out loud.)
Definitely not the most powerful as Cat 5 have hit Florida before and this one is now Cat 4. No doubt in area it is a big one. Only just a small selection highlighted below.
http://www.hurricaneville.com/historic.html
“Labor Day Hurricane of 1935–The most powerful hurricane to make landfall in the United States. A very small storm, this Category Five Hurricane tore through the Florida Keys with 180 mph winds, and a low pressure of 26.35 inches of Hg.”
“Hurricane Donna–Had a very erratic path in the summer of 1960 that started in the Caribbean, then went to the Florida Keys, then into the Gulf of Mexico, where it would make a turn to the north and make a second landfall over Florida at Fort Myers. It continued northeastward across the Florida Peninsula, and moved back out into the Atlantic near Daytona Beach. Not done yet, Donna headed up the East Coast, and made another landfall at Topsail Island, North Carolina. It then finished its trip by heading into New England, and a final landfall across Long Island. At its peak, Donna had wind gusts ranging between 175 and 200 mph, a minimum central pressure of 27.46 inches, and a 13 foot storm surge. Its total damage cost was over one billion 1960 United States dollars while Donna left 50 people dead.”
“Hurricane Carla–Struck between the Port O’Connor and Port Lavaca area of Texas back in September, 1961. It was the most powerful storm to hit the Texas Coast in about 40 years. It winds were in excess of 150 mph, and gusts went up to 170 mph. Tides near Port Lavaca were 18.5 feet above normal, and the barometric pressure was 27.62 inches of Hg. Estimated damage from the storm was $408 million dollars while the death toll hit 43. Today, the cost would have been far greater.”
“Hurricane Camille–Was the last Category Five Hurricane to make landfall over the United States before Hurricane Andrew did in August, 1992. Hurricane Camille landfall over Gulfport, Mississippi on August 18, 1969 with winds of 180 mph, and a record storm surge of 24.3 feet. It left about 250 people dead from Louisiana to Virginia, and was responsible for approximately $1.421 billion dollars in damage.”
“Hurricane Andrew–This is probably the most recent memorable hurricanes in modern history. After struggling to develop in the Atlantic, this Category Five Hurricane rapidly developed over the Gulf Stream, and devastated South Florida with 165 mph winds on August 24, 1992. It was the costliest natural disaster on record with some $30 billion dollars in damage.”
CNN just showed the relative sizes of Hurracane Andrew and Irma. Irma is about 4 times Bigger.
The highest winds and heaviest rains by far are no further than about 50-75 miles from the centre of the eye using GFS at 0z. Away from there the rain and winds are significantly less intense. Just because the hurricane is bigger in area doesn’t mean the Cat 4 scale occurs over all of it.
Sorry, not from the centre of the eye, but “from the edge of the eye”
Climate Etc. has a detailed, well-illustrated thread just up on Irma at:
https://judithcurry.com/2017/09/08/hurricane-irma-eyes-florida/
Very informative.
No way was it widely above 30c in that area shown below. (even a peak of 33c)
http://weather.unisys.com/archive/sst/sst-170903.gif
But, but, but, this is a “nuclear hurricane!” Surely that makes it the most powerful no matter how you measure “power.” /sarc for the sarc-impared.
“Nuclear Hurricane” – HA!
The words of a politician, ‘fission’ for superlatives.
a nuke-icane then… most powerfull evah 🙂
” While intensity provides a measure to compare the maximum sustained surface winds of different storms, it is a poor measure of a storm as it does not account for storm size”
Tropical Cyclone Destructive Potential by Integrated Kinetic Energy
M D Powell and T A Reinhard
Dave
I reckon it says that your entire argument is fallacious
But then I could never see power as being defined by speed.
Powerful having great power.
Most powerful
Having greatest power.
Again IKE is strictly speaking not power it’s a lot closer than speed.
As I understand it, Hurricane Sandy had a higher IKE than Irma.
Well, seeing as Trump has today claimed that Irma is the mst powerful Atlantic hurricane recorded, we can probably expect the MSM to start reporting it being tied second with three others and claim Trump is misinforming the public.
Typhoon Tip, reaching neatly 3,000 miles diameter back in 1979, trumps every storm since for size.