by Andy May
Introduction
In 2014, Dr. Michael Connolly and Dr. Ronan Connolly posted three important, non-peer reviewed papers on atmospheric physics on their web site. These papers can be accessed online here. The papers are difficult to understand as they cover several fields of study and are very long. But, they present new data and a novel interpretation of energy flow in the atmosphere that should be seriously considered in the climate change debate.
By studying weather balloon data around the world Connolly and Connolly show that the temperature profile of the atmosphere to the stratosphere can be completely explained using the gas laws, humidity and phase changes. The atmospheric temperature profile does not appear to be influenced, to any measurable extent, by infrared active gases like carbon dioxide.

Figure 1, source Connolly and Connolly.
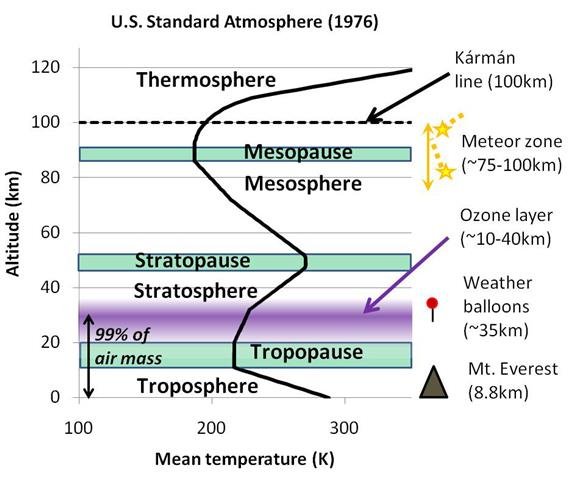
Figure 1 shows the “U.S. standard atmosphere.” The black curve is the standard atmospheric temperature as a function of altitude (Y axis). There are several key points that are important for this post. First, notice that the temperature decreases with altitude in the troposphere, then goes vertical in the tropopause, then it reverses course and increases in the stratosphere. Since we are discussing weather balloon data in this post, we are only concerned about the curve to about 35 kilometers. This region contains about 99% of the atmospheric mass. We will also be discussing the ozone layer, which is at the very top of our layer of investigation.
They evaluate available weather balloon data in terms of molar density and pressure. They find that, above the boundary layer (roughly the surface to 2 kilometers, the atmospheric layer that contains most of our weather), the trend of molar density and pressure is a line until the tropopause is reached. Above the tropopause it is also a line, but with a steeper slope, see figure 2. In figure 2, pressure increases to the right and altitude decreases to the right. Above the tropopause molar density decreases more rapidly with pressure, this suggests a change in the equation of state for the atmosphere above the tropopause. Region 3, the boundary layer, shows much more variability than the higher regions of the graph. This variability is due to changes in humidity and precipitation.
Multimers
A change in the equation of state in the atmosphere means that it will respond to external forces (“forcings”) differently. For the atmosphere, the equation of state is the ideal gas law, modified to account for factors that affect real gases, but not ideal gases. These include varying specific heat capacity, Van der Waals forces and compressibility effects among others. While the molar density versus pressure plots, like figure 2, strongly suggest that the equation of state has changed above the tropopause it does not tell us exactly what happened. Connolly and Connolly think that oxygen and nitrogen multimers form in and above the tropopause (see figure 3). Multimers are called trimers if they contain three molecules and tetramers if they contain four.

Figure 2, after Connolly and Connolly (2014) paper 1.

Figure 3 (source Connolly and Connolly, 2013)
This suggests that the atmosphere above the tropopause has a lower molar density, at a given pressure, than the tropospheric trend would suggest. The atmospheric composition and humidity above and below the tropopause are nearly identical, so composition is not the cause of this change.
The formation of oxygen and nitrogen multimers is a state change that can be called a phase change. If multimers form in the tropopause, they release the energy of formation to the surroundings. This may increase the temperature of the surroundings. The larger multimers have more degrees of freedom than the diatomic monomers (for example O2) and every additional degree of freedom increases the internal energy of a mole of multimers by ½RT. R is the universal gas constant and T is temperature. This is described in more detail in Connolly and Connolly, paper 2, section 2.2. In their section 2.2, the heat of formation (or enthalpy of formation) of the multimer is designated as ΔH. The molar enthalpy (H) of a gas is defined as,
H = U + PV … (1)
Where U is the internal energy of the gas, P is pressure and V is the volume.
U = ½αRT … (2)
The internal energy of the gas is equal to ½ of the degrees of freedom (α) times the gas constant (8.3145) times temperature (T). Degrees of freedom of a gas are defined here as the number of independent ways a gas can have energy. This includes translation, rotation and vibration. Internal energy is the sum of the energy in all the degrees of freedom of the gas. If ΔH is set to zero for a diatomic monomer, it is 4RT with 34 degrees of freedom (α) for a tetramer, according to table 2 from Connolly and Connolly paper 2. So, the heat of formation of a multimer can be significant and will affect the temperature of the tropopause and stratosphere. The formation of oxygen multimers probably involves the emission of microwave radiation.
In the tropopause, the lapse rate is near zero, this means, according to Connolly and Connolly, that the increase in internal energy, due to multimer conversion, is balanced with the loss of thermal energy converted to potential energy, due to gravity, at this altitude. I realize that thermal energy can be defined in different ways, but here we define it as the internal energy of the gas due to its temperature. As altitude increases and we enter the stratosphere, either more multimers are formed or they get larger and internal energy increases more rapidly than thermal energy is converted into potential energy and the air temperature begins to increase. In the troposphere, there are no multimers and thermal energy is transformed into potential energy as the altitude increases and the air temperature steadily decreases (the “lapse rate”). This causes the slope change shown for region 1 (tropopause and stratosphere), seen in figure 2.
Ozone
Ozone concentration starts to increase with altitude in the stratosphere as well. The classical explanation for the formation of ozone is called the Chapman mechanism and it is illustrated in figure 4. Chapman hypothesized that ultraviolet light (UV) striking oxygen molecules will split them into individual oxygen atoms. He then speculates, that some of these would combine with nearby oxygen molecules and form ozone.

Figure 4 (source Connolly and Connolly, 2013)
There are several problems with the Chapman mechanism. First, it requires a great deal of energy to break a diatomic oxygen molecule’s bonds. Further, if the Chapman mechanism were the only mechanism forming ozone, why would ozone concentrations, in the Northern Hemisphere, be the highest in the Arctic in the spring? The equator (the red line in figure 5) receives the most UV from the sun, yet the ozone concentration there is much less than in the Arctic, the dark blue line in figure 5. Further, one would think that the Arctic and Northern Hemisphere ozone concentration would peak in the summer, yet it peaks in the spring and falls in the summer, and begins to increase in the winter. The Chapman mechanism also has other flaws as documented here.
According to classical theory, the extra energy in the tropopause and stratosphere that reverses the negative lapse rate seen in the troposphere, comes from “ozone heating.” Ozone absorbs UV light from the sun and radiates heat which warms the tropopause and stratosphere. Yet, the tropopause stays in place during Arctic and Antarctic winters when there is no sunlight. Given these contradictions, Connolly and Connolly came up with an alternative mechanism.

Figure 5 (source Connolly and Connolly, 2014, paper 2)
Ozone formed directly from oxygen multimers also requires UV radiation, but it requires much less than is required in the Chapman process. Figure 6 shows the process described in Connolly and Connolly (2014). There a multimer of eight oxygen atoms and four oxygen molecules is transformed into two ozone molecules and one regular oxygen molecule. This process requires sunlight and abundant multimers to work, but less energy. Further, the formation of the multimers, themselves, can occur without sunlight and the formation process releases heat of formation, which helps form the tropopause and warms the stratosphere.

Figure 6 (source Connolly and Connolly, 2013)
Their idea allows ozone to form more easily and with less energy and it provides additional energy during the Arctic and Antarctic winters when there is no sunlight for months. The idea that multimers make ozone easier to form, is only one of the potential impacts of possible multimer formation in the tropopause and stratosphere. Multimer formation may also influence tropospheric weather as discussed in Connolly and Connolly paper 2.
The Weather balloon data
Weather balloons record temperature (T), pressure (P) or sometimes altitude (h), horizontal wind speed and direction, and relative humidity. Relative humidity is converted into absolute humidity using the temperature. There have been one to four launches a day from about 1,000 stations around the world – in some cases since the 1950s or earlier. That is about 13 million datasets containing data from the ground to the mid-stratosphere (~30-35km altitude). A weather balloon launch in Chile is shown in figure 7.

Figure 7 (Weather balloon launch in Chile, source: European Southern Observatory)
Nobody had analyzed the weather balloon data in terms of molar density before, but it is quite straightforward to do. Molar density, D = n/V = P/(RT) (where R=8.314, is the universal gas constant). So, all you need to do is divide the P (Pressure) values by the corresponding T values (multiplied by 8.314). The units of “D” are moles/m3.
From a climate perspective, it is better to view the molar density versus pressure plot in terms of temperature and height as in figure 8. To compute temperature, we first have to compute best fit lines to each region of figure 2 to obtain slopes and intercepts. Connolly and Connolly call the slopes “a” and the intercepts “c,” such that:
D = aP + c … (3)
Therefore, since D = P/(RT) and using the ideal gas law:
 … (4)
… (4)
“R” is still the ideal gas constant equal to 8.3145 J/(mol.K). The coefficients, “a” and “c,” are not constants and vary from place to place. Typical a and c coefficients are shown in table 1. In figure 2, the “humid” phase in table 2 is region 3, the “light” phase is region 2 and the “heavy” phase is region 1 or the tropopause and stratosphere. A spreadsheet for computing temperature from the coefficients, using equation 4, is in the supplementary materials for Connolly and Connolly, paper 1. In table 1, there are two entries for the near Artic Norman Wells site. One is for the ground (g) and other is for the tropopause/stratosphere (u). Near the poles the heavy phase (multimer formation) can occur near the ground.

Table 1, from Connolly and Connolly, paper 1.
Using equation 4 and the coefficients of the best fit lines, like those in table 1, we can estimate temperature (T). This has been done in figure 8. Most of the balloon launch sites can be fit with two or three best fit lines. In figure 8, both are fit with three lines. Lake Charles, Louisiana is sub-tropical and the boundary layer requires a separate fit due to high humidity. Norman Wells, Northwest Territories, Canada requires three because the boundary layer, in winter time, can show a phase change very like the phase change observed in the tropopause. This might be due to the formation of multimers at the surface.

Figure 8, after Connolly and Connolly, paper 1
The boundary layer is defined, in the papers, as where the absolute humidity is greater than one gram of water per kg of air. This is roughly greater than 0.1%. As figure 2 shows, the slope is relatively more variable in this region (region 3). Changes in temperature, humidity and precipitation affect the slope in this region. The boundary layer may not exist in the Arctic and Antarctic in winter, where surface humidity can be very close to zero in cold weather. Yet, slope anomalies exist there as well, sometimes going the other way as seen in the Arctic (figure 8B). These Arctic and Antarctic winter anomalies look suspiciously like the tropopause anomalies.
Connolly and Connolly found that there is a change of state, that might be a phase change, at the top of the troposphere and a similar change occasionally at the surface, in the polar regions, in the winter. After accounting for this apparent phase change, they could describe the atmospheric temperature profiles of all ~13 million weather balloons entirely in terms of the thermodynamic properties of the bulk gases and humidity. For the Earth’s atmosphere, the bulk gases are N2, O2, argon and sometimes H2O. By “thermodynamic properties”, they mean the gas laws, the role of gravity, changes in state (i.e., phase changes), differing heat capacities, etc. Of the four bulk gases, only H2O is infrared-active and the influence H2O has on the atmospheric temperature profile has nothing to do with its infrared activity. Instead, it is related to its phase changes and the fact that it has a higher heat capacity than the other bulk gases.
The temperature fits did not require consideration of the CO2 concentration or any of the other infrared-active (“IR-active”) gases. If the effect of CO2 and other greenhouse gases were as strong as predicted by the climate models, one could reasonably expect that they would affect these temperature profiles.
Most versions of “the greenhouse effect” theory argue that the infrared activity of greenhouse gases (“GHG”) alters the atmospheric temperature profile. In particular, the models suggest that as carbon dioxide is added to the troposphere by man’s emissions, the troposphere should warm. This is supposed to be counteracted by increasing the speed of cooling. Thus, they predict that the troposphere warms and the stratosphere cools due to man’s carbon dioxide emissions changing the atmospheric temperature profile. Therefore, a debate exists over whether there is a “tropospheric hotspot” signature from GHG warming. Some also argue that there must be “stratospheric cooling.” But, the key to these theories is that the IR activity of the GHGs is supposed to in some way alter at least some part of the atmospheric temperature profile. This IR-based effect is the greenhouse effect. But, if the IR activity of the GHGs doesn’t influence atmospheric temperatures, as the Connolly’s found, then there isn’t a greenhouse gas greenhouse effect!
As mentioned above, their analysis of molar density versus pressure reveals a change in slope, probably due to a phase change, that occurs above the troposphere. This phase change can explain most, if not all, of the changes in temperature behavior associated with the tropopause and stratosphere. The tropopause and stratosphere are treated as distinct regions from the troposphere because they have different temperature behaviors than the troposphere. That is, the lapse rate approaches zero in the tropopause and becomes positive in the stratosphere. While this is true, the tropopause and stratosphere share the same molar density vs. pressure slope, intercept, and equation of state.
Multimers and the Ozone Layer
In Connolly and Connolly’s paper 2, they argue that the phase change identified in their paper 1 is due to the formation of oxygen (and possibly nitrogen) multimers, i.e., (O2)n, where n>1. The formation of multimers in the atmosphere is not a new idea and has been studied by Slanina, et al., 2001.
They also noted that if multimers are forming in the tropopause and the stratosphere, there is an alternative mechanism for the formation of ozone, which is much more rapid than the standard Chapman mechanism. That is, ozone (O3) could form directly from the photolysis of oxygen multimers, for example, a trimer (three linked O2 molecules) of oxygen could dissociate into two ozone molecules: (O2)3 + uv light → 2O3.
There is a remarkable correlation between the proposed phase change conditions and ozone concentrations, see figure 9. This is consistent with the Connolly’s mechanism for the formation of ozone, and suggests that the ozone is generated rapidly in situ. Table 2 lists the computed phase change conditions for 12 different regions, separated by latitude, around the world:

Table 2, Source: Connolly and Connolly paper 2

Figure 9, Source: Connolly and Connolly paper 2
Figure 9 shows the monthly variation of the optimal phase change pressure for several of the regions versus ozone formation (from NASA’s Total Ozone Mapping Spectrometer) for the same region. The correspondence between them is clear. It is interesting that the optimal pressure conditions for the phase change vary dramatically from month to month in each latitude band in figure 9 and that the level of ozone also varies dramatically from month to month. This suggests that ozone creation is very fast in the upper atmosphere, something that is consistent with the Connolly’s hypothesis, but not consistent with Chapman’s. It is also not consistent with the hypothesis that chlorofluorocarbons destroy the ozone layer, but that is another story.
Local Thermodynamic Equilibrium
Connolly and Connolly have shown, using the weather balloon data, that the atmosphere from the surface to the lower stratosphere, is in thermodynamic equilibrium. They detected no influence on the temperature profile from infrared active (IR-active) gases, including carbon dioxide. This is at odds with current climate models that assume that the atmosphere is only in local thermodynamic equilibrium as discussed by Pierrehumbert 2011 and others.
Climate models split the atmosphere vertically into many different layers, each a few kilometers thick, then the layers are broken up geographically into grid boxes. Each grid box is assumed to be in local thermodynamic equilibrium (LTE). These boxes are assumed to be thermodynamically isolated. However, within each grid box, the total energy content is assumed to be completely mixed. Because each box is isolated from the surrounding boxes, the rates of IR emission and absorption from the box are a function of:
-
The IR flux passing vertically through the box
- The current average temperature of the box
-
The concentrations of each of the IR-active gases in the box
Since they are thermodynamically isolated from each other, if a grid box absorbs more (or less) IR radiation than it emits, this will alter the energy content and average temperature of the box. For this reason, a grid box can develop an energetic imbalance relative to the surrounding grid boxes through radiative processes. Therefore, in the models, the presence of “greenhouse gases” (e.g., CO2) alters the underlying atmospheric temperature profiles. But, is this LTE assumption valid? So far, it has simply been assumed to be the case.
What would happen if the grid boxes are not thermodynamically isolated? Well, if one grid box becomes “hotter” or “colder” due to radiative heating/cooling than the surrounding boxes, then energy would flow between the neighboring grid boxes until thermodynamic equilibrium was restored. If the rates of energy flow are fast enough to maintain thermodynamic equilibrium then the radiatively-induced imbalances from the IR-active gases would disappear. Instead, the atmospheric temperature profile would be determined by the thermodynamic properties of the bulk gases. This is what Connolly and Connolly found was happening.
With thermodynamic equilibrium, we would still expect to see, the often observed, up-welling and down-welling IR radiation. We would also still expect the total outgoing IR radiation to remain roughly in balance with absorbed incoming solar radiation, as we currently observe. And, we would expect the IR spectrum to show the peaks and troughs characteristic of the main IR-active gases, i.e., H2O, CO2 and O3. However, Connolly and Connolly found that the IR-activity of these gases does not alter the atmospheric temperature profile.
Pervection
The standard mechanisms for energy transmission within the atmosphere usually considered are radiation, convection (of which there are three types: kinetic, thermal and latent) and conduction. Because air is a poor heat conductor, conduction’s role in atmospheric energy transmission is negligible. That initially would appear to leave just radiation and convection. Both radiation and convection move thermal energy slowly, too slowly to keep the atmosphere in thermodynamic equilibrium. However, we know from thermodynamics that thermal energy can be converted to work and transmitted and then turned back into thermal energy. Thermal energy transfer is not the only method of energy transfer at work in this equilibrium process.
Connolly and Connolly found that there is almost no experimental data on the rates of vertical convection outside of clouds and above the boundary layer. But, from the limited data they have, the rates of vertical convection appear to be too slow to maintain thermodynamic equilibrium from the surface to the stratosphere.
They found an additional energy transmission mechanism which seems to have been neglected, “through-mass” mechanical energy transmission. Unlike convection where the energy is only transported by a moving air mass, this mechanism allows mechanical energy to be transmitted through the air mass without the air itself having to move significantly. This is like conduction, except that conduction involves the transmission of thermal energy, while this mechanism involves the transmission of mechanical energy. To distinguish it from “convection” (which comes from the Latin for “carried with”), they use the term “pervection” (from the Latin for “carried through”). In this process, molecules collide transmitting mechanical energy to one another. An analogy would be a long tube filled with ping-pong balls and the tube is only wide enough for one ball. If a ping-pong ball is forced in one end of the tube, one will immediately be forced out the other end. None of the ping-pong balls move very far, but the energy is quickly transmitted, mechanically, a long distance.
In Connolly and Connolly paper 3, they designed a series of controlled experiments to try to quantify the relative rates of energy transmission of each of these mechanisms in air. Their experiments showed that, at ground level, energy transmission by pervection (aka “work”) is several orders of magnitude faster than conduction, convection or radiation! This then explains why the troposphere and stratosphere are not thermodynamically isolated, as the climate models assume.
Pervection is a mechanical energy transmission mechanism, not a thermal energy transmission mechanism, in common thermodynamic terms it can be considered “work.” Mechanical and thermal energy can be converted to one another as thermodynamics teaches us. So, either energy transmission mechanism can, and will, act to restore thermodynamic equilibrium. This also highlights why it is important to consider multiple types of energy and energy transmission mechanisms.
Conclusions
The three papers by Connolly and Connolly provide new data and analysis that show the IR-active trace gases in the atmosphere have an insignificant effect on the atmosphere’s vertical temperature profile. They show the atmosphere, at least to the lower stratosphere, is in thermodynamic equilibrium which invalidates the local thermodynamic equilibrium assumption used by the global climate models.
Unlike other critiques (Jelbring, 2003, Johnson 2010, O’Sullivan, et al. 2010, Hertzberg, et al. 2017, and Nikolov and Zeller, 2011) of the carbon dioxide climate control knob hypothesis (Lacis, et al., 2010), this analysis explains two lines of evidence often used to justify the carbon dioxide greenhouse effect:
-
Why is the lapse rate positive (temperature increasing with height) in the stratosphere?
- Why do we observe both upward and downward traveling IR radiation in the atmosphere?
The lapse rate, which averages about -6.5°C per kilometer in the troposphere, goes vertical and eventually reverses sign in the tropopause and stratosphere due, at least in part, to the formation of multimers according to Connolly and Connolly. The formation of multimers releases energy, which can account for at least some of the tropopause and stratospheric heating. IR-active atmospheric gases like water vapor and carbon dioxide do radiate IR in all directions and this can be detected, it is just that this radiation does not affect the atmospheric temperature profile significantly according to Connolly and Connolly’s work.
It takes less energy to form ozone directly from oxygen multimers than from splitting diatomic oxygen molecules, although both require UV light. Further, ozone formation does correlate well with the conditions required for multimer formation. Multimer formation does not require sunlight and can occur at night. Also, ozone concentrations in the ozone layer vary rapidly, suggesting ozone is created and destroyed monthly. This is inconsistent with the Chapman process.
The key problem with the conventional idea of IR-active gases, like carbon dioxide, influencing atmospheric temperatures is the concept that the atmosphere is only in local thermodynamic equilibrium. The weather balloon data strongly suggest that the atmosphere is in thermodynamic equilibrium, meaning IR-active gases have little to no influence on atmospheric temperatures. For this to be true a very fast energy transfer mechanism must be at work. Connolly and Connolly suggest that this transfer mechanism is mechanical in nature. Using thermodynamic terminology, the mechanism is “work.” They have proposed a name for the mechanism and call it “pervection.”
Currently, the multimer formation in the tropopause and stratosphere is speculative and requires experimental verification. Likewise, the details of forming ozone from oxygen multimers need to be worked out and documented. Pervection is a proposed name for a relatively obvious form of energy transfer that we observe all the time and has just been overlooked for some reason in climate science. Air is compressible, of course, but it does transmit mechanical energy. BB guns, air compressors and inflatable tires wouldn’t work without this energy transfer process.
So, clearly the Connolly and Connolly ideas need further work, but they have put together a very coherent and detailed hypothesis that deserves serious consideration. It is, at least, as well documented and supported as the conventional carbon dioxide greenhouse theory.
For those that want to read a more detailed summary of the Connolly’s work that includes a description of their laboratory work, I refer them to the Connolly’s summary here and to their three papers, linked at the top of this post.
I’ve been saying similar things here for several years but without much success.
Nice to see the concept getting a proper airing at last.
Interested readers will want to read this comment by Ronan Connolly. It answers many of the questions in earlier comments: https://wattsupwiththat.com/2017/08/22/review-and-summary-of-three-important-atmospheric-physics-papers/comment-page-1/#comment-2587932
Where I do take issue with these authors is in their use of the term ‘pervection’. In my view convection is perfectly adequate to explain observations when one takes into account the mechanical conversion of KE (heat) to PE (not heat) in ascent and the reverse in descent.
Stephen, Convection means carrying the thermal energy with the mass as internal energy. This process, when modeled, is way too slow to allow atmospheric thermal equilibrium for the lower 35 km of the atmosphere. Thus, we get into a verbal definition trap. So, the Connolly’s (quite correctly IMHO) decided to make a new term for the energy transmitted (during convective action to be sure!) but transmitted mechanically. Then they measured the speed and found it was very fast, fast enough to account for thermodynamic equilibrium over the lower 35 km of the atmosphere. I realize that introducing a new term for energy transmission can put off a reader, it put me off for a while. But, once you think about the speed issue, you see why they did it. It is key to seeing how the atmosphere can be in overall thermodynamic equilibrium. If you box yourself in, only considering convection and radiation, you are led to Local Thermodynamic Equilibrium only.
Andy,
For an atmosphere in equilibrium as a whole the downward force of gravity must on average exactly offset the upward pressure gradient force created by heating at the surface beneath that atmosphere. Isolating the lower 35km is not appropriate. There is convective overturning above that height too. When the entire atmosphere is considered one only needs convection, no need for ‘pervection’.
Convection uses work done against gravity in uplift and work done with gravity in descent to switch internal energy between KE (heat) and PE (not heat) as necessary to maintain equilibrium between the downward force of gravity and the upward pressure gradient force. That is the only mechanical process required.
That switching process serves to neutralise any radiative imbalances that are internally induced.
Instead of transmitting energy as proposed by the authors there is a transformation of energy between KE and PE whenever and wherever a change in height occurs.
Proposing some novel form of energy transmission is unnecessary if one can have a transformation instead.
Only in failing to note that process of energy transformation does it become necessary to propose some novel form of energy transmission.
Convective velocity is analogous to drift velocity of electrons in a conductor..for all real world electrical applications, drift velocity is under c/10 (exception being superconductors ). The electric field is however, just under c.
Or simply put, pervection velocity is sonic.
-Stephen
I don’t mean to put words in Andy’s mouth ( or the Connolly’s) and I barely understand the hypothesis, but I don’t think they are proposing a “new form” of energy transmission. Just breaking out an aspect of convection that they believe is largely unrecognized and important and therefore identifying it separately.
John Harmsworth and Stephen Wilde, John, I think you are closer. It is not like mechanical energy transfer is or was unknown, it just is not included in the climate models. Leaving it out has led to the wrong conclusions about equilibrium. After all, no one has proven that local thermodynamic equilibrium exists. It is just an assumption that has been made because models show that radiative transfer and convection are too slow. They felt the trunk and the leg and missed the elephant. By naming “pervection” the Connolly’s are just trying to get people to notice it.
In liquid piping systems, movement of substances such as water or oil in long sections of pipe can involve a very considerable mass and hence momentum. Where and how does this energy manifest itself. Water “hammer” is known to most people, as it can damage piping in homes, even in small water lines across quite short distances. In larger pipelines for oil, water or other liquids it is extremely important that one not attempt to stop flow instantaneously as major damage can occur as a result of the hydrostatic pressures directed at the stoppage point and reverberating back as a shock wave. This damage is a function of the large momentum inherent in the motion of the mass along the entire length of line. It can be very substantial.
Whereas liquids are incompressible and this type of damage can result, gases are not. However, an equal mass of gas in motion contains an equal quantity of momentum energy. As it slows it will compress and rise in temperature instead of creating hydrostatic pressures. No question that large amounts of heat move around the planet as motion of bodies of air. IMO.
It’s all vapor and light condensation that evaporates before the surfaces, excepts what sticks as dew depending on surface temp. Cars have dew, driveways do not.
The tendency to isolate grid cells, as if no energy moves sideways is just plain stupid, and is why the CAGW models fail. It’s not ALL radiative physics …. there is a lot of kinetic energy involved as well. … and a lot of that is chaotic.
The big effect is under clear calm skies, at the surface there is almost no wind. This is a radiative effect.
Dr Deanster,
I think it’s the other way around. Radiation goes in all direction connecting all grid cells to each other at the speed of light.
The premise here seems to be that the ‘disconnected’ cells happen to absorb more or less photons then they emit and must be rebalanced by collisions which won’t happen between disconnected cells.
Kirchoff’s law is a bulk property, so it’s not clear that it still applies in the limit as assumed by Pierrehumbert. There also seems to be an over generalization of Equipartition of Energy. It’s generally interpreted as meaning that energy stored in all degrees of freedom will be freely exchanged among the molecules until all degrees of freedom are balanced. While this is true with degrees of freedom related to mass in motion, it’s not necessarily true with state energy which is basically stored as a resonant wave in the electron cloud of a molecule which can only be emitted as a photon or completely exchanged with another molecule that has the same resonances, i,e, another GHG molecule of the same type.
Radiation physics textbooks generally consider only a homogeneous gas, where as a mode of relaxation, an energized molecule collides with a ground state molecule and after the collision the energized molecule is now in the ground state, while the ground state molecule is now energized. This is a lossless transfer of state energy which if I recall, is related to the formation of Cooper Pairs in superconductors. This relaxation mode combined with Equipartition of Energy suggests that state energy stored as an EM wave must be directly converted into the energy of mass in motion in order to achieve LTE. The problem is that state energy is quantized in relative large chunks of energy, compared to that in the mechanical degrees of freedom and Quantum Mechanics requires that the entire quanta of energy be exchanged or emitted in one event. This doesn’t seem likely to occur since the kinetic energy of a molecule in motion is already about the same as the energy of a photon in the LWIR spectrum emitted by the planet, thus for all intents and purposes, it already satisfies Equipartition of Energy as a bulk property.
It seems to me that at least in the limit, Kirchoff’s Law and Equipartition of Energy should apply independently to state energy and the energy of mass in motion and combined only as a bulk property.
I also think that there are 2 different kinds of rotation. One is a physical rotation of the molecule, which is mass in motion and is not quantized and the other is a rotating wave in the electron cloud which is quantized and more closely related to quantum mechanical ‘spin’. This addresses the counter example where rotation modes are suggested as one of the mechanisms which converts between the energy of matter in motion and energy stored as E-fields in motion.
I agree Steven, “pervection” is a rather ugly word too close to other words beginning with “perv…”
Plus as you say, semantically it is redundant.
water gas is going to the stratosphere no matter what temperature simply cuz of gravity. not even any need for convection.
Kinetic energy is velocity (squared) mass where heat energy is its own property. One can see pervection in the anvil top of mesoscale cumulonimbus clouds. The convective kinetic energy changes the stratopause shape and upsets the order of the stratosphere.
The energy in cumulonimbus anvils is from excess kinetic energy originally from the surface pushing up into the stratosphere and being prevented from going even higher by the reverse lapse rate slope caused by ozone absorbing solar energy directly.
Since further upward movement is constrained the warmer air in the updraft pushes sideways instead and the sideways movement into colder air at the relevant height finally converts the residual excess kinetic energy into potential energy prior to descent in the adjacent descending cell.
The spreading anvil actually proves my point.
The thing is that all this is implied by general meteorology but that is a specialised discipline that climatologists seem to have never got to grips with.
Thunderstorms distort pressure above and below. The reduced density below plus dynamic pressure (density velocity squared) drops pressure while the dynamic pressure above further distorts the stratopause.
Andy.
There is so new much in this!
Talk about settled science…
Great to see this view of atmospheric physics through the eyes of a Petrophysicist.
Congratulations.
This makes two papers in a row that have been really interesting. The astronomical cycles papers, and now this one.
I say get it peer reviewed and get it in the pipeline for the next piece of crap out of the IPCC. …. could make the next piece of crap from the IPCC a little less crappy.
It will not happen. After all the Team have already redefined what peer review is.
Dr. Deanster, I agree. The Connolly’s should pull together a paper and submit it for peer-review. I’ve volunteered to help if they need it. But, it is a pain. I submitted a paper (not on this topic) for peer review over a month ago and they are still looking for reviewers!
What better peer-review than publication here? This is honest, ruthless, trans-disciplinary, happens in real-time, with no-holds-barred, and conflicts-of-interest exposed. Formal academic peer-review is shallow, procedural, silo’d, corrupt, terminally politicized, and unwieldy. We can (and do) do better than that, and do it almost all of the time.
“I say get it peer reviewed…” I couldn’t agree more. They have had 4 years to do so and no sign yet…
It’s being peer reviewed, right now.
Just not using the older, hopelessly corrupted, process.
I am curious what seaice1 would say if it passes peer-review,…..
…fossil fuel funded anti science old white guys
David A. Ouch, I am not old!
David Ball: “I am curious what seaice1 would say if it passes peer-review,…..”
I will of course respect the paper a whole lot more. I will have confidence that the paper does not contain egregious mistakes and that it reviews the current literature reasonably.
As it is, the whole idea of oligomers of N2 and O2 held together by van der Waal’s forces seems wrong. The authors even tell us these sort of agglomerates have only been detected under very different conditions or at trace levels. Their hypothesis requires a large proportion of the gases to be in this agglomerated form. I am suspicious of their calculation of heats of formation as it looks more like a calculation of heat capacity. I am suspicious of treating the van der Waals bonds in the same way as covalent bonds for some purposes and for allowing the vibrational modes in these bonds to be degrees of freedom. These may be OK, but I have serious doubts. If it had been peer reviewed I would have confidence that these aspects had been checked at a reasonably high level. That would not mean that I would blindly accept the conclusions, but I could accept that the work had been performed at an acceptable level to be worth considering.
As it is I would have to research each of these aspects myself. I could probably do it to my satisfaction for these papers, but why should I pick these over 1000’s out there? Just on law of averages most will fail. I cannot review every paper myself, nobody can.
As it is, the process here is also a form of review. I will have a look at the comments and I may find that the review has found fatal errors, or I may find that there are explanations for my concerns. So the review here is not worthless, but it does not have the same weight as peer review.
Seaice1
“I will have a look at the comments and I may find that the review has found fatal errors, or I may find that there are explanations for my concerns. So the review here is not worthless, but it does not have the same weight as peer review”
Spoken like a true follower, when someone else does tell you what to think of the paper please let us all know right away, i for one am waiting with great anticipation.
I think that is a fair assessment by seaice. It definitely needs some attention from an atmospheric physicist with an open mind to provide a first appraisal and see if it is worthy of greater attention or publishing. Hopefully, this site can help provide some critique and direction, and perhaps a connection to more meaningful analysis. It’s implications are certainly interesting.
Thank you John Harmsworth, and I think Bob Boder has missed the point.
“I am suspicious of their calculation of heats of formation as it looks more like a calculation of heat capacity.”
No. From the description above, its simply 1/2 the translational degree of freedom because 4 rather than two molecules ( minus the small increase within) move together provides the heat for the PV work. I’ve yet to read the paper but the real problems is why should they spontaneously form and more as the air thins out?
because 4 rather than two atoms.
I actual reminded myself before typing not to make that mistake.
I suggest considering the movement of charge for the formation of ozone: e + O2 -> O- + O; O- + O2 -> O3 + e. It’s called associative detachment and has huge low energy cross sections which does not require a third body for conservation of momentum.
Andy, thanks for drawing attention to these papers. I thought they would be gamechangers at the time, but the alarmist bandwagon rolled on and took no notice. One small edit: temperatures in the tropopause do not rise with altitude (the graph shows this, but the text is misleading).
Thanks Ron, I made the wording more clear.
Whats the difference between “purvection” and conduction?
Pervection is mechanical, energy is transmitted via work. Conduction is thermal energy transfer, Conduction is very slow and pervection is very fast.
That much is obvious, but what is meant by pervection. The pingpong balls in a tube is a great analogy for describing the effect but simply doesn’t map to the atmosphere where that effect becomes non-directional and…conduction. Or at least that’s how it seems to me.
Tim, there is more here: https://wattsupwiththat.com/2017/08/22/review-and-summary-of-three-important-atmospheric-physics-papers/#comment-2587932
Being flippant, who would have thought that!
Obviously, the source material needs to be studied before meaningfully commenting, but I have for years suggested that people may well be confusing the radiative effect of water vapour with the effect it has by virtue of its latent heat content.
The reason why deserts (such as the Sahara) cool down so much at night is not because they have clear skies with no DWLWIR being provided by clouds, but because there is little energy entrained in the dry atmosphere. it has little energy to give up so when the sun goes down, the nighttime temperatures cool rapidly, and since the atmosphere contains little energy as soon as the sun gets up, the day time temperatures rapidly warm. Little energy, no inertia.
Just a few hundred kilometers from the Sahara on the shores of the Mediterranean one sees a completely different temperature profile. One has clear cloudless nights but temperatures remain high well into the early hours of the morning. When the sun gets up the following day, the day time temperatures take time to warm. On the shores of the Mediterranean the air is humid. It contains a lot of energy which needs to dissipate such that it takes time to cool, and since in relative terms it still possesses considerable energy, it is slow to warm the following day when the sun is up. It has a lot of inertia.
On the shores of the Mediterranean in summer, a cloudy night is usual a cool night, whereas a cloudless night is usually warm.
Yep, it condenses, and the radiation from condensation light’s up the water vapor cloud in the troposhhere, evaporating water. this cycle becomes a heat pipe, warm surface evaporate water, rises, condenses at the top. It all depends on air temp and water load, and yes pressure would also respond. How much does the atm column collapse under clear skies at night, and then how much does it go up during the day? that is solar storage of energy as water vapor, that is then released only after air temp drops, when rel humidity get over ~60%, whether there are either trimer, or just more water molecules involved in the condense and evaporate cycle, I don’t know. But it is a temperature that is defined by air temp and pressure, and how much water vapor the air is carrying.
This is what keep the surface warmer than it should be. But it also regulates the impact of the other GHG’s!!!!!!
It counters them with a nearly equivalent negative feedback. I have been yelling about this since last year. There is almost no impact from co2, this explains it.
The energy stored in even 1,000′ of atm height, all that energy get radiated in the upper troposphere over night, depending on air temp and pressure, as the OP describes. It’s a heat engine. and that prevents the loss of temps the deserts have at night.
I don’t disagree with Richard or Micro. I would only add that conditions must change higher in the atmosphere where water vapour is negligible. We know that all heat eventually leaves the planet. GHG theory is all about how long it takes to escape, and that question is dependent on mechanisms of heat transport from the lower atmosphere to altitude. I don’t know if the Connolly’s are on the right track but it looks a lot more like science than anything I’ve scene from mainstream climate science like the Hockey Stick clowns.
As OP mentions, it’s temp/pressure where the water vapor condenses at the top. It’s working just like the heat pipe in your laptop does, minus tubes which constrains the ir from the heat of condensation. That IR, keeps the sure warm. But because it’s reference point is independent on co2, this process takes a 0.85C day time increase for instant, and reduces it to a tenth of a degree or two.
richard verney August 22, 2017 at 6:19 am
Imo it is the other way around. The dry soil in deserts warms up easily and loses energy fast as well.
Wet soil and oceans warm up and cool much slower.
The atmosphere close to the ground follows the temperature of the surface closely.
After sunset with a dry atmosphere the atmospheric window is wide open and the ground loses energy directly to space fast. Higher up the atmosphere doesn’t cool that much.
This is how Nocturnal Inversions are created.
Posted on another blog
These are the formation of a vertical heat pipe that uses water vapor as the working fluid. This process is what limits how far temps fall at night.
Are you suggesting that the collisions aren’t so much conducting the energy throughout the atmosphere as they are “lifting” the atmosphere? Or something like that?
Yes, in a sense. The Connolly’s liken it to a Newton’s cradle toy. The steel balls in the center don’t move, but they push the far ball way in the air. This is pervection. I used a tube filled with ping pong balls, same thing. Air is compressible to be sure, but not completely, thus inflatable tires work, airplanes can fly, etc. If you excite air molecules, they will strike neighboring molecules and they move. Look at the experimental work that the Connolly’s did in section 3 of their paper 3. That explains it fairly well. see here: http://oprj.net/articles/atmospheric-science/25
Conversion of PE to KE in descending air manifests as a rise in temperature as per the Gas Laws because molecules move closer together when air descends and that higher temperature tries to push the molecules further apart but the lower height means that the air above is heavier so that moving apart is constrained and the temperature rise is preserved along the lapse rate slope.
Conversion of KE to PE in rising air manifests as a fall in temperature as per the Gas Laws because molecules move further apart when air rises but the greater height means that the air above is lighter so that they cannot move closer together and the temperature fall is preserved along the lapse rate slope.
The authors are reinventing the wheel with the concept of ‘pervection’.
Convection is not just localised parcels of rising air. At any given moment half the atmosphere is slowly spiralling downwards in high pressure cells and half is spiralling upwards in low pressure cells.
If anyone thinks that convection is not sufficient then they have a conceptual error somewhere in their analysis.
The atmosphere as a whole is forever in hydrostatic equilibrium whereby radiative imbalances are neutralised by convective adjustments.
I believe there is still an aspect of work in addition to the described convection in that there will be momentum in any moving mass of air. It may not seem like air has a great deal of mass or momentum when looked at on the cubic foot scale but the entire atmosphere is in constant motion. That is massive work being done every second, vertically and horizontally and represents enormous energy.
John Harmsworth
Agreed. Zonal wind speed at 60 degree South are a good example. The mass increased along with speed. The effects of both have profound effects on SH “average” temperature and barrier to vortex entry.
It is doing work.
Andy, very interesting, just a few questions that went over my head.
1) What is/are the ‘bond’ that holds Multimers together?
2) How can O2 go through a phase change at our atmospheric pressure/temp?
3) Fig. 6 still shows the breaking of the diatomic oxygen bonds. How is this done with less energy?
If it is obvious in the article, just tell me to read it again (and again). Don’t want to waste your time.
Duncan, 1) Van der Waals forces
2) Some lab work shows that, at the temperatures seen in the troposphere, some multimers will form. But, this is an area that needs more work to be sure.
3) This is another area that needs more laboratory verification, but chemical theory suggests it should work. I’ll ask Ronan and Michael to comment further.
Thanks Andy, #3 was my major mental sticking point. Possibly some sort of Isotope exchange?? Anyway beyond my Chemistry 101.
Oxygen and nitrogen telomere formed at low pressure. Wow that is new! Telomer formation according to thermodynamics is favoured at high pressures not low. Therefore there should be evidence in the gas law (pV = nRT) for oxygen, and nitrogen . This would be possible to observe in a ground based lab. Show me this evidence and we can take this seriously. At conditions near the boiling point of certain gases these telomers are believed to form , the most notable case is in hydrogen fluoride gas which telomerises before condensation. This has been shown in laboratories by deviations from the gas law. Now according to the graph oxygen and nitrogen are at temperatures well above their normal boiling points some 80K at 1atm pressure.they are at pressures well below normal atmosphere. Show me real evidence for these telomers and you have Nobel prize material. Congratulations.
Seriously The only form of attraction detected between Nitrogen molecules are van Der Waal forces which are incredibly weaker than proper bindings. For HF we have hydrogen bonding to form these telomers which are orders of magnitude greater than Van Der Waal forces and are about a tenth of the strength of a proper covalent bond, so we get weak association at high pressure. So everything is wrong for these nitrogen and oxygen telomers
Duncan,
The gas law deviations for oxygen and nitrogen have been measured and are accounted for by the deviations to the gas law. The van Der Waal forces are much weaker than hydrogen bonding which is much weaker than covalent bonding. We know the effects of van Der Waal and they do not form multimeres/telomers they just give a small deviation to the gas law.
The idea that multimers form at low pressure rather than high pressure is very novel and against thechemical equilibrium laws. (Dissascosiation constant etc)
Here is a partial answer: https://wattsupwiththat.com/2017/08/22/review-and-summary-of-three-important-atmospheric-physics-papers/#comment-2587932
…But they present new data and a novel interpretation of energy flow in the atmosphere that should be seriously considered in the climate change debate…
Does that interpretation exaggerate the warming effect of CO2? If so, it will be gleefully embraced. If not, it will be ignored…
It nullifies almost all of it.
It will be interesting to see how this holds up under critical review.
Andy, let me try again. As an alternative to multimers, let me suggest associative detachment created by following the electrons moved along magnetic field lines. The reaction proceeds in two steps: O2 + e -> O- + O; O- + O2 -> O3 + e. The cross sections for the second reaction are huge at low energy and don’t require a third body for conservation of momentum. This allows for the ozone differential from the tropics to the poles.
John Mauer, Very good question! I don’t know the answer, but I’ve forwarded it to Ronan and Michael.
The tetramer of oxygen will be governed by the law p (O8) = K p(O2)^4 where p(O8) is the pressure of the tetramer and p(O2) is the pressure of normal oxygen and ^4 is being raised to the fourth power and K is a constant, from the equation deltaG = -RT ln K, where deltaG is the free energy change of the reaction R is the gas constant and T is the absolute temperature. Please explain how using typical Van der Waals energy for the tetramer at 200K how the compound forms at low pressure but not at high pressure?
I will be very interested in your result
Dave, this is Michael Connolly’s answer: “The relationship between the partial pressures of monomers and multimers is indeed given by deltaG = -RT ln K so the ratio of multimer will come down to the value of deltaG
In an open system like the atmosphere this depends on a lot of different energy parameters as we explain in equation 17 of paper II. Van der Waal forces is a generic name for a lot of different types of interactions, both Coulombic and magnetic. The oxygen monomer is paramagnetic where as the dimer is diamagnetic larger multimers might also be diamagnetic, but this is conjecture at this point. Given the possible stabilization of diamagnetic multimers and the deltaH values of Table2 it is possible that the concentrations of multimers could be significant as we propose.”
It is important to realize the Connolly’s have no experimental evidence for the multimers, they are speculative at this point. Their lab work and work with weather balloons establish that pervection is a rapid form of energy transfer and that the atmosphere is in thermodynamic equilibrium to 35 km, but the multimers and the ozone formation are hypotheses that need experimental verification.
Serious question, would it not be relatively simple to establish the existence of multimers in the lab? After all, they say that the bonds between the molecules count as vibrational degrees of freedom, so these could easily be detected by spectroscopy.
So you cannot explain the fourth power that comes into the standard equation. I.e. by halving the pressure then the pressure of tetramer will go down by (0.5)^2 i.e. 1/16 yet these tetramer appear at low pressure not high. They are therefore in contravention of the equilibrium laws that are obtained fromcombining the deltaG values of the individual species. As I state elsewhere Hydrogen fluoride gas forms multimers at pressures and temperatures approaching the dew point. Your T etramers are behaving completely opposite to these well established multimers and in contradiction to established equilibrium laws.
In addition Hydrogen fluoride forms extremely strong hydrogen bonds and is highly polar. Oxygen does not contain hydrogen and is not polar so one would expect any intermolecular bonding to be much weaker than in HF. I.e. if you are going to see multimers they will be just above oxygen boiling point and at high pressure not at 200K and at near vacuum conditions.
For real associations between non polar moleculesvyou will need to go down to less than 10K. I.e. -263°C
Dave and others on multimers, see this comment by Ronan. I knoew about their experiements on multimers at tropospheric pressures and temperatures, but did not feel free to share the information. https://wattsupwiththat.com/2017/08/22/review-and-summary-of-three-important-atmospheric-physics-papers/comment-page-1/#comment-2589155
Interesting modeling of the upper atmosphere. This should get a fair amount of discussion.
“They found an additional energy transmission mechanism which seems to have been neglected, “through-mass” mechanical energy transmission. Unlike convection where the energy is only transported by a moving air mass, this mechanism allows mechanical energy to be transmitted through the air mass without the air itself having to move significantly. This is like conduction, except that conduction involves the transmission of thermal energy, while this mechanism involves the transmission of mechanical energy. To distinguish it from “convection” (which comes from the Latin for “carried with”), they use the term “pervection” (from the Latin for “carried through”).”
With a similar mechanism, a wave also transports energy in any medium. Also the energy during an El Nino is largely transported in such a way, only there is an up and down welling. There is also transport of the heat without the single water molecule from Sumatra to South America must migrate. The energy is given from molecule to molekule. In conjunction with the higher solar irradiation during an El Nino in the respective area, the positive anomaly is thus created.. Also boiling water gives Energy from molecule to molecule. There is no mechanism, that the water molecule, which heated most at the ground of the pot, rise to the top. In Fact, the molecules come in a circling motion and gives their motion-energie from molecule to molecule. That is the mechanism of boiling water. There is so much to learn in the science of the atmosphere.
El Nino’s just releases large amounts of water vapor downwind, and it’s actually trapped in the NH as well for the most part. Then MinT follows dew point temps. Same with ocean cycles.
Please explain why the above curve is exactly (almost, only takes minor adjustments in the scale of temperature/speed to make them identical) the same shape as the speed of sound curve in atmosphere by height?
Does this change in speed slow down/speed up the transfer of energy through the atmosphere?
http://www.techniklexikon.net/images/a1688_die_atmosphaere.gif
Here is a link to Wikipedia with both on the same graph.
https://en.wikipedia.org/wiki/Template:Comparison_US_standard_atmosphere_1962.svg#/media/File:Comparison_US_standard_atmosphere_1962.svg
That is interesting. The speed of sound would vary with the pressure/temperature which varies with the density of the medium at diffing altitudes?
At first I thought it was density, however, I then noticed that both density and pressure drop 20 esentially ZERO above 30 kilometers. Also does not explain why the speed follows density in the lower atmosphere and then is inverse to density/pressure from 10 to 30 kilometers and then back the other way again just like temperature. Is it some kind of Quantum Mechanics phenomena?
Very interesting. I’m not sure why the speed of sound varies so precisely with atmospheric temperature.
@ur momisugly Andy May if you are reading this I would appreciate your thoughts on the following post at 1:32
Look at the graph on the Wikipedia link. Note that temperature an speed of sound BOTH change in a peculiar fashion with height. Below 30km they change in relation with height/density/pressure UP TO 10 km. Then temperature and the speed of sound vary inversely with height/density/pressure. Thern above 30km, where the pressure and density are essentially 0.0, bothe the speed of sound AND Temperature decrease with height up to 80 km whereupon it then begins decreasing! WHY. WHY? at all heights above 30km the density/pressure as almost the same as outer space, very close to zero. That tells me there is a great distance between molecules. So just what is heating them? Then what is cooling them. and again at the highest height what is heating them again where they are the closest to absolute zero – outer space? Logic says they should continue cooling.
Is all of this an aberration to the method of determining temperature? From my days in college (50 years ago) I was told that temperature is a crude measurement of the strength of the energy. The average kinetic energy of all the atoms or molecules of that substance. With less atoms per unit area there should be LESS average kinetic energy! My Nuclear Physics training tells me that with FEWER atoms per unit area there are fewer collisions and a much smaller chance of energy transfer by particle capture. Seems to me that no one knows what they are measuring.
I really don’t know what is happening. The Connolly’s ideas are one of many possible answers. By the way, sound is a form of pervection, but sound travels slower than the pervection the Connolly’s measured.
Temperature is the average Kinetic Energy of the atoms (and/or molecules) in that space. Does not matter how many there are. But temperature loses its meaning (or, usefulness) if there are only a handful per cubic centimeter.
High temps in the Thermosphere results from absorption of the high-energy UV radiation from the sun by the atoms (O, N, Ar, H) and any molecules (N2, O2, O3, H2O, CO2, ) that have not dissociated already. Of course many are ions (OH-), and there are free electrons floating about as well.
Speed of sound is exactly what the Connelleys were describing. Energy traveling faster than the medium.
Temperature as measurement includes all forms energy flowing where you do the measurement. It is the net flow in a point resulting from all work and flowing energy in the surroundings.
An observed temperature is the sum of all work and heat from points of higher emissive power.
Temperature, representing emissive power/T⁴, determines all rates of all processes transferring energy in the system. The processes of transfer only exist because there is a heat flow, they determines nothing. That is why a probabilistic energy density analysis based on only heat source power and geometry gives a correct profile with high accuracy. And it includes the force of gravity as thermal resistance with units Nm² instead of Nm. N/m² is exactly equal to W/m². Consider the failure of climate science when you see what temperature that is equal to the thermal resistance of 4g². And that tropopause temperature equals 4/3*g².
Close. Now get rid of the words “heat” and “heat flow”.
Nope, why should I?
The definition is kinetic energy in mass. What drives the kinetic transfer of energy through the molecules? That´s right, heat.
Nope, it’s all energy.
“N/m² is exactly equal to W/m².”
Can you explain this?
There was an article here recently looking at dimensional analysis, which revealed interesting relationships between units.
N/m2 is pressure, or force per area.
W/m2 is power per unit area
Power has dimensions mass x length^2 x time^-3
Divide this by length^2 (m2) we get mass x time^-3
Newton has dimensions mass x length x time^-2
Divide by length^2 we get mass x length^-1 x time ^-2
We can convert N/m2 to W/m2 by multiplying by length x time^-1, or say m/s, which is speed.
A diversion perhaps, but how can you say N/m2 is equal to W/m2?
Both units are energy applied to a unit of area. Energy is energy I guess but I don’t see this “equivalence” as being very useful rather than seeing it just as a relationship.
“Both units are energy applied to a unit of area. ”
Not really. One is energy per unit area and one is force per unit area. Unless you want to argue that energy and force are the same then that is not true.
“The atmospheric temperature profile does not appear to be influenced, to any measurable extent, by infrared active gases like carbon dioxide.” Everything old is new again. In a review of Callendar’s famous paper on CO2 causing atmospheric temperature changes:
Sir George Simpson, reply to Callendar, Quarterly Journal of the Royal Meteorological Society, vol. 64, issue 275, pp. 223-240, 1938
“In the first place he thought it was not sufficiently realized by non-meteorologists who came for the first time to help the Society in its study, that it was impossible to solve the problem of the temperature distribution in the atmosphere by working out the radiation. The atmosphere was not in a state of radiative equilibrium, and it also received heat by transfer from one part to another. In the second place, one had to remember that the temperature distribution in the atmosphere was determined almost entirely by the movement of the air up and down. This forced the atmosphere into a temperature distribution which was quite out of balance with the radiation. One could not, therefore, calculate the effect of changing any one factor in the atmosphere, and he felt that the actual numerical results which Mr. Callendar had obtained could not be used to give a definite indication of the order of magnitude of the effect.”
This is one of the issues with our atmosphere; the convective nature, and convection over powers everything.
Think of a BBQ. The heat starts off as radiative energy from the charcoal, but one cooks the steak by convection not by radiaive energy.
One can cook a steak 18 inches above a BBQ, but not 18 inches to the side or 18 inches underneath, notwithstanding that if one were to measure the temperature of a BBQ, with say a pyrometer from the side or from the underneath, it would show that the BBQ was equally hot.
The radiative signal is there when viewed from underneath, but it does not enable work to be done. The work is moved by convection.
Nice analogue, richard.
So the CO2 my barbecue produces isn’t helping me much?
” but one cooks the steak by convection not by radiative energy.”
I cook my bacon under a grill. This is entirely radiative energy. To be honest, I don’t know the amount of energy transmitted to my food on barbecue by convection, but I think comparing it to my grill it is probably mostly radiative rather than convection. I have never seen a barbecue design that allows food to be placed underneath the hot coals. The problem would be that the ash would fall on the food. So my electric grill works by having a very hot element above the food, and my barbecue works by having very hot coals below my food, but both seem to work in the same way.
I have an electric oven which radiatively heats from above when on broil. It can also be set on broil with convection which cooks food much faster .
@seaice1 August 22, 2017 at 1:38 pm
You fail to grasp the point. To cook bacon under a grill one has to be within inches of the grill (often in an enclosed space at that). You cannot cook your bacon say 18 inches underneath the grill, because the radiative energy is over powered by convection. And this planet has a convective atmosphere, and this is the work horse.
http://www.rangecookers.co.uk/files/electric_grills.jpg
Hey Richard, maybe your barbecue is different from mine. Others also think it is mainly radiation.
“Radiation is the transfer of heat by direct exposure to a source of light energy… This is how most charcoal grills cook.”
“Charcoal grills produce a lot of direct scorching infrared radiation that is converted to heat when it strikes food. Gas and pellet grills produce mostly convection heat.”
Maybe you are thinking if a gas or pellet grill and I am thinking of a charcoal grill. BBQ suggests charcoal to me.
Paul and Richard, very valid points and very pertinent to the Connolly’s work.
Am familiar with VanDerWaal forces from a different field, graphene clumping. Am also familiar with dimer/trimer formation in a different foeld, anionic surfactant synthesis, when you want to minimize them in the finished ether precursor and then remove the rest by fractional distillation prior to streckerization. Have not done the math, but my intuition suggests that VanDerWall forces are insuffient to form gas multimers as posited. There just isn’t enough force between ordinary gas molecules in the conditions of the region where posited. A graphene has a very high surface to mass ratio, so the force is appreciable under room temperature conditions.
what about water blob creation, growth and destruction? Or are there other terms for that?
Water has very significant hydrogen bonding not present in N2 and O2.
I saw after I posted he was talking about N2 and O2. It’s just WV I think.
I just can’t get anyone to understand the negative feedback response it has to have to any effect from any additional warming.
Micro6500, A forming water “blob” is a very large multimer.
I too am concerned by the weak nature of Van der Waal forces.
It seems to me that there is a need for some experimentation to back up some of the claims being made
Richard, very true. I’m hoping the post will spur someone to do the laboratory work needed to verify or disprove the hypothesis.
Yes, but they report just such experiments that show the multimers are present only at trace levels.
They can and have been observed at 5K yes that’s -269°C. If you warm them up they fall apart.so 200K as in the atmosphere is positively scorching. With highly polar molecules with hydrogen the hydrogen bonding can make these multimers a bit more robust. But oxygen and nitrogen do not have hydrogen so we are back to 5K to try and find them
Certainly these papers should be peer reviewed.
I’ve found out why there is so little warming from the increase in co2. And why temps are doing what they are.
It has nothing to do with Co2, and I’m a multi discipline data/circuit analyst. There are no amount of me editing my work that would meet anyone’s approval, because it’s the end of the ride.
The OP’s original premise is fundamentally correct, he just missed that the water vapor is doing work(inflating the atm column daily), and the by product of that work keeps the surface following dew point.
Someone should review the CERN CLOUD experiment results.
Andy,
You remark, “Further, if the Chapman mechanism were the only mechanism forming ozone, why would ozone concentrations, in the Northern Hemisphere, be the highest in the Arctic in the spring?”
Both the Artic and Antarctic have anomalous high concentrations of ozone outside the polar vortexes during the Spring, and disappear when the vortexes break up in late-Spring. The explanation appears to be in the Brewer-Dobson circulation being impeded by the vortices. It should be noted that the ozone concentrations are not uniformly distributed (look at any collection of NOAA/NASA ozone ‘depletion’ maps) and probably reflect differences in diurnal ozone generation, winds, and other atmospheric phenomena, particularly in proximity to the vortices.
What about particle radiation as a cause for ozone formation? It’s concentrated at the poles.