Guest Post by Wim Röst
Introduction
Today ‘warm’ is strongly connected with ‘climate change’, if not with ‘dangerous climate change’. In the minds of people ‘cold’ should be more stable. But, paleo data show that it is ‘cold’ that is unstable. While ‘warm’ always shows a high stability in climatic conditions.
Warm is stable, Cold is ‘change’
As is clearly visible in figure 1, temperatures were much more stable during the Pliocene, 5 to 3 million years ago: to the left in figure 1. The temperatures were a little bit warmer than they are now (the dashed line = present temperature). During the warm Pliocene, temperatures showed little variability when compared to the Quaternary period, the geologic period we now live in.
Figure 1: Temperature development in the last five million years according to the Antarctic Vostok Ice Core. ‘Warm’ shows small variances in temperature. ‘Cold’ means high variability.

The difference in temperature variance is better shown, when we look at the two parts on both ends of the past 5 million years in figure 2.
Figure 2: Variance in temperature during warm and cold periods – the same graphic as above. The length of the arrows shows the difference in variance between ‘warm’ and ‘cold’ phases. Variance during cycles grows during the period from less than two degrees to more than 8 degrees. On the right of the figure we find ‘climate change’ in perfect form, in the coldest part of the Quaternary.

Greenland ice cores show, in more detail, over a shorter period, the same pattern of instability / stability. Until 15,000 years ago in the full depth of the most recent glacial advance, variance even within a 1000-year period was huge. In the last 10,000 years, our warm Holocene temperatures (upper right) only showed small fluctuations – if compared to the glacial period as shown left below. Figure 3.
Figure 3: Variance in temperatures during the last 21.000 years according to NGRIP Greenland ice core

Surface temperatures
Surface temperatures show the same pattern: as it becomes colder (red line in figure 4), variance grows. Until 5 million years ago, the variance between smaller periods was up to two degrees. At the end of the Quaternary, variance grew to 6 degrees or more. Warm was stable and ‘cold’ meant ‘intense climate change’.
Figure 4: Variance in surface temperatures from the Pliocene into the Pleistocene.

Causes of the growing climate instability at lowering temperatures
The unstable Quaternary is characterised by glacial periods in which large surfaces are covered by ice and snow, large areas that are reflecting the sun and in doing so, strongly are cooling the Earth as a whole. ‘Snow coverage’ has a seasonal character and variations in the snow cover enhance the yearly, decadal and multidecadal temperature changes. Those temperature changes have huge consequences for other aspects of the climate system like winds, evaporation, the strength and the position of pressure areas. As figure 3 shows, the ‘glacial climate state’ is a very unstable climate state.
The switch into the interglacial showed huge temperature rises – in part, due to the effect of diminishing snow and ice – and only during the warmer periods less variance appears as shown in figure 3. Ice and snow lost their destabilizing role as soon as temperatures reached a certain level: the level we know from the warmer period just before the Quaternary.
Unfortunately, interglacials (like the period we are living in) are short lived. The stability of our Holocene could end as soon as new cooling enhances the growth of surfaces with ice and snow.
Conclusions
Contrary to mainstream thinking, warm is not unstable but very stable. Very unstable are colder periods as shown in our Quaternary.
Within the glacials a huge variance is demonstrated, reflecting a very unstable climate state. Large ‘climate changes’ are shown many times even within every 1000-year period of the cold glacial.
The only possible conclusions are, that ‘Warm is stable’ and that ‘Cold means Climate Change’.
With regards to commenting: please adhere to the rules known for this site: quote and react, not personal.
In commenting: please remind you are on an international website: for foreigners it is difficult to understand abbreviations. Foreigners only understand words and (within the context) easy to guess abbreviations like ‘60N’ or ’SH’.
About the author: Wim Röst studied human geography in Utrecht, the Netherlands. The above is his personal view. He is not connected to firms or foundations nor is he funded by government(s).
Andy May was so kind to read the original text and improve the English where necessary. Thanks Andy!
While this is an attractive proposition that has been visible for some time, and thank you for the neat sdummary, there still has to be some uncertainty arising from the proxy data, GI ven icecore resolution changes with age, etc.
Once again, the story might look different if proper uncertainty estimates were provided at some stage. Comments?
Geoff
Proxies tend to hide rapid changes. That means instability will be understated. The degree of understatement differs depending on the proxy.
Exactly, this is my problem with proxy data. My favorite was the study which extracted several thousands of years of data/trends from a sample which was three millimeters thick. There is no granularity or resolution.
Geoff
The change in sensitivity of proxies with time past would be a problem if the proxies showed higher amplitude variation in the recent past, and less variation with earlier times. This could possibly be an artefact of declining sensitivity of proxies with age of proxies.
But what the ice cores show is the opposite. In the recent warm Holocene variation is less, while further back in time during the last glacial period, variation increases,not decreases. It is real and not artificial.
While all this is very interesting, it is not applicable in a situation where the main climate driver is human CO2, which is increasing global temperatures at a rate faster than previous changes in climate.
This is a new situation, with new rules.
(there is nothing about past climate change which means this new situation cannot now produce a new and different direction for climate)
CO2 is not a driver of climate in any sense at all (except through FAKE agenda driven adjustments)
Normal climate situation, just rather COOLER than most of the rest of the Holocene, is all.
(and FAR more Arctic sea ice, mores the pity)
There is NOTHING about present climate that is in any way out of the NORMAL, except how BENIGN it currently is.
No new rules, except from a far-left FAKE scare agenda.
And your PROOF ” the main climate driver is human CO2, which is increasing global temperatures at a rate faster than previous changes in climate” is what? And “nothing about past climate change which means this new situation cannot now produce a new and different direction for climate”. Does this mean computer generated models reconstructing past climate are useless? Then then the IPCC’S reports are also useless. Gutting the heart and core of you premise about CO2.
This is an excellent point. If the climate is operating under new rules, then what are they? Exactly what assumptions baked into the climate models need to be modified, and better yet, modified how?
“This is a new situation, with new rules.”
A baseless claim, once again Griff. When did the “basic rules of physics” change? If the basic rules of physics don’t apply any more then all the climate models which predict increased warming must be wrong because they ( inaccurately ) claim to be based on basic rules of physics.
The “new rules” are: throw science under a bus, prevent contradictory evidence from getting published, and generally make shit up as it suits you.
New rules indeed.
Why do we always re-glaciate when CO2 is highest?
Steve
Stop asking difficult questions.
Because “reglaciate” involves a change from warm interglacial to cold glacial state. CO2 is is highest when temperatures are high ( basically oceanic outgassing ).
It therefore stands to reason that we can expect that reglaciation occurs at a time when CO2 is high.
Not a difficult question.
because a flying saucer passes the earth and sucks all the CO2 out of our atmosphere in such a nick of time that our proxy records don’t detect it?
(do i need sarc tags?)
it’s the question i also ask to warmists parroting their belief. Nobody did answer that one yet 🙂
Only 75 years of noticeable increase in atmospheric CO2 is a bit too short a period of declaring that this “is increasing global temperatures at a rate faster than previous changes in climate”, don’t you think?
It’s also completely untrue since the early 20th c. rise was just as rapid and that was too early to be seriously affected by CO2 according to IPCC.
So how did it get so warm before 2.58 million years ago, Griff? How can you tell that warming from this warming? If the natural world got along just fine back then, why wouldn’t it get along just fine today with much less warming? Is man made CO2 different stuff than natural CO2? Why did CO2 get so high in the past?
Griff,
as usual you make no credible case to support your assertions. You need to get off the stupid CO2 is a powerful driver of climate,when there is NO EVIDENCE of it!
You have been told MANY TIMES now, that the warming rate since 1979 is well below the minimum per decade rate as per the IPCC reports. Since you know this,you are deliberately lying for the singular purpose of advancing the warmist propaganda. You are a liar,Griff!
Here it is again for others to judge my harsh words I made against you:
1990 IPCC report,
“Based on current model results, we predict:
• under the IPCC Business-as-Usual (Scenario A) emissions of greenhouse gases, a rate of increase of global mean temperature during the next century of about 0 3°C per decade (with an uncertainty range of 0 2°C to 0 5°C per decade), this is greater than that seen over the past 10,000 years This will result in a likely increase in global mean temperature of about 1°C above the present value by 2025….”
http://www.ipcc.ch/ipccreports/far/wg_I/ipcc_far_wg_I_spm.pdf
2007 IPCC report,
“For the next two decades, a warming of about 0.2°C per decade is projected for a range of SRES emission scenarios. Even if the concentrations of all greenhouse gases and aerosols had been kept constant at year 2000 levels, a further warming of about 0.1°C per decade would be expected.”
https://www.ipcc.ch/publications_and_data/ar4/wg1/en/spmsspm-projections-of.html
RSS from 1990,
http://www.woodfortrees.org/plot/rss/from:1990/mean:12/plot/rss/from:1990/trend
RSS from 2001,
http://www.woodfortrees.org/plot/rss/from:2001/mean:12/plot/rss/from:2001/trend
Even using the manipulated RSS data,it is not even close to the minimum set by the IPCC reports. There is no acceleration of warming at all. The 1990 report stated that it would warm 1C in 35 years,it is not even close!
Stop making a complete fool of yourself,Griff.
Griff
“This is a new situation with new rules”
There are no new rules
Just models. Models are not rules.
You need a few facts with your claim
CO2 is simply another proxy of temperature.
Inverting cause and effect is a time-honoured technique of political propaganda.
Mr. Grifter
I’m sure this comment will upset the moderator,
who will then spit up his whiskey
and perhaps fall off his bar stool,
but I just had to tell you Mr. Grifter,
that I read all your comments,
for the same reason that people
‘rubberneck’ at traffic accidents,
think about them,
and today I came to the conclusion,
that you are qualified to take over,
from Al “The Blimp” Gore,
[Behave~ctm]
Have a Nice Day;
Richard Greene
To clarify my prior post, which has been “edited”:
While many people consider Al “The Blimp” Gore to be the “pope” of climate change, I feel that I should mention that I consider him to be the “Bozo the Clown” of climate change.
heh heh
oh yes griff Tisdale made a nice graph using the tampered and latest adjusted data
so each point represents a warming trend of 30 years in this graph. Where’s the acceleration? (and you see nicely how the models fail)
Those who REALLY wish to live in the spiteful cold of the LIA should move to Siberia, where death from cold is not an irregular experience.
Its odd though, isn’t it…………
EVERY one of the AGW mantra cultists CHOOSES to live somewhere WARMER, and with access to plentiful, reliable CO2 supplied energy.
No why would that be ?
typo…… no = now….
Being banished to Siberia has always been a threat as a punishment, not so sure how being banished to Florida would be such a threat.
I’m willing to bet nearly every one of the resident AGW trolls lives with a generous carbon foot print or in an inner city ghetto with fossil fuel heating in winter.
TRUTH , trolls. ???.
Notice how quiet they are…… Zero TRUTH. !!
Not in their nature.
Being banished to Australia was also once a threat. Not so much now 🙂
Tom in Florider:
I live in Michigan.
Here we practice driving
to prepare ourselves
before we drive to Florida for the winter.
We drive here in the Michigan summer,
at ten miles per hour under the speed limit,
with our left turn signals on the whole time.
We stop frequently, roll down our windows,
and bellow: Yoooooo Whoooooo, Yoooooo Whooooooo
at a pedestrian, to get him to come over to the car,
and then we ask him where we can find
a restaurant with a 5pm early boid special.
This left turn signal on at all times driving practice
has actually become a status symbol here in Michigan.
It’s tells all your friends and neighbors,
that you’re going to Florider again next winter.
I’m not making any of this up.
In the atmosphere and the oceans, heat transfer is due to temperature difference. The alarmists tell us that global warming will have the least effect on temperature at the equator and a greater effect as one moves away from the equator. In other words, global warming will reduce temperature differences. That will reduce heat flow and thereby increase stability.
When I previously made the above observation, ristvan pointed out that Richard Lindzen had said the same thing. I haven’t found where he put it as succinctly but that means I’m probably over-simplifying.
CommieBob: “In other words, global warming will reduce temperature differences. That will reduce heat flow and thereby increase stability.”
WR: Generally speaking: Agree. But on a regional scale we could find different effects.
For example, a (part of the year) ice free Arctic will create different weather patterns. A warmer surface (water, no ice) that evaporates H2O will attract / create low pressure areas. That low pressure areas will send more precipitation to Siberia and to the North American continent. More snow will have a cooling effect. Regionally the temperature gradient could / will rise, enhancing wind. And wind could enhance cold upwelling in upwelling sensitive cold regions, for example north and west of Newfoundland and at the Sea of Ochotsk, east of Siberia. This could cool the surfaces of the northern Atlantic and the northern Pacific, finally reversing the warming process.
I liked your post, as you used available data to show that the alarmist meme that global warming means ‘dangerous climate change’ does not seem to be supported. However, you put up a quite complex relationship with many variables in that reply. I think you will have a tough job proving your suggestions. All the best. SorF.
While providing exact forecasts would be difficult, everything in Wim’s post is derived from first principles.
1) Open water in the arctic means more heat being lost from the arctic oceans. (More evaporation as well)
2) Rising air tends to create low pressure zones. Plus air that rises has to fall somewhere. Both of these mean that wind patterns will change.
3) More humid air from the arctic ocean means there will be more snowfall in the land areas around that ocean. See “lake effect snows”.
4) and so on
Science or Fiction: “However, you put up a quite complex relationship with many variables in that reply. I think you will have a tough job proving your suggestions.”
WR: Thank you Mark for you reply above. I can add some more information.
WR: Last year I thought to see something like the pattern described above already happening. In Autumn, east of the Sea of Ochotsck there was a high upwelling of cold ocean water, cooling the surface of the North Pacific. High pressure in Siberia and deep lows in the Arctic area played an important role in creating the cold oceanic upwelling. Wind patterns were favourable for upwelling. If this pattern of (relatively) high pressure in Siberia and (relatively) low pressure in the Arctic should continue to happen in the coming years, cooling could be more near as we think.
But, ‘weather’ we can only be forecasted for some days, not for years. So for me the above is just a possibility. A logical one for me, but future must show what really will happen.
Tipo: right sentence: ‘weather’ can only be forecasted for some days
What makes you think Arctic “will” be ice free? The Death Spiral is Dead
https://climategrog.wordpress.com/2016/09/17/the-death-spiral-is-dead/
2016 OMG sea ice coverage was indistinguishable from 2007 OMG sea ice
That is ZERO change in a decade. I would suggest that the negative feedback of more open water has already had its effect. N. Atlantic SST has a roughly 60y periodicity , after 25y of ice loss and and 10y of no ice loss, it is far from a foregone conclusion that melting will continue.
If Arctic sea ice is supposed to be the canary in the coal mine, it’s time to put coalminers back to work !
Thank you Wim Röst – an excellent summary of important facts.
It makes me cold just thinking about Earth’s future. Global warming alarmism is imbecilic nonsense – increasing atmospheric CO2 has very little impact on climate.
Climate science should focus on the real problem and how to solve it, and that is the next Ice Age, which is due anytime in geologic terms.
It is truly ironic that our imbecilic politicians are focusing on imaginary global warming when the real threat is from global cooling. I have not researched when major cooling will commence, but it is due anytime based on the past several cycles.
Just remember, the fear of AGW is being used to create a demand for a world government. Every elected shill is vying to be a part of that government since it will offer them more personal power. The objective of that world government is to get control of human population, and cold kills far more than a couple of degrees of heat will. This isn’t climate concerns that drives the current agenda, it is universal control over the peoples of the world and to limit the number of “users of resources that add nothing to the comfort of the rich.” Worst of all, the trolls don’t even realize that they, too, will be found expendable.
100% CORRECT. All this AGW nonsense is authoritarian Socialism dressed up to get support of radical enviroNazis. Neither movement can stand on it’s own so they prop each other up to commit war on the basis of modern society. Ask them if they want to do without modern medicine or freedom of movement-not a chance!
The true believers know that global warming will reach a tipping point and we will no longer have ice ages, only increased temperatures until we are like Venus!
pressure x volume = rxT(kelvin Temp) That explains Venus temperature not co2.
Greenland temperatures.
This graphic is showing a most interesting thing. Summer air (!) temperatures are not the cause of the low sea ice extent. Having had a look on what happens below the surface of the Arctic Ocean, it became clear that warm water pulses from the Atlantic are melting the Arctic ice from below. And that is what is happening now. Not the gases above, but the water (ocean) below is the direct cause of the melt. This subject deserves a separate post: perhaps somewhere in the near future.
“are not the cause of the low sea ice extent. ”
Arctic summer sea ice levels are NOT low.
They are higher than they have been for some 90-95% of the last 10,000 years.
The real issue is that levels through the LIA and the late 1970’s were ANOMALOUSLY HIGH !!
That is what the BIG ARCTIC BED-WETTING is all about.
A drop from the HIGHEST levels in the current interglacial. !!
PERSPECTIVE !!!
I think it is actually the winter air temperatures that are interesting. The dramatic spikes are indicative of open water marine weather. The failure of ice to form and grow is likely caused by wind and storms being more pronounced. When there is more ice there is much less wave action and ice destruction. Low winter ice levels are therefore more of a stable mechanical phenomenon. They will persist until winds decrease for a period of winter weather sufficient to allow large areas of water to ice over heavily enough that wind does not translate its energy to the water. The far North is a very windy place! That is a critical piece of the puzzle.
“The dramatic spikes are indicative of open water marine weather”
No, they are caused by low pressure systems that occasionally penetrate to high latitudes and cause brief local warming (the DMI dataset is very skewed, changes over small areas near the Pole have disproportionally great effect). Take a look att Fig. 7 in the paper below and you will see that the same type of “dramatic spikes” occurred 200 years ago:
https://www.researchgate.net/publication/45146461_Arctic_marine_climate_of_the_early_nineteenth_century
Actually, I think that’s the north of 80° temperature. It is remarkable this year. Most years the temperature during the melt season cleaves very closely to the average. You almost never see it tracking around a degree lower.
Of course this requires rational thought something that religious fanatics in the church of AGW will never accept…
If the amount of CO2 changes the weather…then it acts like any other buffer….less is more unstable….more is more stable
It’s a catch 22 for warmests
Yes, that a lower average global temperature is associated with a higher variability is very well known, and Greenland ice cores have registered the huge swings produced in the North Atlantic area by Dansgaard-Oeschger oscillations. I represented this concept with the following cartoon in my review of Holocene climate:

https://judithcurry.com/2017/04/30/nature-unbound-iii-holocene-climate-variability-part-a/
https://judithcurry.com/2017/05/28/nature-unbound-iii-holocene-climate-variability-part-b/
or in a single pdf document:
https://sabercathost.com/4Xly/Nature_unbound_3.pdf
But the real reason for the increase in variability with the decrease in average temperature is that as tropical temperatures vary a lot less, the meridional temperature gradient becomes steeper with the decrease in temperatures, and that gradient is the engine and energy that drives a lot of weather associated phenomena.
Please notice that we are close to number 6 curve for the Northern Hemisphere, and to number 7 for the Southern Hemisphere even now during the interglacial, with an average global temperature of 14.5-15°C
The steepness of those curves is what drives a big part of extreme weather phenomena. During the LIA weather changes and phenomena were brutal, with a lot more variability than now. However CO2 was lower.
And CO2 levels represent previous climate. As waters warm or cool, CO2 is driven out of solution or taken up by the ocean. The time lag is a function of the mass of the Earth’s oceans and the time it takes to transmit any appreciable amount of heat to depth. CO2 and climate are related but not at all causative. Other feedbacks are in charge!
Thanks Javier – a useful perspective.
Is space cold or hot? There are no molecules in space so our common definitions of hot/cold/heat/energy don’t apply.
The temperatures of objects in space, e.g. the earth, moon, space station, mars, Venus, etc. are determined by the radiation flowing past them. In the case of the earth, the solar irradiance of 1,368 W/m^2 has a Stefan Boltzmann black body equivalent temperature of 394 K. That’s hot. Sort of.
But an object’s albedo reflects away some of that energy and reduces that temperature.
The earth’s albedo reflects away 30% of the sun’s 1,368 W/m^2 energy leaving 70% or 958 W/m^2 to “warm” the earth and at an S-B BB equivalent temperature of 361 K, 33 C colder than the earth with no atmosphere or albedo.
The earth’s albedo/atmosphere doesn’t keep the earth warm, it keeps the earth cool.
****************
https://science.nasa.gov/science-news/science-at-nasa/2001/ast21mar_1/
“The first design consideration for thermal control is insulation — to keep
heat in for warmth and to keep it out for cooling.”
“Here on Earth, environmental heat is transferred in the air primarily by
conduction (collisions between individual air molecules) and convection
(the circulation or bulk motion of air).”
Oops! WHAT?! Did they forget to mention RGHE “theory?” Global warming? Climate change? Bad scientists!
Oh, wait. These must be engineers who actually USE science.
“This is why you can insulate your house basically using the air trapped
inside your insulation,” said Andrew Hong, an engineer (SEE!!!) and thermal
control specialist at NASA’s Johnson Space Center. “Air is a poor
conductor of heat, and the fibers of home insulation that hold the air still
minimize convection.”
“”In space there is no air for conduction or convection,” he added. Space
is a radiation-dominated environment. Objects heat up by absorbing
sunlight and they cool off by emitting infrared energy, a form of
radiation which is invisible to the human eye.”
Uhh, that’s in SPACE NOT on EARTH where radiation rules.
“Without thermal controls, the temperature of the orbiting Space
Station’s Sun-facing side would soar to 250 degrees F (121 C), while
thermometers on the dark side would plunge to minus 250 degrees F
(-157 C). There might be a comfortable spot somewhere in the middle of
the Station, but searching for it wouldn’t be much fun!”
121 C plus 273 C = 394 K Ta-dahhh!!!!!
Shiny insulation keeps the ISS COOL!!!! Just like the earth’s albedo/atmosphere keeps the earth COOL!!! NOT hot like RGHE’s BOGUS “Theory.”
A related point is that GHG’s do not increase the temperature of Earth from 255K to 288K. Without GHG’s, the Earth’s albedo would be the same as the Moon and the average temperature would be about 270K. What’s inconveniently ignored by the alarmists is that GHG’s, specifically water, also cool the planet by about 15C, so the net warming from GHG’s is only 18C and not 33C.
Nicholas:
Why do you keep spamming threads with your same unrelated nonsense? I’ve pointed out to you before just a few of the gross, basic errors you make. It’s tedious!
You are soon going to go the way of Mr. Natural Fiber, who has long been banned from all the blogs for his repetitive and erroneous posts.
So be specific, just what gross basic errors are you referring to?
Ad Hominems are ineffective.
getitright:
Fair question. I have responded to Nicholas elsewhere in detail (and he never answers, just cuts-and-pastes the exact same drivel everywhere).
Point 1: For the purposes of radiative heat transfer — and that is the only mode of heat transfer that the earth system has with the rest of the universe — space IS really cold, about 3K. Astronomers have done very careful measurements, and in all directions (except the 1/2-degree by 1/2-degree occupied by the sun) space radiates to us exactly as a blackbody at 2.725K (+/-0.001K) would. While you can argue whether this is a “real” temperature or just an “effective” temperature, for the purposes of any heat transfer calculations, it simply does not matter. This radiation is only 3 microwatts per square meter.
But on the earth’s surface, we are receiving much more downwelling radiation than this. In my engineering heat transfer courses, we were taught to consider a clear night sky in temperate zones as acting like a blackbody at -20C (253K), providing over 230 watts per square meter. (This is backed up by real measurements.) This is a huge difference, and only occurs because of the radiatively active (“greenhouse”) gases in the atmosphere.
Point 2: While reflecting 30% of the energy in sunlight (the earth’s Bond albedo), and not letting that energy pass through to be absorbed at or under the surface, results in the earth being cooler than it would be if there were no reflection, this has nothing to do with the “radiative greenhouse effect”. The moon also reflects some sunlight, and is cooler than it would be if it didn’t, but no one is saying there is a greenhouse effect on the moon.
What he does not realize is the obvious corollary to this fact. The earth’s atmosphere, by not letting a substantial percentage of the surface’s thermal radiation pass through to space, instead effectively turning around some of it back to the surface (in this case by absorption and re-emission, not direct reflection), the earth’s surface is WARMER than it would be if the atmosphere were fully transparent to this radiation. This IS the radiative greenhouse effect.
Point 3: He talks about conductive insulation inhibiting heat transfer, and elsewhere goes into more detail about this, but does not realize that this is only effective if there is something on “the other end” to conduct to. The density of space is so low that there is nothing to conduct to.
He says: “that’s in SPACE NOT on EARTH where radiation rules.” He does not understand that he is undercutting his own argument here, because it is the fact that EARTH is IN SPACE and that we are concerned with the earth’s interaction with space that means that “radiation rules”!
Point 4: He makes the point that a black surface that is perpetually facing directly at the sun (at the earth’s distance) — as the black surfaces on the space station would be — could reach a temperature of 394K. He ignores the fact that no point on earth is perpetually facing the sun, as we have this phenomenon know as the earth’s rotation with day and night, with each point on the earth receiving ZERO solar power for half the time. Most of the earth’s surface NEVER receives the full dose of solar power — that only occurs at noon at the latitude where the sun is straight up.
So on every substantive point, he is totally confused.
What is worse is that he keeps spamming unrelated threads with this drivel.
Ed
Whilst your further detailed comment gives food for thought, you fail to address the primary point that Nicholas raises.
As I understand matters, his point is that heat can be transferred by conduction, convection and by radiation, but where either conduction and/or convection operates it is this process that is dominant, and radiation plays little or no part.
Where there is no convection or conduction then radiation is the dominant mechanism to transfer/dissipate heat/energy such as at TOA.
The point that Nicholas makes is well illustrated by the BBQ. This relies on hot coals and these produce radiant energy. However, when you cook a steak, it is cooked by convection and conduction (to the extent that the steak is seared as it lies on the hot griddle).
If radiation could be used for cooking, one could cook a steak say 9 inches below the BBQ as easily as 9 inches above the BBQ. but as you know, you cannot cook a steak underneath a BBQ even though it is producing plenty of downwards radiation.
The same is so with a domestic hot water heating system employing water filled radiators. They are called radiators since they radiate. however, the room is heated by convection, not radiation. If you place your hand say 3 inches from the side panel,of the radiator you probably will not detect any heat, however, if you place your hand 3 feet above the radiator you will feel the heat. Once again, convection dominates.
And this is the point that NASA make in the cited excerpts
NASA do not mention radiation as a primary mechanism because there is no significant energy flow in the below TOA caused by radiation.
PS. Let’s not get into a semantic debate as to whether radiation is a transfer of heat or a transfer of energy.
WR: First: Richard and Ed: a good and interesting discussion.
And next: about major warming and stabilizing factors in respect to ‘climate’ the following.
Richard Verney: “NASA do not mention radiation as a primary mechanism because there is no significant energy flow in the below TOA caused by radiation.”
WR: What re-radiation does do in the atmosphere, is balancing surface temperatures. Without that nearly endless absorbing and emitting within the atmosphere, all radiation would have been gone directly outward to space. And in doing so, the outward going radiation would directly be cooling the surface. As Ed says: “the earth’s surface is WARMER than it would be if the atmosphere were fully transparent to this radiation”
So, in fact the effect of the whole absorption/emitting process within the atmosphere is a kind of storage (!) of energy.
And here we are back on ‘stability’ of the Earth’s climates. When the surface of the Earth is warm(er), climates are much more stable. And thanks to re-radiation, the surface of the Earth is warmer and more stable in temperature.
And here comes my point. Not only this atmospheric re-radiation process is warming and stabilizing the Earth’s climates – but unfortunately, it is nearly only this process that gets all attention.
Because, the main storage of energy is in the oceans. That storage is warming/cooling and stabilizing the temperatures at the surface of the Earth in a major way. In my next post(s) more about this.
Richard:
Thanks for your comments. However, I maintain my criticisms of Nicholas’ post.
While conduction and convection often predominate in our everyday experiences, radiation is typically underappreciated.
You say: “If radiation could be used for cooking, one could cook a steak say 9 inches below the BBQ as easily as 9 inches above the BBQ..”
Haven’t you ever used a broiler? The whole point of the broiler, with its heating element (gas or electric) over the food, is to maximize the radiative heat transfer while minimizing the conductive/convective heat transfer. It’s why you leave the broiler door open when broiling steaks — you don’t want the air too hot. It’s also why you grill steaks on the BBQ with the cover off, so the air around the steak is not too hot.
The section of the NASA post you quote — “Here on Earth, environmental heat is transferred in the air primarily by conduction (collisions between individual air molecules) and convection (the circulation or bulk motion of air).” — is directly contradicted by a later paragraph in the same post –“Air is a poor conductor of heat”. (Many NASA releases are written by PR flacks who don’t have a full grasp of the underlying science.)
Air is truly a poor conductor of heat (which is why double-paned windows work), and if the conditions are not right for convection, then radiation dominates, even at surface level.
Take the common phenomenon of temperature inversions at night. These occur because the surface radiates well through the lower atmosphere (particularly well when the humidity is low), causing it to be colder than the air at the surface. Because air is a poor conductor of heat, an inverted temperature gradient can be maintained for hours (or for months in the Antarctic winter) due to the low downward conductive transfer. You can get frost on the ground when the surface air temperature is several degrees above freezing.
But the bigger point is that the NASA post as a whole completely contradicts the point Nicholas is trying to make. Like the space station, the earth as a whole has only radiative exchange with the rest of the universe. So altering these transfers requires altering radiative pathways, not conductive/convective transfers.
The space station uses multiple layers of reflecting radiative insulation to increase the radiative resistance between the craft and the effective radiative temperature of space of ~3K. The earth has layers of absorbing/re-emitting gases that increase the radiative resistance between the surface and the ~3K of space.
With a basically constant power source from the very hot sun, increasing the thermal resistance to very cold (for the purposes of radiative transfer) sink of space results in significantly higher earth temperatures. The gases that provide this thermal resistance do NOT cool the earth (i.e. result in lower temperatures) as Nicholas claims.
Good post and discussion. Getting the situation 180 degrees off is typical for the AGW true believers. The Little Ice Age was not exactly a pleasant period of history, nor was the post-Roman Dark Age cool period.
I can see that civilization makes big leaps in development, science arts, etc. in warm stable periods. When your industry and effort is concentrated on meagre survival in highly variable climate of cold periods, there isn’t much attention paid to the arts, economy is frustrated and thought is focused on the next meal.
How much of the reduced variability is due to the proxies representing longer and longer term averages as we go back in time? When we identify a proxy for the temperature 10M years ago, we’re extracting multi thousand year averages. For example. in the DomeC ice core, the last 50K years or so are 20-50 year averages, while 500K years ago, the intrinsic averaging of the samples is centuries and at 1M, its closer to 1000 year averages. Clearly, the variance in 10 year averages will be higher then the variance in 1000 year averages.
Figure 1, (2) and 4 don’t show minor periods, only the big fluctuations because of the time scale: 5 million years. Figure 3 is more detailed, but shows the same pattern: cold is change, warm is stable.
William,
Here’s the variance of a 10K year sine wave as the length of the averages increases. As you can see, as the averaging length increases, the variance decreases.
#avg 1
variance = 2
#avg 10
variance = 1.99999
#avg 100
variance = 1.9987
#avg 1000
variance = 1.96726
#avg 2000
variance = 1.77941
#avg 3000
variance = 1.55269
#avg 5000
variance = 0.636619
Here’s the C code that generated this:
#include
#include
// compile as “gcc avg.c -l -o avg” or whatever is similar for your compiler
// run as “avg “, where length is the number of years in the average
int main(int argc, char **argv) {
int avgLen = 1, i;
double min = 1, max = -1, sum = 0;
if (argc > 1)
sscanf(argv[1], “%d”, &avgLen);
for (i = 0; i < 10000; i++) {
if (!(i % avgLen)) {
sum /= avgLen;
if (sum max) max = sum;
sum = 0;
}
sum += sin(i * (2*3.141596)/10000);
}
printf(“variance = %g\n”, max – min);
}
co2isnotevil August 1, 2017 at 8:42 am
WR: if the variance in the Pliocene would have been comparable to that of the Quaternary, it would have left its traces, somewhere. In case of serious cooling for example as glacial scratches. So far I don’t know about the existence of ‘high variance markers’ in the Pliocene.
Looking only to ‘variance on a time scale’, we should expect more variance in the Holocene than we see in the Pleistocene. But more variance is not visible, at least not in figure 3. On the contrary. The Holocene shows far less variance. Warm appears to be stable.
Wim;
I believe the question co2isnotevil is asking is, what is the relative resolution of the proxy at , say 0.5 million years vs. 5.0 million years? Is the resolving power of the proxy constant or does it vary?
D. J. Hawkins: “what is the relative resolution of the proxy at , say 0.5 million years vs. 5.0 million years? Is the resolving power of the proxy constant or does it vary?”
WR: To be honest: I am not a proxy specialist and I can not answer this question in detail. I am expecting a lower resolution as the moment we are studying is farther from Present. But I don’t know how much lower.
What I have seen is that most times multiple proxies are used to draw conclusions. If the total resolution would be that low that for shorter periods no variation would be visible in the graph, the lines in the graph are drawn in a different way. For example, as you can see for the period before 7 million year BP in figure 5a of this paper: http://onlinelibrary.wiley.com/doi/10.1029/2005GC001085/full
In the in this post used figures only one way of drawing lines is used. Suggesting that there is enough evidence not to change the way of drawing lines.
“In the in this post used figures only one way of drawing lines is used. Suggesting that there is enough evidence not to change the way of drawing lines.”
Sorry Win , you must have been asleep for the last couple of decades. Though it may be a good idea, no one does what you are suggesting and pretending that this is standard practice so closely adhered to that you can draw that conclusion is a fairy tale.
Finding lower variability in the past could be due to seepage / diffusion effects or reduced temporal resolution. This could be an alternative account for what is seen in figure 1.
What is more convincing is figure 3 where the opposite temporal variation occurs.
On a much smaller scale we could look at surface temperature in 18th and 19th c. which was far larger than the warmer 20th c. record.
Exactly right, Wim. We constantly hear muddled thinking that increased energy in the system leads to instability. Actually, GRADIENTS lead to instability.
The increasing amplitude of the oscillations from the Pliocene to the Pleistocene you have shown in ice core data are mirrored in ocean core data.
Way too much effort is spent divining the period of the oscillations. The weak influence of the 41kyr cycle is evident as far back as the data goes. The low amplitude during warmer times should be our gauge of its influence. The important information (and the mystery) is the increasing amplitude, and the nearly complete override of the 41kyr signal as the amplitude has increased.
We all realize that the tropics experienced very modest cooling during Pleistocene glacial periods compared with the poles. Conversely, during interglacials, the poles warm much more than the tropics. The recent warming is no exception.
These gradients are easy to understand. The gradient increases as the energy in the system is reduced. The system becomes less stable, and the gyrations that resolve the gradient become more extreme.
Engineers will say increasing amplitude results from delay in resolving the gradient. At geological scale, we must come to understand both the reduction in overall energy AND the mechanism for delay, if we are to comprehend why the planet goes frosty every few hundred million years.
Gymnosperm: “At geological scale, we must come to understand (…) the reduction in overall energy”
WR: Two of my following posts (not the next one) are about “the reduction in overall energy” the planet shows as it is going into frosty periods. I think there is a simple and clear explanation.
“Way too much effort is spent divining the period of the oscillations.”
Definitely not. The reason why the well understood 41 kyr cycle changed to a 100 kyr (? 82/123 kyr) cycle is the major unsolved problem in Pleistocene climatology.
Pretty clear to me the 41kyr was overridden at the MPT. It didn’t go away. It is weak.
tty: “The reason why the well understood 41 kyr cycle changed to a 100 kyr (? 82/123 kyr) cycle is the major unsolved problem in Pleistocene climatology”
WR: see my next post
Cold is the great enemy of life since it began. Man has survived the cold by moving into cave shelters and shivering around the campfire. This is what the warmist want mankind to return to (everyone but the elite). These fools need to experience real suffering, from the elements, to achieve the epiphany of survival and reality. GK
Warm is good, Cold is bad would be a better title
meanwhile.
http://dailycaller.com/2017/07/31/australia-weather-bureau-caught-tampering-with-climate-numbers/
>>Contrary to mainstream thinking, warm is not unstable
>>but very stable. Very unstable are colder periods as shown
>>in our Quaternary.
That is not true of the modern era (the last million years).
Quite clearly the world has entered an era where cold conditions are the climate’s preferred state, and temperatures will always cool unless many conditions conspire to cause warming. ** But that interglacial warming is a short aberation only lasting about 5 kyrs, and the world inevitably and steadily cools again.
So yes, we have now entered an era where ice age conditions are the preferred mode, and so we can assume that another ice age will eventually be initiated. ***
** Those conditions include a lowering of ice sheet albedo by dust.
*** Although we have just entered a stable period with low orbital eccentricity, so the right conditions for ice age propogation may not occurr for another 100 kyr.
R
Yes, but climate during interglacials is remarkably stable while climate during glaciations oscillates violently on a millenial and submillenial timescale.
The post was not about “preferred state” but about variability.
Ralf
That is indeed a paradox.
The cold state is less stable, yet preferred.
Javier’s post upthread explains why a cold world is inherently less stable with larger equator-pole temperature gradient.
The changing amplitude by age is not what you think. It is normal for proxis of high age. The physics behind is simple.The temperatures are found by measuring the ratio of 2 oxygen isotopes. But even in ice some mixing takes place during very large time spans. This means that the older the ice cores are, the less temperature differences will look
Here is another example of warm is stable and cold is unstable:-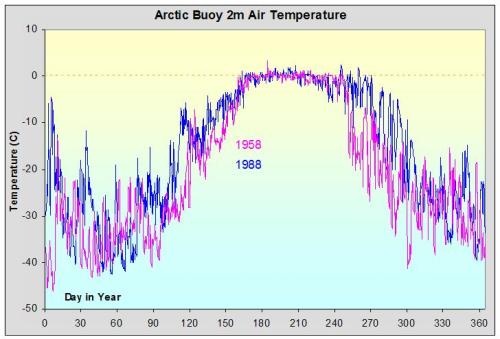
The Arctic Buoy 2 metre air temperature chart showing summer stability and winter instability.
Curious that the pattern of the annual plot of arctic temperature from winter to summer shows similarities with the pattern of the changes between iceage and interglacial conditions.
The proxies are of warmer sea surfaces but there were big climatic changes on land at the beginning of the Holocene and the previous interglacial eg Sahara from shifting weather patterns. There is also the question of where does the water come from. You can’t assume the proxies are not affected by weather patterns.
A little more reading and the answer is Heinrich events. Large armada of icebergs breaking off.
Finally a use for all that noise. Turning the finding on its head, noisy proxies may be identified as having been created in Cold periods. The relative dating problem may also be resolvable. It may be acceptable to shift proxies to match the variance of other proxies. Perhaps a Greenlandic core that may have thicknesses missing might be adjustable To match more complete Antarctic core. Perhaps this discovery will lead to reinterpret actions that have higher time certainties. Good stuff Wm Ross.
Hi Wim
Nice post again
Is there a record of ocean temperatures across a glacial to interglacial period.
What is the temperature movement – has it been identified.
Also I thought of your last post last weekend while in the township of Tekapo.in the South Island of New Zealand skiing. The area had experienced a lot of snowfall including the township which had about 150 to 200mm on the ground. Went to bed after looking at the snow glistening with the moon beams, but during the nite a strong wind came up buffeting the house, and in the morning there was no snow.Most of the nearby hills were ravaged as well.
The power of the wind to remove ice and snow is hard to ignore.
Good sking though before the wind.
Regards
Martin
Thanks Wim for another great article.
Your articles refocus the climate debate in the right place – the oceans – which are the true source and gatekeeper of climate. Keep up the good work! Mvg, Phil.
Thanks Phil. It would be strange if 71% of the Earth’s surface would not dominate the climate. There is more to discover. And more to publish! It is an interesting puzzle.