by Dr David Whitehouse, GWPF Science Editor
A new paper has been published in the Analysis section of Nature called Reconciling controversies about the ‘global warming hiatus.’ It confirms that the ‘hiatus’ or ‘pause’ is real. It is also rather revealing.
It attempts to explain the ‘Pause’ by looking into what is known about climate variability. They say that four years after the release of the IPCC AR5 report, which contained much about the ‘hiatus’ it is time to see what can be learned.
One could be a little sarcastic in saying why would Nature devote seven of its desirable pages to an event that some vehemently say never existed and maintain its existence has been disproved long ago. Now, however, as the El Nino spike of the past few years levels off, analysing the ‘pause’ seems to be coming back into fashion.
The authors of this recent paper delicately tread a line between the two opposing camps saying, on the one hand, that both sides have a point and their particular methods of analysis are understandable. But on the other hand they make it clear that there is a real event that needs studying.
As someone who has paid close attention to the ‘pause’ for almost a decade I am perhaps more attentive than most when it comes to a retelling of the history of the idea and the observations.
The authors say the pause started with claims from outside the scientific community. Well, yes and no. It was tentatively suggested in 2006 and 2007 by climate sceptics many of whom were experienced scientists and quite capable of reading a graph and calculating statistics. A decade after it was raised, every time the ‘pause’ is debated it is a tribute to those who first noticed it and faced harsh criticism. It was the sceptics who noticed the ‘pause,’ and in doing so made a valuable contribution to science. For years it was only analysed and discussed on the blogosphere before journals took notice.
There is nothing new in their recent paper or that hasn’t been discussed by the GWPF. Perhaps that will give pause for thought for some who see battle lines drawn between pause supporters (sceptics) and pause busters (scientists).
What the authors miss, with their three definitions of the pause, is a simple fact we have often pointed out. Look at HadCRUT4 from 2001 (after the 1999-2000 El Nino/La Nina event) until 2014 (before the start of the recent El Nino event) and you will see the temperature is flat. Apart from the recent El Nino there has been no global increase since 2001, even though there have been El Ninos and La Ninas in that period. Now that’s what I call a pause.
I will leave it to the reader to calculate the trend, and the error of the trend for the same period using other global surface temperature data sets. The duration of the pause is about half of the nominal 30-year basic climate assessment period, so if it resumes in the next few years it may become the dominant climate event of recent times. The pause ended not because of gradual global warming but because of a natural weather event whose temporary increased rate of global warming was far too large to be anthropogenic. This didn’t stop some from claiming we had entered a period of catastrophic global warming.

Look at their Fig 1 showing trends in global temperature data sets. It shows that since about 2000 the trend in all data sets has been decreasing. This was only halted by the recent El Nino. Note that all the variations on the graph are said to be within the bounds of natural variability according to the authors, indicating that nothing unusual has happened over the duration of the graph.

Consider also their figure 2b and c. It shows HadCRUT3 from 1980 -2008 and points out the recent pause period. It then shows five global temperature data sets from 1980 – 2015 showing that the pause has gone away. Never mind that the reason why the pause has stopped is not a climatic one, but due to the short-term El Nino.

Look also at their Fig 5 which is said to reconcile observations and computer models showing that there is no discrepancy. Again it is the recent El Nino that brings models and data together. Without the introduction of this short-lived weather event the climate models would obviously be running too warm.

All this negates the paper’s aim to explain the pause in terms of what is known about climate variability.
There is also a commentary on the paper published in Nature’s news and views section by Risbey and Lewandowsky which is absurd. They are wrong in their views about HadCRUT4 and flat periods, see above. They point out that the data sets continue to show significant warming trends when the trend length exceeds 16 years. This is an obvious point when looking at the rise in global temperature seen in the years prior to the 1998 El Nino event. They should also look at Fig 1 again and bear in mind what I say about El Ninos.
The pause has been extremely valuable and illuminating for climate science. A decade ago it was held that the anthropogenic signal of global warming was strong. Only when surface temperatures did not increase by the 0.3°C per decade most climate models had predicted that qualifications were made. Natural decadal variability was used to explain the lack of temperature rise and it resulted in a gradual change of view.
Now it was claimed that the anthropogenic signal was being obscured by decadal climatic variability and it would be several decades before it emerged and exceeded it, as Meehl et al said in Nature Climate Change, “Longer-term externally forced trends in global mean surface temperatures are embedded in the background noise of internally generated multidecadal variability.”
Whether the pause will return after the recent El Nino and its aftermath settles down remains to be seen. From its sceptical beginnings the pause has become the major controversy and debating point in climate science. Despite ongoing attempts to either deny it altogether or to find new reasons for its existence, nobody really knows what caused it or whether it will be re-established.
Skeptics aren’t scientists?
That will come as a surprise to the many skeptical scientists most here could name.
Good article, but I’d change that sentence to read “skeptical and consensus scientists”.
“Perhaps that will give pause for thought for some who see battle lines drawn between pause supporters (sceptics) and pause busters (scientists).”
“Perhaps that will give pause for thought for some who see battle lines drawn between pause supporters (skeptical scientists) and pause busters (consensus scientists).”
I for one have never been a pause supporter. I’ve just noted that it exists.
Reply to MarkW. I’m a supporter of the pause.
http://www.thelighterperspective.com/wp-content/uploads/2012/11/pause-that-refreshes.jpg
Yes, Chimp, I think it should read “…pause supporters (sceptics) and pause busters (alarmists).”
Yeah, that works.
Those who support it, recognize that it exists, and that alarmists did not predict it. Indeed it shows just how worthless their GIGO models are.
No, it demonstrates what a flimsy artifact the so-called pause is. Features shorter than 30 years are just weather.

This shows a bit less weather:
I’d be a lot happier if there was a 10-20 year ‘pause’ on that graph.
It shows why the Arctic is likely to be a seasonal ocean very soon.
http://psc.apl.uw.edu/wordpress/wp-content/uploads/schweiger/ice_volume/BPIOMASIceVolumeAnomalyCurrentV2.1_CY.png
That will change the weather.
Tony,
The Arctic is not going to be ice-free any time soon.
It’s summer sea ice extent has stayed about the same on average for the past decade. In climate, trends change regularly.
The smallest unit of climate is indeed conventionally said to be 30 years, although 300, 3000 and 30,000 are a lot more meaningful.
But we’re talking here about the models. If AGW be valid, then you shouldn’t have to wait 30 years for it to show up as forecast by models. The ever increasing GHG in the air should be evident on a much shorter time frame.
Hey McClod.. did you know that current Arctic sea ice extent is above that of 90-95% of the Holocene?
Andy,
Paper from just last year on Holocene sea ice record along Beringia:
http://journals.sagepub.com/doi/abs/10.1177/0959683616645939?journalCode=hola
Two sediment cores from the Chukchi Sea margin were investigated for the Arctic sea-ice biomarker IP25, along with marine and terrestrial sterols and glycerol dialkyl glycerol tetraethers (GDGTs). This is the first paleoclimatic application of IP25 in the Chukchi-Alaskan region of the Arctic, which is key for understanding Arctic–Pacific interactions and is experiencing rapid sea-ice retreat under present warming. Sea-ice and related circulation conditions were characterized in this study with a multicentury resolution for the long-term Holocene record to multidecadal for the last several centuries. Sea ice was found to be present during the entire record but with considerable spatial and temporal variability. After very low deglacial IP25 values, possibly related to permanent sea ice and/or an iceberg-dominated environment, cores from the upper slope and shelf show IP25 maxima, interpreted as representing a relative proximity to the sea-ice margin, in the early (ca. 8–9 ka) and middle (ca. 5–6 ka) Holocene, respectively. Along with isoprenoid GDGT distribution, this asynchronicity in sea-ice history probably reflects oceanographic evolution of the Chukchi margin affected by the Beaufort Gyre circulation and Pacific water inflow via Bering Strait. Data for the last several centuries, with elevated values of brassicasterol and terrestrial sterols covarying with dinosterol and IP25, are interpreted in terms of long-distance import by currents combined with diagenetic transformations. We infer that high-amplitude variability in the late ‘Little Ice Age’, starting in the late 18th century, is related to the intensity of the Alaskan Coastal Current. This interval is preceded by three centuries of presumably diminished Alaskan Coastal Current but overall increased Bering Strait Inflow resulting in reduced sea-ice cover according to dinocyst-based data.
“It shows why the Arctic is likely to be a seasonal ocean very soon …”.
==============================================
Circum-Arctic ocean temperatures at selected depths:
http://www.climate4you.com/images/ArgoCircumArcticSince200401%2055N-65N.gif
So, in terms of long timescale trends, debating the significance of short term fluctuations of surface temperature is pointless right? A distraction.
“So, in terms of long timescale trends, debating the significance of short term fluctuations of surface temperature is pointless right? A distraction …”.
======================
Oh excuse me, I thought this thread was about the temperature trends this century so far, aka ‘pause’ or ‘no-pause’.
It shows delta J.
Like the rest of the trolls, McClod changes definitions on the fly, based on what he’s trying to obscure at the moment.
The oceans had negative heat before 1980?
we need to bang our heads against the walls, in the face of so much stupidity.
But Im busy otherwise, so Lets outsource this !
..I’m pretty sure that Griffy is available for hire !
If Griff were to pound his head in a forest, would he notice?
He’d make those trees ring (sorry, couldn’t resist)
+97
MarkW
“If Griff were to pound his head in a forest, would he notice?”
Not a chance in hell.
Some consensus scientists, like Phil Jones, accepted the reality of the Plateau by 2009, if not before. Hence the dozens of excuses or trial explanations for it run up the flagpole to see if anyone saluted.
Trenberth;s famous “travesty” remark was occasioned by the failure to explain the 2008 La Nina, and led to his trial balloon of heat hiding in the ocean depths. Getting it there of course would have required physics not previously observed elsewhere in the universe.
Karl conveniently disappeared himself after his parting shot, fired in support of the Paris cabal.
Shades of Hansen, getting out while the getting was good, as Mother Nature kept spanking his 1988 models.
O that’s my kind of mother!
Spare the rod and spoil the scientist.
CO2 has no significant effect on climate and here is why:
At a scale of the size of atoms, the atmosphere consists of gas molecules with empty space between them. Activity of the gas molecules determines what can be measured as temperature and pressure. Imagery of the activity of the molecules making up the atmosphere is helpful. Wikipedia, in the article on kinetic theory of gases, has a pretty good 2-D animation of the 3-D activity. It shows simulated molecules bouncing elastically off each other and the walls of the container. At any point in time, the speed (and energy) of the molecules ranges from zero to high values with the highest probability being towards lower energy.
Emission of electromagnetic radiation from a solid or liquid surface complies with the Planck spectrum and Stephan-Boltzmann (T4) law. This also includes most particles of smoke and aerosols because they typically contain millions of molecules. Emission of radiation from gas molecules is entirely different. It is quantized and depends on the energy levels of individual molecules which are determined probabilistically according to the Maxwell-Boltzmann distribution which favors lower energy photons. The average energy level of molecules in the Maxwell-Boltzmann distribution depends on the temperature.
Graphs of the probability distribution curve shape are shown in the Wikipedia article on Maxwell-Boltzmann. Molecules jostled to high enough energy for long enough time can emit a photon. This is called, for lack of a better term, reverse-thermalization. The Maxwell-Boltzmann distribution is more highly populated at lower energy levels resulting in biasing the Planck spectrum radiation emitted by the surface to lower energies favored according to Maxwell-Boltzmann. This also results in the higher energy (shorter wavelength) photons absorbed by the CO2 being substantially redirected to the lower energy (longer wavelength) photons emitted by water vapor molecules. The process is progressively more pronounced as temperature declines with increasing altitude.
Water vapor is the only significant greenhouse gas. What is happening, and humanity is probably contributing, is increasing water vapor. Average atmospheric water vapor is increasing more than twice as fast as it should be based on temperature increase alone (feedback). The ghg effect of that is countering the cooling that would otherwise be occurring. We will soon know if it is enough to prevent decent into another Little Ice Age . . . or worse. The physics is further described at http://globalclimatedrivers2.blogspot.com which also explains why CO2 has no significant effect on climate and identifies what does.
So we need to quit irrigating with and impounding ground water? Billions would starve and die of thirst, but that’s what Greens want, so it’s all good.
Or we pull water out of the air and pump it back underground. The place to start doing this is on the US-Mexican border, to stop the drug tunnels. Also in Egypt, to protect the ancient art that is being destroyed by crop irrigation, although much of that is with river water.
Of course, a warmer world with higher humidity is a better world, so why worry?
The only down side of increased WV that I see is increased risk of flooding and cost of snow removal.
“We can ignore reality but we can not ignore the consequences of ignoring reality” Ayn Rand
Balanced out by profits for the ski industry!
Drug tunnels are easy to eliminate.
End Prohibition.
M,
Not so sure. Depends upon price differential, among other factors.
Besides, if drugs were no longer profitable, then arms and humans would still be trafficked through them, as now.
Chi – I doubt that flood victims would perceive it as ‘balanced out’.
The world has been warming since the middle of the LIA. It hasn’t been warming more quickly recently.
The “CO2 roolz” believers have no explanation for why it hasn’t been warming more quickly recently.
Therefore they try to claim:
•The world is warming where we can’t see it (the Poles).
•The world is warming where we can’t see it (the Oceans).
•The world is warming where we can’t see it (the future – it’s coming soon).
Or…
•The world is warming but it’s not following CO2 as expected because El Ninos mask the effect.
All of which are subtle ways of admitting that the models don’t reflect what the world actually does.
The next step is to admit that the models are wrong because the assumptions are wrong.
Unfortunately a billion dollar academic and government enterprise relies upon the models, and a trillion dollar “renewable” industry depends upon the scare raised by the academic-government complex.
“The world has been warming since the middle of the LIA”
THANK GOODNESS for that !!
And the extra CO2 is totally and absolutely BENEFICIAL to all life on Earth.
Checking the full paper, it seems that not only did they not include the satellite data, they did not even say why they were not including it.
Skeptics are the satellites only friends. Alarmists prefer the Hockey Stick chart.
The satellite charts are not compatible with Alarmist theory. No “hotter and hotter and hotter” on the satellite chart. Nothing scary on the satellite chart. That’s not compatible with alarmist theory.
Before Tom Karl et al messed with the data, even the New York Times acknowledged the slowdown in global warming. From an August, 2014 article:
“There’s been a burst of worthy research aimed at figuring out what causes the stutter-steps in [global warming] — including the current hiatus/pause/plateau that has generated so much discussion. The oceans are high on the long list of contributors, given their capacity to absorb heat.”
https://dotearth.blogs.nytimes.com/2014/08/26/a-closer-look-at-turbulent-oceans-and-greenhouse-heating/?_r=0
China has a solution.
Anthony/mods,
OT and I apologize, and I know it’s not your fault (and maybe this comment should be posted somewhere else), but the the ads that keep forcing themselves on the screen are making these posts practically unreadable. I’m using Firefox. Is this an issue with other browsers, and is there anything a reader can do to limit/prevent it?
Install AdBlock Plus from Cnet for free(use the correct version for your browser)…You can turn it on or off when Nasty ads Take a web page hostage !!!
http://download.cnet.com/Adblock-Plus-for-Mozilla-Firefox/3000-11745_4-10636539.html
click “visit site” (safer this way)
Butch,
Thanks for the reply and info. I’ll give it a try.
Please remember to turn it off when Anthony’s pages don’t have this problem…
“Private Browsing” works too, from the browser opening pop-up. If all else fails.
NoScript, Phil R. It works like a charm for me. It’s a Firefox add-on and it’s free.
Let’s see now, we have the cooling after a major El Nino plus near solar minimum effects at least for NH temps. Next up we have AMO run down plus solar minimum followed by more obvious AMO decline. Enjoy the next two cool decades ahead. Settled science will need a police state to enforce order during this episode.
Well if 16 is good, how about 4 times that? ?ssl=1&w=450
It’s 4 times better right?
Bingo! In North America , Australia and other areas, the 1930’s were hotter than today. How was this possible with limited CO2 and no climate scientists to fudge data?
What if it isn’t a pause but the topping out of a long-term natural cycle (around a thousand years) on which many other cycles ride (including el-nino/la-nina)?
IMO, it’s too soon for the Current Warm Period to top out. If the natural cycles are about 1000 years, peak to peak, and the Medieval WP peak occurred c. AD 1250, then we still have more than 200 years to go. If however its peak heat was c. AD 1000, then, yeah, it could be downhill from here.
We’re due for another cyclic cooling phase within the secular warming trend of the past ~300 years, however. The long-term trend of the past 3000 to 5000 years remains down, down, down.
Just eyeballing the chart, it appears that the gaps between the warm periods has been shortening.
Maybe, but they’re still roughly a millennium.
Holocene Climate Optimum ended c. 5 Ka; Egyptian WP c. 4 Ka; Minoan WP c. 3 Ka; Roman WP c. 3 Ka, and Medieval WP c. 1 Ka.
Even without the Pause, the basic satellite-era trend of .2 degrees per decade is still deeply problematic for the models every year that it continues to not spike dramatically upward. The models always predict an increasing upward curvature in the near term, which is why the older models are generally more wrong. The absence of that predicted curve is more interesting.
I always find it funny – the hiatus is exactly what you would expect to see if climate sensitivity = 0.
Every single measurement we make indicates that the problem with global warming theory is that the level of climate sensitivity assumed in the equations was much, much too high. That number was always just a guess. And that guess is demonstrably wrong.
And climate sensitivity = 0 is exactly what we should have always expected to be true. If the climate was highly sensitive to minor changes in a trace gas, then we would see, in the historical and fossil record, wild and rapid swings in temperatures. High climate sensitivity was always highly unlikely simply because complex, systems CAN’T be simultaneously highly sensitive and relatively stable.
Exactly right! They are throwing fits over weather. That’s how stupid we’ve become. It snowed last week but the CO2 must be higher today because it’s nice out again. We had a hiatus yesterday afternoon just when I thought the temperature was going to keep climbing to about 900 and kill us all. I guess the CO2 must have all gone over to the dark side.
Honestly, how many more excuses can they have? And they refuse to recognize that Michael Mann produced a flat out fraud that is an embarrassment to science. It’s past time that other scientific disciplines speak up while science still has a reputation worth defending and we all have an economy that is functional.
Good post, Tenn.
Sadly, most discussions of “the pause” are predicated on calculations of “the trend” without any understanding that it is a consistently meaningful metric if–and only if–the data series has the simple structure of linear trend plus random noise. That is far from the case with virtually all climate time-series, which contain multiple oscillatory modes of various bandwidths and central periods. The computed regressional trend thus is highly dependent not only upon the duration of the computation, but also upon its start-time. It can be shown that, in the general case, it’s NOT a consistent measure of SECULAR trend, but merely the output of a very crude band-pass filter.
Contrary to the simplistic conceptual model of linear regression, climate is changing CONTINUALLY. Without circumspect specification of duration and start-time, the notions of “trend” and/or “pause” become vaguely meaningless.
No significant warming for 20 years under steadily accelerating CO2 accumulation in the air, on top of over 50 previous years of the same, however further falsifies the already repeatedly falsified hypothesis of Catastrophic Anthropogenic Climate Change Alarmism. Even 15 years are probably long enough to do so.
FWIW Santer said the model would have failed if we got to 17 years with no warming. SPOILER: We did. http://wattsupwiththat.com/2013/11/04/rss-reaches-santers-17-years/
In the CACA religion, all prior statements are subject to adjustment. Santer may prefer to recant his previous statement rather than be cast into outer darkness for his most grievous heresy.
“predicated on calculations of “the trend” without any understanding that it is a consistently meaningful metric if–and only if–the data series has the simple structure of linear trend plus random noise.”
That’s not true. The trend is an estimator of the derivative of the underlying secular curve. And it’s not true that derivatives are only meaningful for straight lines.
Of course a derivative estimate can be upset by oscillations etc. And trend is not the best possible estimator. But it isn’t meaningless.
Only a mathematical inept would use linear trends on a chaotic cyclic system as any sort of predictor.
But that’s Nick and the AGW bandwagon for you.
Well said, Nick. Your support of the AGW hypothesis in the face of the hiatus is not meaningless . Just nearly so.
Trend IS meaningless at climate scale. It depends entirely on the period selected.
“as Meehl et al said in Nature Climate Change, “Longer-term externally forced trends in global mean surface temperatures are embedded in the background noise of internally generated multidecadal variability.”
An apology that proves the point. “Embedded in the background noise” is apology splainin’ for “we got the period wrong”.
Nonsense! The derivative of an analytic function is defined at each and every POINT, not over some substantial INTERVAL of a random function. In discrete-time signal analysis, there are well-known estimators of the derivative–none of which involve the regressional trend. It’s only in “climate science” that such essential distinctions are unrecognized. Leave it to rabid polemicists to leave out the important qualifier of “[w]ithout circumspect specification of duration and start-time” in my characterization of unspecified trends as “vaguely meaningless.”
1sky1
“The derivative of an analytic function is defined at each and every POINT, not over some substantial INTERVAL of a random function.”
But for a numerically defined function it is found as Newton defined it, as a limit of secants (or some other difference approach). How do you think ODes are solved?
Proof of regression as derivative is here. more
here and here
Nick Stokes:
The limiting value of VANISHINGLY short secants should never be confused with the secant value of over SUBSTANTIAL, let alone long, intervals. Quoting your own, mathematically non-rigorous, musings about regressional trends and differentiation proves nothing beyond ineptitude in signal analysis. The fact remains that differentiation is strictly a high-pass operator, whereas the regressional trend is demonstrably a BAND-pass operator. The stark difference in frequency response is not just quantitative, but also qualitative.
Wait a few years and NOAA &. NASA will gradually “adjust” the current temperatures because they don’t match their CO2 greenhouse theory.
Today’s flat trend will morph into tomorrow’s rising trend.
In fact real-time data should be ignored for 20 years until all the proper “adjustments” are made.
To paraphrase John Cook — “We find that of all of abstracts who expressed a position on the AGW temperature pause, 97.1% endorsed the consensus position that the pause has occurred.”
That’s basically how he conducted his science, right? There is no real science, you only have to read abstracts.
Abstracts often make claims never proven in the study summarized, to get attention I suppose.
Only a fool or liar would use an abstract to evaluate a study.
Anyone heard about the “record crop loss” due to unusually colder temperatures? Or the record breaking snow fall or the global warming demonstration being snowed out in Denver?
Has anyone heard about crop loss due to unprecedented cold? Record breaking cold temps Worldwide? Or warmest demonstration being snowed out in Denver?
As well as the pause from 2001-2015, there was only a pause between 1980 and 1997 in both satellite data set, the slight upward linear trend only existing because of the phase of the cycles.

I do so hope that the NCSE’s subscription is up to date as in:
“….Q: Still, shouldn’t there be some explanation for the slowing? [the pause]
Yes, there should be, and while scientists are still trying to understand the details, the basic explanation almost certainly goes as follows…. blah blah blah”
Here they say (paraphrase) there are two sides to the story “….But on the other hand they make it clear that there is a real event that needs studying….”.
Hey but the NCSE reckons the explanation is almost a certainty.
That is why this whole farce is far from over.
“I will leave it to the reader to calculate the trend, and the error of the trend for the same period using other global surface temperature data sets.”
From start 2001 to end 2013 (which seems to be the period here):
HADCRUT 0.063 +-0.602 C/cen
GISS 0.506 +- 0.734
NOAA 0.509 +- 0.652
BEST 0.468 +- 0.863
C&W 0.489 +- 0.783
It’s a fairly HADCRUT-specific pause period, for the reasons shown in Cowtan and Way’s 2013 paper. HADCRUT lacks Arctic data and uses a crude grid-cell method.
As to the inclusion of 2015-6, that is just part of the data sequence, just as was the big dip in 2011-13, which is responsible for the above reduced trends.
Those “data series” are packs of lies. If perpetrated in the private sector instead of at the public trough, all would be actionable instances of blatant fr@ud.
Chimp
“Those “data series” are packs of lies. If perpetrated in the private sector instead of at the public trough, all would be actionable instances of blatant fr@ud.”
Really… then why has no one been able to refute it? Many have tried, most look foolish, but none have been successful. Really Chimp, your only defence is to yell “lies and fraud” with no evidence whats so ever to back up your mind numbingly boring assertion. Very sad really. Like the child who hides his face and thinks no one can see him.
Three decimal places for average temperature data?
False precision.
A propaganda technique.
Did someone drop you on your head as a child Mr. Stokes?
You must be kidding!
“Three decimal places for average temperature data?”
It isn’t average temperature data. It is trend, in °C/Century.
Reply to Nicky Stocks comment on May 4 at 4:36
RG: “Three decimal places for average temperature data?”
NS” “It isn’t average temperature data. It is trend, in °C/Century.”
They were average temperature data.
It doesn’t matter if presented as an actual temperature, an anomaly, or a trend.
You presented it in three decimal places.
That is false precision.
Grossly false precision.
Two decimal places would be false precision,
If you don’t realize that,then you don’t understand the quality of data you are working with.
Go back to school and learn how to present data accurately, without bias or false precision,
From above… “HADCRUT 0.063 +-0.602 C/cen’ ? So the error margin is larger than the anomaly ? LOL
“So the error margin is larger than the anomaly ?”
For heaven’s sake, can’t you read. It isn’t the anomaly. It’s a trend calculated over a short period. Of course it has uncertainty.
“For heaven’s sake, can’t you read.”
Reading and understanding are different things, Nick.
Butch on May 4, 2017 at 4:37 pm
HADCRUT 0.063 +-0.602 C
That’s the problem you always encounter when you compute trends over too small periods!
http://fs5.directupload.net/images/170505/gi6thaz9.png
Kevin Cowtan is even a bit more severe in the trend, and a bit more insightful wrt uncertainty 🙂
This trend has no significance at all.
So Nick, if the warming is Arctic based then it isn’t global. In fact, it is strong evidence the AMO is the cause of the warming.
Richard M on May 4, 2017 at 7:26 pm
So Nick, if the warming is Arctic based then it isn’t global.
Nick Stokes never told us that ‘the warming is Arctic based’. He tells us that Arctic’s warmth is underrepresented in the global HadCRUT4 record. That is true.
In the UAH record for example, it is not underrepresented:
http://fs5.directupload.net/images/170506/yr8brcvo.jpg
UAH6.0 trend for 1979-2016 (2 σ) in °C / decade:
– 60N – 82.5N: 0.26 ± 0,02
– 80N – 82.5N: 0.42 ± 0.04
In fact, it is strong evidence the AMO is the cause of the warming.
You never get tired to write that; but you also never brought any numbers nor even a simple chart to substantiate your narrative.
http://fs5.directupload.net/images/170506/3xgd7izl.jpg
Sources:
https://www.esrl.noaa.gov/psd/data/correlation/amon.us.long.mean.data
http://www.nsstc.uah.edu/data/msu/v6.0/tlt/
Oooh my bad, text mode! No one sees my so pretty beautiful pics! Je suis inconsolable 🙂
I thought you could check it out for yourself. Of course, when you don’t want to understand ….. ?itok=1Kdwhlgn
Richard M on May 6, 2017 at 8:11 am
Mea culpa, Richard M, I presented a chart with unscaled AMO data, it was late yesterday night (WUWT+9). Today evening I immediately saw the nonsense.
Thanks for the NCAR/UCAR plot, but it isn’t helpful at all: what I expect is that you show us at least a correlation between temperatures and AMO. To prove a causation is a much harder job I guess.
But I’m generous, Richard M, and did the correlation job for you 🙂
Caution when comparing here AMO with the NCAR/UCAR plot: it is undetrended, monthly and baselined wrt 1981-2010.
First step: the corrected graph comparing AMO with GHCN V3 unadjusted Arctic (60N-82.5N):
http://fs5.directupload.net/images/170506/bb9hh89p.jpg
Here, the correlation is all but evident! And as a recurring part of your narrative is that AMO is the driver of Arctic’s warmth, it was difficult to accept this correlation.
Then I compared the undetrended AMO with Japans‘ JMA Globe data:
http://fs5.directupload.net/images/170506/3cefwcuh.jpg
Here indeed we see a better correlation between AMO and temperatures, which however becomes first really strong in the 1970ies.
The next step: undetrended AMO with JMA Globe, NH and SH data:
http://fs5.directupload.net/images/170506/arc68riw.jpg
Similar situation, with the exception that the NH/SH split interestingly reveals a steep NH escape after 1998.
Thus I hamlet here a bit: to agree or not to agree, that’s the question! Ich bin gespalten…
It would be interesting to see Santer, Bonfils & al. continuing the job they began in 2014, by extracting AMO out of a (this time hopefully surface) temperature series like they did with ENSO and volcanoes for RSS TLT, and to look at the residual again.
What I have found is min temp follows dew point, and dew points follow ocean generated water vapor.
The causation is water vapor regulates cooling in the middle of the night.
Bindidon, how accurate is the Arctic data before 1950? The error bars are probably bigger than any squiggles you provided. Sorry, but sometimes we just don’t have enough good data.
Another cause of warming?
At least for men.
A little OT – the great champion of catastrophic global warming, who died a miserably cold death in the Titanic, has sprung to life by buying a Beachfront Home from one of Trump’s Cabinet Picks.
Maybe he has a fascination with drowning or does he not believe his own yarns?
http://www.mansionglobal.com/articles/50258-leonardo-dicaprio-buys-malibu-beachfront-home-from-one-of-trump-s-cabinet-picks
..Nice catch…..I bet Nicky lives on the beach also…(just so he can warn all of us when the SLR starts accelerating !)
“from one of Trump’s Cabinet Picks”
Does he have inside knowledge of what they are planning for us?
I live at about 50m altitude, which should be safe for a while.
Since the real climate measurements do not match the simulated climate measurements then the real climate measurements must be wrong because the simulated climate measurements were generated by computer and computers are infallable. Mother Nature cannot be trusted and must be forced to abide by what has been simulated. In terms of climate justice, Mother Nature is at fault and the legal system should force Mother Nature to pay damages.
Snow is a good cross check of the veracity of temperature datasets. Which is pretty reasonable since ice melts at 0 degrees C. That is not something that needs adjustment.
So what is snow saying?
http://climate.rutgers.edu/snowcover/images/rutgers-sce-anom2016.png
Nope no trends much. Looks like it has been pretty flat since about 1995 if a regression line could be added. Certainly looks nothing like an inverted GISS.
From here.
“Snow is a good cross check of the veracity of temperature datasets. “
It isn’t. It’s a measure of how much precipitation there was when the temperature was below 0°C.
Minneapolis is plenty cold in winter. But it gets less snow than, say, Albany, NY.
Nick,
That’s true most winters. It doesn’t matter for the whole hemisphere or continent, as should be obvious.
Snow stays longer when the winters are harder. It’s a far better indicator of climate change than the made up “surface data sets”.
Ok Nick. Explain the graph then please.
That is what scientists are supposed do, after all.
I have been a professional R&D scientist for more than 3 decades.
I could take your hypothesis to the logical inference but I’d rather hear what you have to say in defense of your comment.
Bruce
“Explian the graph”
It shows snow diminishing since the 70’s. That could be partly due to warming reducing the amount of days snow could fall. And/or partly due to those remaining days being drier.
Nick
“It shows snow diminishing since the 70’s. That could be partly due to warming reducing the amount of days snow could fall. And/or partly due to those remaining days being drier.”
or could be showing snow returning to the trend it was at prior to the cooling period during the 70s
Nick – You haven’t explained the pause in snow cover anomaly. I noted that the trend from 1995 to today is flat – which is consistent with the TLT satellite and balloon data but not the GISS dataset.
That you chose to instead say ‘look, squirrel’ means you are being less than candid. Which indicates to me that you agree with what I wrote. That is the logical inference of such an attempted misdirection.
Another good graph, relatively adjustment-free.
Thanks.
Northern hemisphere weekly snow cover since 1972 (Rutgers):
http://www.climate4you.com/images/NHemisphereSnowCoverSince1972.gif
Bruce of Newcastle on May 4, 2017 at 4:20 pm / May 5, 2017 at 3:21 pm
Snow is a good cross check of the veracity of temperature datasets. Which is pretty reasonable since ice melts at 0 degrees C. That is not something that needs adjustment.
Aha. Interesting! You do not seem to look very often at temperature datasets.
And I confess that I never had at snow fall! Many thanks for motivating me to download Rutgers‘ NH snow data. It will feef pretty good in a file near Colorado’s sea ice extent 🙂
So what is snow saying?
This, Bruce of Newcastle:
http://fs5.directupload.net/images/170506/bwtbp9ye.jpg
I noted that the trend from 1995 to today is flat…
You clearly see here that, as opposed to UAH’s trend which experiences, starting with 1995, less warming than since 1979, the snowfall really has a continuously flat trend.
BTW, UAH’s trend for the Globe, when starting with 1995, isn’t really flat: 0.08 °C /decade instead of -0.05 for the snow; and, as we don’t consider here worldwide snowfall but that in NH, we should compare these -0.05 with UAH NH’s trend, which is 0.11 °C /decade.
Certainly looks nothing like an inverted GISS.
Indeed! But you will sure notice that Rutgers‘ and Huntsville’s running means really look like mirrored along the bisector of their linear estimates. That looks pretty good controversial.
And if you compute the linear estimate for the entire Ruttgers dataset, you see that the snowfall trend when starting by november 1966 is even far lower than that when starting by december 1978: 0.51 ± 0.29 °C / decade.
The graph below shows the basic arithmetic of the “pause”. It shows anomalies of HADCRUT 4, with a 12-month running mean, but as displacements from the 2001-2013 mean shown in green. If there were to be a pause in the future, that green line would be close to the trend. To the right end, each red blob pulls the trend up according to its area, and blue pulls it down. The effects are the opposite at the left end.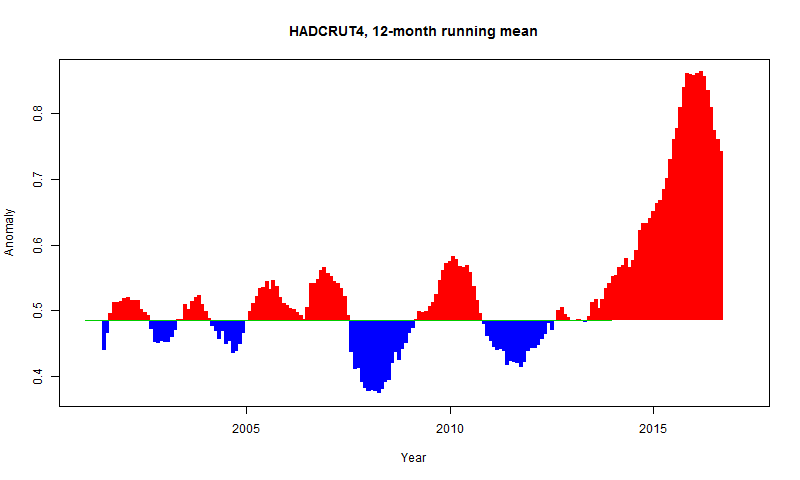
So the pause reflects the coincidence of two blue blobs around 2008 and 2012. In 2013, they were pulling the trend down. But they are now near the middle, where they have neutral effect. What has pulled the trends up is the big red at the end. And it would take a similar big blue to bring it back again.
Nick,
Are you serious?
Where is the El Nino of 1998?
Also, do you really consider HadCRU’s cooked books to be valid scientific data?
Sad.
Chimp,
I’m covering the period specified here, starting 2001. And yes, HADCRUT is valid data, although I think their methods could be improved..
I calculate global temperature from the raw GHCN data. It makes little difference.
Nick,
What a hoot!
That’s like saying that the methods of astrology could be improved.
The only acceptable method is the scientific one, in which every aspect of HadCRU is in violation.
Their “series” is not even remotely scientific, because it’s results aren’t repeatable, the dog having eaten their “data”.
It would be a joke, if only so many trillions in treasure and millions of lives had not been squandered as a result of their corruption.
Chimp,
“Their “series” is not even remotely scientific, because it’s results aren’t repeatable, the dog having eaten their “data”.”
Nonsense. It’s all here. Go for it.
Nick,
The nonsense is all yours.
Show all the station data they used for 1880 to 2000.
You can’t, because they don’t have it. As surely you must know.
http://www.dailymail.co.uk/news/article-1250872/Climategate-U-turn-Astonishment-scientist-centre-global-warming-email-row-admits-data-organised.html
“Show all the station data they used for 1880 to 2000.”
It’s all there, with sources cited. None of which depends on data which was stored in the 1980’s.
But all this is rather pointless. The head post made claims based on HADCRUT 4. I am answering those claims based on the data cited.
Nick,
No, all the data are not there. You take way too much on blind faith.
http://www.metoffice.gov.uk/hadobs/crutem4/data/download.html
All the surface data sets, so-called, are more or less fictitious.
Chimp,
From your link
“The station records on which the gridded CRUTEM4 dataset is built are available in ascii format in this archive: CRUTEM.4.5.0.0.station_files.zip. This archive contains all station records used to build the CRUTEM4 dataset.”
That is saying that it is all there. And it is. I know that well, because I did a complete temperature recon with the station data here.
Nick thankyou for that link.
It includes the sequence “crutem3” rather than crutem4, is that significant?
Also the 2nd comment (which I place here with your permission I hope) is:
AnonymousAugust 1, 2011 at 11:38 AM
Done
http://stevemosher.wordpress.com/2011/08/01/cru-data-in-rghcnv3/
Also a bit warmer. I’m wondering if we have source data and not adjusted data. In anycase when I add in the ocean ( which I match perfectly ) the differences will be mousenuts
Steve appears to be suggesting that the data used is adjusted. Did you ever get the source?
regards,
Colin
Colin,
CRUTEM 3 is what was current at the time. But the availability of station data hasn’t changed. And as your Mosh link shows, various people have been able to use it to get an index consistent with each other and with CRUTEM.
CRU do not apply a homogenisation procedure, but they use some data that has been adjusted by the source organisation.
For the desperately incredulous and embittered Chimp
Here is a link to a page presented by Google:
http://www.thegwpf.com/crutem4-global-warming-and-the-arctic/
Source: the Global Warming Policy Foundation
Date: 15/03/2012
Author: David Whitehouse
Maybe you start to learn all what you don’t know by reading that page, instead of insulting and discrediting all the time these people who work in institutions responsible for surface temperature management, who probably all are by far more intelligent than you are, Chimp.
Here is the chart showing the differences between CRUTEM3 and CRUTEM4, the main origin of the difference between HadCRUT4 and HadCRUT3 (deprecated since 2014):
http://clivebest.com/blog/wp-content/uploads/2012/03/DetailH3H4.png
(Courtesy Clive Best)
Maybe you will have enough courage to continue, e.g. by reading
http://tinyurl.com/jvtetdo
This the paper of Phil Jones et alii. Try to read it, instead of repeating mailgate nonsense you don’t have even half a bit of clue about!
I forgot to mention Clive Best’s excellent post on CRUTEM3/4 the graph is originating from:
http://clivebest.com/blog/?p=3493