
Guest essay by Clyde Spencer
Introduction
The point of this article is that one should not ascribe more accuracy and precision to available global temperature data than is warranted, after examination of the limitations of the data set(s). One regularly sees news stories claiming that the recent year/month was the (first, or second, etc.) warmest in recorded history. This claim is reinforced with a stated temperature difference or anomaly that is some hundredths of a degree warmer than some reference, such as the previous year(s). I’d like to draw the reader’s attention to the following quote from Taylor (1982):
“The most important point about our two experts’ measurements is this: like most scientific measurements, they would both have been useless, if they had not included reliable statements of their uncertainties.”
Before going any further, it is important that the reader understand the difference between accuracy and precision. Accuracy is how close a measurement (or series of repeated measurements) is to the actual value, and precision is the resolution with which the measurement can be stated. Another way of looking at it is provided by the following graphic:

The illustration implies that repeatability, or decreased variance, is a part of precision. It is, but more importantly, it is the ability to record, with greater certainty, where a measurement is located on the continuum of a measurement scale. Low accuracy is commonly the result of systematic errors; however, very low precision, which can result from random errors or inappropriate instrumentation, can contribute to individual measurements having low accuracy.
Accuracy
For the sake of the following discussion, I’ll ignore issues with weather station siting problems potentially corrupting representative temperatures and introducing bias. However, see this link for a review of problems. Similarly, I’ll ignore the issue of sampling protocol, which has been a major criticism of historical ocean pH measurements, but is no less of a problem for temperature measurements. Fundamentally, temperatures are spatially-biased to over-represent industrialized, urban areas in the mid-latitudes, yet claims are made for the entire globe.
There are two major issues with regard to the trustworthiness of current and historical temperature data. One is the accuracy of recorded temperatures over the useable temperature range, as described in Table 4.1 at the following link:
http://www.nws.noaa.gov/directives/sym/pd01013002curr.pdf
Section 4.1.3 at the above link states:
“4.1.3 General Instruments. The WMO suggests ordinary thermometers be able to measure with high certainty in the range of -20°F to 115°F, with maximum error less than 0.4°F…”
In general, modern temperature-measuring devices are required to be able to provide a temperature accurate to about ±1.0° F (0.56° C) at its reference temperature, and not be in error by more than ±2.0° F (1.1° C) over their operational range. Table 4.2 requires that the resolution (precision) be 0.1° F (0.06° C) with an accuracy of 0.4° F (0.2° C).
The US has one of the best weather monitoring programs in the world. However, the accuracy and precision should be viewed in the context of how global averages and historical temperatures are calculated from records, particularly those with less accuracy and precision. It is extremely difficult to assess the accuracy of historical temperature records; the original instruments are rarely available to check for calibration.
Precision
The second issue is the precision with which temperatures are recorded, and the resulting number of significant figures retained when calculations are performed, such as when deriving averages and anomalies. This is the most important part of this critique.
If a temperature is recorded to the nearest tenth (0.1) of a degree, the convention is that it has been rounded or estimated. That is, a temperature reported as 98.6° F could have been as low as 98.55 or as high as 98.64° F.
The general rule of thumb for addition/subtraction is that no more significant figures to the right of the decimal point should be retained in the sum, than the number of significant figures in the least precise measurement. When multiplying/dividing numbers, the conservative rule of thumb is that, at most, no more than one additional significant figure should be retained in the product than that which the multiplicand with the least significant figures contains. Although, the rule usually followed is to retain only as many significant figures as that which the least precise multiplicand had. [For an expanded explanation of the rules of significant figures and mathematical operations with them, go to this Purdue site.]
Unlike a case with exact integers, a reduction in the number of significant figures in even one of the measurements in a series increases uncertainty in an average. Intuitively, one should anticipate that degrading the precision of one or more measurements in a set should degrade the precision of the result of mathematical operations. As an example, assume that one wants the arithmetic mean of the numbers 50., 40.0, and 30.0, where the trailing zeros are the last significant figure. The sum of the three numbers is 120., with three significant figures. Dividing by the integer 3 (exact) yields 40.0, with an uncertainty in the next position of ±0.05 implied.
Now, what if we take into account the implicit uncertainty of all the measurements? For example, consider that, in the previously examined set, all the measurements have an implied uncertainty. The sum of 50. ±0.5 + 40.0 ±0.05 + 30.0 ±0.05 becomes 120. ±0.6. While not highly probable, it is possible that all of the errors could have the same sign. That means, the average could be as small as 39.80 (119.4/3), or as large as 40.20 (120.6/3). That is, 40.00 ±0.20; this number should be rounded down to 40.0 ±0.2. Comparing these results, with what was obtained previously, it can be seen that there is an increase in the uncertainty. The potential difference between the bounds of the mean value may increase as more data are averaged.
It is generally well known, especially amongst surveyors, that the precision of multiple, averaged measurements varies inversely with the square-root of the number of readings that are taken. Averaging tends to remove the random error in rounding when measuring a fixed value. However, the caveats here are that the measurements have to be taken with the same instrument, on the same fixed parameter, such as an angle turned with a transit. Furthermore, Smirnoff (1961) cautions, ”… at a low order of precision no increase in accuracy will result from repeated measurements.” He expands on this with the remark, “…the prerequisite condition for improving the accuracy is that measurements must be of such an order of precision that there will be some variations in recorded values.” The implication here is that there is a limit to how much the precision can be increased. Thus, while the definition of the Standard Error of the Mean is the Standard Deviation of samples divided by the square-root of the number of samples, the process cannot be repeated indefinitely to obtain any precision desired!1
While multiple observers may eliminate systematic error resulting from observer bias, the other requirements are less forgiving. Different instruments will have different accuracies and may introduce greater imprecision in averaged values.
Similarly, measuring different angles tells one nothing about the accuracy or precision of a particular angle of interest. Thus, measuring multiple temperatures, over a series of hours or days, tells one nothing about the uncertainty in temperature, at a given location, at a particular time, and can do nothing to eliminate rounding errors. A physical object has intrinsic properties such as density or specific heat. However, temperatures are ephemeral and one cannot return and measure the temperature again at some later time. Fundamentally, one only has one chance to determine the precise temperature at a site, at a particular time.
The NOAA Automated Surface Observing System (ASOS) has an unconventional way of handling ambient temperature data. The User’s Guide says the following in section 3.1.2:
“Once each minute the ACU calculates the 5-minute average ambient temperature and dew point temperature from the 1-minute average observations… These 5-minute averages are rounded to the nearest degree Fahrenheit, converted to the nearest 0.1 degree Celsius, and reported once each minute as the 5-minute average ambient and dew point temperatures…”
This automated procedure is performed with temperature sensors specified to have an RMS error of 0.9° F (0.5° C), a maximum error of ±1.8° F (±1.0° C), and a resolution of 0.1° F (0.06° C) in the most likely temperature ranges encountered in the continental USA. [See Table 1 in the User’s Guide.] One (1. ±0.5) degree Fahrenheit is equivalent to 0.6 ±0.3 degrees Celsius. Reporting the rounded Celsius temperature, as specified above in the quote, implies a precision of 0.1° C when only 0.6 ±0.3° C is justified, thus implying a precision 3 to 9-times greater than what it is. In any event, even using modern temperature data that are commonly available, reporting temperature anomalies with two or more significant figures to the right of the decimal point is not warranted!
Consequences
Where these issues become particularly important is when temperature data from different sources, which use different instrumentation with varying accuracy and precision, are used to consolidate or aggregate all available global temperatures. Also, it becomes an issue in comparing historical data with modern data, and particularly in computing anomalies. A significant problem with historical data is that, typically, temperatures were only measured to the nearest degree (As with modern ASOS temperatures!). Hence, the historical data have low precision (and unknown accuracy), and the rule given above for subtraction comes into play when calculating what are called temperature anomalies. That is, data are averaged to determine a so-called temperature baseline, typically for a 30-year period. That baseline is subtracted from modern data to define an anomaly. A way around the subtraction issue is to calculate the best historical average available, and then define it as having as many significant figures as modern data. Then, there is no requirement to truncate or round modern data. One can then legitimately say what the modern anomalies are with respect to the defined baseline, although it will not be obvious if the difference is statistically significant. Unfortunately, one is just deluding themselves if they think that they can say anything about how modern temperature readings compare to historical temperatures when the variations are to the right of the decimal point!
Indicative of the problem is that data published by NASA show the same implied precision (±0.005° C) for the late-1800s as for modern anomaly data. The character of the data table, with entries of 1 to 3 digits with no decimal points, suggests that attention to significant figures received little consideration. Even more egregious is the representation of precision of ±0.0005° C for anomalies in a Wikipedia article wherein NASA is attributed as the source.
Ideally, one should have a continuous record of temperatures throughout a 24-hour period and integrate the area under the temperature/time graph to obtain a true, average daily temperature. However, one rarely has that kind of temperature record, especially for older data. Thus, we have to do the best we can with the data that we have, which is often a diurnal range. Taking a daily high and low temperature, and averaging them separately, gives one insight on how station temperatures change over time. Evidence indicates that the high and low temperatures are not changing in parallel over the last 100 years; until recently, the low temperatures were increasing faster than the highs. That means, even for long-term, well-maintained weather stations, we don’t have a true average of temperatures over time. At best, we have an average of the daily high and low temperatures. Averaging them creates an artifact that loses information.
When one computes an average for purposes of scientific analysis, conventionally, it is presented with a standard deviation, a measure of variability of the individual samples of the average. I have not seen any published standard deviations associated with annual global-temperature averages. However, utilizing Tchebysheff’s Theorem and the Empirical Rule (Mendenhall, 1975), we can come up with a conservative estimate of the standard deviation for global averages. That is, the range in global temperatures should be approximately four times the standard deviation (Range ≈ ±4s). For Summer desert temperatures reaching about 130° F and Winter Antarctic temperatures reaching -120° F, that gives Earth an annual range in temperature of at least 250° F; thus, an estimated standard deviation of about 31° F! Because deserts and the polar regions are so poorly monitored, it is likely that the range (and thus the standard deviation) is larger than my assumptions. One should intuitively suspect that since few of the global measurements are close to the average, the standard deviation for the average is high! Yet, global annual anomalies are commonly reported with significant figures to the right of the decimal point. Averaging the annual high temperatures separately from the annual lows would considerably reduce the estimated standard deviation, but it still would not justify the precision that is reported commonly. This estimated standard deviation is probably telling us more about the frequency distribution of temperatures than the precision with which the mean is known. It says that probably a little more than 2/3rds of the recorded surface temperatures are between -26. and +36.° F. Because the median of this range is 5.0° F, and the generally accepted mean global temperature is about 59° F, it suggests that there is a long tail on the distribution, biasing the estimate of the median to a lower temperature.
Summary
In summary, there are numerous data handling practices, which climatologists generally ignore, that seriously compromise the veracity of the claims of record average-temperatures, and are reflective of poor science. The statistical significance of temperature differences with 3 or even 2 significant figures to the right of the decimal point is highly questionable. One is not justified in using the approach of calculating the Standard Error of the Mean to improve precision, by removing random errors, because there is no fixed, single value that random errors cluster about. The global average is a hypothetical construct that doesn’t exist in Nature. Instead, temperatures are changing, creating variable, systematic-like errors. Real scientists are concerned about the magnitude and origin of the inevitable errors in their measurements.
References
Mendenhall, William, (1975), Introduction to probability and statistics, 4th ed.; Duxbury Press, North Scituate, MA, p. 41
Smirnoff, Michael V., (1961), Measurements for engineering and other surveys; Prentice Hall, Englewood Cliffs, NJ, p.181
Taylor, John R., (1982), An introduction to error analysis – the study of uncertainties in physical measurements; University Science Books, Mill Valley, CA, p.6
1Note: One cannot take a single measurement, add it to itself a hundred times, and then divide by 100 to claim an order of magnitude increase in precision. Similarly, if one has redundant measurements that don’t provide additional information regarding accuracy or dispersion, because of poor precision, then one isn’t justified in averaging them and claiming more precision. Imagine that one is tasked with measuring an object whose true length is 1.0001 meters, and all that one has is a meter stick. No amount of measuring and re-measuring with the meter stick is going to resolve that 1/10th of a millimeter.
Claiming accuracy of a hundredth of a degree by averaging instruments only accurate to half a degree? Evidently good enough for government work./s
An individual roll of a dice is going to be one of {1,2,3,4,5,6}.
But what’s the expected average of a thousand rolls? 3.5000 +/- 0.0033.
Notice how the precision is a lot higher when you average the rolls. It doesn’t have to be the same roll of the same die, only that you’re measuring the same thing, whether the average of dice rolls or the average global temperature anomaly.
That’s only true when your error is random and normally distributed.
Neither condition is true for temperature records.
With dice, one is recording unchanging numbers. With thermometers, one is measuring changing numbers, so one needs to take the standard deviation and such into account. You will have a group on a graph, not an approximation of a point.
You make an interesting point, I hadn’t realised that a measured temperature at a set location was a random measurement between two limits and repeated under the same conditions.
Windchasers,
In your example, you are averaging integers, which are exact. That is, they have infinite precision.
http://codinglair.com/image/Errorists.jpg
Windchasers,
In looking up some references on the Law of Large Numbers, it appears that Wikipedia (https://en.wikipedia.org/wiki/Law_of_large_numbers) should be acceptable, since it seems to be the source that you used. Note that the explanation says that the average should converge on the EXPECTED value. That is clearly a fixed value when a theorem is involved. However, we have no way of knowing what the “expected” value for Earth is; it changes from moment to moment! Indeed, The Wikipedia article specifically states, “If the expected values change during the series, then we can simply apply the law to the average deviation from the respective expected values. The law then states that this converges in probability to zero.” The “expected” value would be some instantaneous measurement, not a series over an extended period of time. Thus, the average for a particular 30-year period would be different from the average for a series shifted by one or more years. Therefore, I maintain that the correct metric for uncertainty for any given temperature series is the Standard Deviation, and not the SD divided by the SQRT of the number of samples.
The Wikipedia article further states, “Kolmogorov also showed, in 1933, that if the variables are independent and identically distributed, then for the average to converge almost surely on something (this can be considered another statement of the strong law), it is necessary that they have an expected value (and then of course the average will converge almost surely on that).” Temperatures are not independent variables. They are in fact strongly auto-correlated, suggesting that the conditions for the strong law are not met. How do you propose to demonstrate that all global temperatures have an expected value over any arbitrary time interval? If a station at one elevation is closed, and another opened at a different elevation, the average will change, as with changing the time interval.
Clyde, let me help you out here. You say, ” Therefore, I maintain that the correct metric for uncertainty for any given temperature series is the Standard Deviation, and not the SD divided by the SQRT of the number of samples.” You are mixing apples with oranges. First of all, the uncertainty for a single temperature measurement is the standard deviation. When you have more than one temperature measurement, you are dealing withe Standard Error. This is because Standard Error is a function of the individual measurements standard deviation and it includes the number of obs. The “series” is more than one measurement.
Of course, after the data was adjusted by unknown methods, it is impossible to make any conclusions from the data set.
Michael Darby,
Let me help you out here: “In statistics, the standard deviation … is a measure that is used to quantify the amount of variation or dispersion of a SET of data values.” https://en.wikipedia.org/wiki/Standard_deviation
A single sample may be characterized as being so many standard deviations from the mean, but the standard deviation actually defines the bounds that confine approximately 68% of the total samples.
Clyde makes a mistake when he posts: “the standard deviation actually defines the bounds that confine approximately 68% of the total samples.” The mistake you make is that not all random variables are normally distributed. Rookie error……when the error distribution of the measuring instrument is uniformly distributed, your statement if erroneous.
Not only you are measuring changing numbers, you are using a thermometer to measure the temperature in New York city, for instance, and a different thermometer to measure the temperature in Boston, which not only is changing as well but also is different from the temperature in NYC,
So, how measuring the temperature in NYC increases the precision of the temperature measured in Boston?
Just asking.
Windchasers,
After mulling the Wikipedia article over in my mind, I have some additional comments. Your assertion that 1000 rolls of the dice will result in a precision of 3.5000 is wrong. (Also, you should truncate the last “3” and report your claim as “3.500 +/- 0.003”.) You are dealing with integers, which have unlimited precision. The problem is that the answer is not ACCURATE until you take many samples. Note the graph at the top right (https://en.wikipedia.org/wiki/Law_of_large_numbers) showing the results of many trials. The results oscillate strongly until about 500 trials. This does not speak to an increase in precision, but rather, speaks to CONVERGING to the correct answer. The calculation of the function predicting the average has infinite precision because you are using integers. Similarly, the average of the trials have infinite precision because you are using integers. The trial numbers change, however, to approach the theoretical value of 3.500…0 to have a small error that can only be expressed by showing more significant figures.
Your claim seems to be a misconception of people who cut their teeth on computers that spit out 15 or more digits when a calculation is performed. You haven’t been taught to look at the results to determine which of those digits are meaningless in the context of the inputs and the application.
That figure would properly be expressed as 3.500 +/- 0.003. Only one non-zero digit in the uncertainty, and the mean can’t be more precise than the uncertainty.
Average Global Temperatures??? The sampling is unbelievably patchy.
“Please Note: Grey areas represent missing data.” NOAA says.
https://www.ncdc.noaa.gov/sotc/service/global/map-land-sfc-mntp/201702.gi
Note that the ocean grid cells are actually land temperatures (i.e. islands) extrapolated out to fill the grid cells. A casual glance tells me that the “Global Average” is really an over sampling of North America, Europe, a swath of parts of Asia, a small fraction of Africa, a South America dominated by Argentina, Australia’s south and east.
Check out Greenland and Antarctica, the lands of melting icecaps. Pathetic.
Richard G. on April 12, 2017 at 9:50 am
1. Note that the ocean grid cells are actually land temperatures (i.e. islands) extrapolated out to fill the grid cells.
No:
– It is not GHCN’s role to give us information about the oceans: that is ERSST’s domain.
– All GHCN and ERSST users (e.g., GISTEMP) have land and sea masks with finest resolution allowing them to accurately separate land and sea areas.
2. Check out Greenland and Antarctica, the lands of melting icecaps. Pathetic.
The first what I had to learn, Richard G., when inspecting UAH’s most detailed dataset (a 2.5° grid over the Globe) was that
– though Roy Spencer claims for full measurement in his zonal files, neither 82.5S-90S nor 82.5N-90N are present (all cells there contain an “invalid value”);
– regions like Greenland, Tibet, the Andes (in fact, anything clearly above 1,500 m, see their readme file) are “poorly covered”.
Nevertheless, nobody claims the UAH dataset to be insufficient, me included.
3. A casual glance tells me that the “Global Average” is really an over sampling of North America, Europe, a swath of parts of Asia, a small fraction of Africa, a South America dominated by Argentina, Australia’s south and east.
When processing UAH’s grid (9,504 cells), you understand that you can perfectly approximate the Globe with an averaging of no more than 512 evenly distributed cells, i.e. about 5 % of the whole.
This means that we need far less information to build a global average than we imagine.
Not only that… but the highest increases in temperature observed over the entire planet surface are found in the United States Of America?
How can this be?
The extreme record high temperatures for each state are found in the link below.
https://en.wikipedia.org/wiki/U.S._state_temperature_extremes
Alaska 100 °F / 38 °C June 27, 1915
California 134 °F / 57 °C July 10, 1913
Florida 109 °F / 43 °C June 29, 1931
Kentucky 114 °F / 46 °C July 28, 1930
New York 109 °F / 42 °C July 22, 1926
Texas 120 °F / 49 °C June 28, 1994* (tied with 1933)
This has to be put down to either mind-numbingly sheer incompetence, or massive psychedelic drug consumption on a scale never previously witnessed if the true answer is not to be found within an entirely corrupted academic community of ‘Climate scientists’ and those who enable them.
They appear to be using 5 degree by 5 degree cells, which is absurdly coarse. You will note that cells defined by equal dimensions of latitude and longitude get smaller as they approach the poles, and become vanishingly small at the poles. Does the computation of average give weight to the actual sizes of the cells or not (i.e. bigger cells near the equator count for more than smaller cells near the poles). Do they tell you? If they do, I haven’t seen it. So right there is a way of getting the results to vary, and you can pick the numbers you like best.
And how do they calculate the value for cells with lots of data points in them? Homogenizing, that’s what they do. What does it mean? Read it on the NOOa website and see if you can figure it out. I couldn’t.
So there are two areas where data can be tweaked towards desired values, without even thinking about issues of precision and accuracy. It’s how they calculate the average that is the key to data manipulation.
Excuse me Bindidon,
1- When it says ‘Land-Only’ and gives a grid cell value in the middle of the deep blue sea, and does not say ‘ERSST’, what else can it be but extrapolated values from measurement on land (Island)? Please educate me. My point is that ‘Land-Only’ means to me that there is no data for 70 % of the globe (the aqueous portion) depicted in their map.
2-I am not talking about UAH. (Diversion, *ding*) All (ALL) of the grid cell values for Greenland (4) and Antarctica (8) are from coastal (maritime) locations. The interiors are gray: “represent missing data”. Unintended perhaps but it nonetheless introduces a bias into any statistical average temperature. A simple acknowledgment would be appreciated.
3- Again, I am not talking about UAH. I am not even claiming GHCN is in any way saying this map represents a Global Average Temperature. My point is that to claim any sort of Global Average based on a woefully incomplete data record may be statistics but it is far from being good science. Look at the actual data. If the data are not there, be ware. If the data are not there you can not just make it up.
(I am reminded of the Harry_Read_Me.txt files from HADCRUT climategate:
“Here, the expected 1990-2003 period is MISSING – so the correlations aren’t so hot! Yet the WMO codes and station names /locations are identical (or close). What the hell is supposed to happen here? Oh yeah – there is no ‘supposed’, I can make it up. So I have :-)”
Beware of statisticians bearing gifts.
I posted this map to illustrate how incomplete the land based temperature record really is.
Was it Richard Feynman who said ‘first, don’t fool your self’?
just another thought about the grid: location of the weather stations.
since they changed the transport here i have to go now to my work by bike. Well i go to a small 40.000 habitants town to a village of 5000 people. This 8 km long track goes through an open rural landscape from village center to the town center.
This road also goes through a marshy area for 1 km
now what i never expected is how much the temperature on such a short 8 km track can vary especially on the first sunny spring days: the drops and rises in temperature of each area (patch of forest, open fields marshy area town-village are even at the inaccurate and -not precise at all- feel noticeable
says enough about how patchy our temperature record is.
Richard G. – April 12, 2017 at 9:37 pm
Richard G, all of the climate “experts” and the partisan believers in/of CAGW have been touting the extreme accuracy of their claimed circa 1880 Global Average Temperatures …… but iffen you want to “display” how grossly inaccurate and utterly deceiving their claims are, …… just post another map similar to this one, to wit:

And iffen you do, I am positive that 97+% of that circa 1880 map would contain Grey areas representing missing data.
Richard G. on April 12, 2017 at 9:37 pm
Many thanks Richard G. for your interesting comment (which sounds by far more intelligent and intelligible than all those around yours).
1. When it says ‘Land-Only’ and gives a grid cell value in the middle of the deep blue sea, and does not say ‘ERSST’, what else can it be but extrapolated values from measurement on land (Island)?
The answer I gave already in my comment: all GHCN users use ERSST together with land/ocean masks allowing them (or better: their software packages) to determine for each grid cell what in it is land and what is sea, in order to have an appropriate land/sea ratio to compute the cells’s average.
I confess that until now I never had kept attention to any land-only grid-based map displayed on any web site!
And I now understand a posteriori what irritates you: the dumb extrapolation of each even smallest island to grid cell size, an extrapolation which nowhere else exists. Islands evidently should here be restricted to those exceeding grid size, i.e. about 280 x 280 km.
See for example a picture displayed month by month on Nick Stokes’s moyhu web site, showing the integration of GHCN and ERSST:
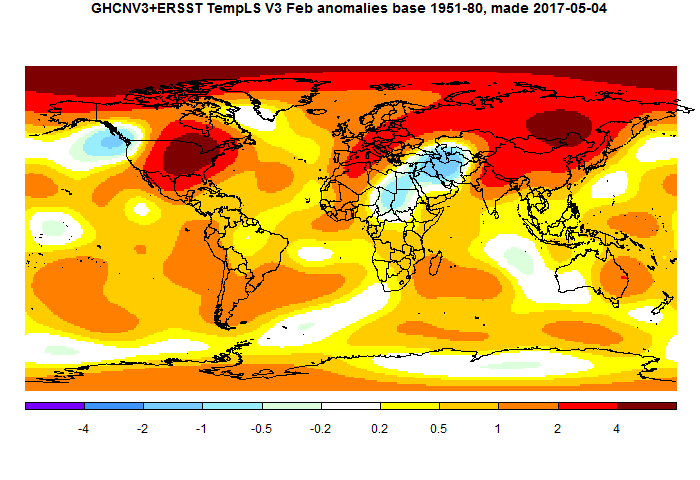
Be sure that this chart is a thoroughly correct integration of land and ocean data!
2. I am not talking about UAH.
But I am, Richard! Just because I wanted to show you that missing data is by far not a privilege of surface temperature measurement.
So even if Greenland etc are in UAH (unlike the Poles) not regions with ‚no data at all‘, they nevertheless keep grey zones subject to high caution when evaluated by professional users.
But let us come back to GHCN: everybody in the world (mining engineers, land surveyors, etc etc) extrapolates to obtain data where there were none! So do climate people as well.
Their problem: climate science is worldwide the one being subject to heaviest skepticism against anything able to be put into doubt. What never has been worth any hint anywhere, namely interpolation through kriging, suddenly becomes something worth to harsh attack, especially by people who don’t know what it is neither a fortiori how it works.
As an alternative to bare GHCN, please have a look at e.g. Berkeley data (they don’t use GHCN):
http://berkeleyearth.lbl.gov/regions/greenland
3. Again, I am not talking about UAH.
But again, I am. Simply because my reference to sparse UAH data amazingly akin to the full dataset was a trial to explain you that you very often really don’t need full coverage to obtain a reasonable mean:

See the discussion about that in the comment
https://wattsupwiththat.com/2017/04/12/are-claimed-global-record-temperatures-valid/#comment-2474619.
One of the best examples is a comparison of GHCN and UAH at latitudes 80-82.5N: there you have no more than 3 ridiculous GHCN stations compared with the 144 UAH grid cells of this latitude stripe.
You think: never and never will these 3 stations be source of an accurate averaging! But if you average the 3 UAH cells encompassing them, you obtain results quite similar to those of all 144 cells.
Richard G. on April 12, 2017 at 9:50 am [2]
My first answer, though incomplete, was long enough.
I had tried to underline that considering GHCN data may be somewhat dangerous as soon as you transpose your meaning about it to your meaning about the Globe: you have to add ERSST to it.
Let me add a bit in the same direction, as GISTEMP is a synthesis not only of GHCN and ERSST, but also of the so called SCAR data (the Scientific Comittee on Atlantic Research) through which GISTEMP adds the Antarctic stations (over 40) listed below:
https://legacy.bas.ac.uk/met/READER/surface/stationpt.html
Don’t tell me “What??? GISTEMP? All adjusted data! They cool the past to warm the present!”.
http://fs5.directupload.net/images/170413/bfoo8rpk.jpg
In grey you see GHCN unadjusted; in red, GISTEMP land-only; in blue, GISTEMP global.
SC on April 12, 2017 at 3:52 pm
Not only that… but the highest increases in temperature observed over the entire planet surface are found in the United States Of America?
How can this be?
SC, the graph presented by Richard G deals with anomalies wrt to UAH’s baseline (1981-2010); you tell us about absolute values. That is really quite different.
I don’t have absolute temps for CONUS on this computer, but well for the Globe (jan 1880-dec 2016).
Please compare the 20 highest anomalies (wrt mean of jan 1981 – dec 2010)
1992 2 2.89
1991 2 2.87
1992 1 2.68
2015 12 2.67
1998 2 2.45
2016 2 2.31
2016 3 2.14
1991 1 2.01
1991 12 1.97
1990 11 1.96
1991 3 1.95
1999 2 1.86
2012 3 1.81
1992 3 1.69
1998 1 1.65
2000 2 1.64
1994 12 1.61
1999 11 1.60
1998 9 1.47
2015 11 1.39
with the 20 highest absolute values
2006 7 22.94
2012 7 22.90
2002 7 22.87
1901 7 22.80
2010 7 22.68
2005 7 22.59
2011 7 22.56
1998 7 22.53
1999 7 22.51
2016 7 22.50
1995 8 22.42
2003 7 22.42
1995 7 22.39
2003 8 22.38
2001 8 22.35
2008 7 22.35
2010 8 22.31
2007 8 22.29
2015 7 22.29
2016 8 22.28
You’ll immediately understand what I mean, I guess 🙂
Smart Rock on April 12, 2017 at 8:14 pm
They appear to be using 5 degree by 5 degree cells, which is absurdly coarse. You will note that cells defined by equal dimensions of latitude and longitude get smaller as they approach the poles, and become vanishingly small at the poles.
Do you really believe, Smart Rock, to be the one and only on Earth being able to think of such trivial matters ans to integrate them into your work?
Excuse me please: you behave here like an old teacher standing in front of 12 years old students…
Why don’t you suppose a priori that “they” do right?
Never heard of latitude cosine weighting, Smart Rock?
Ah, Bindy is back with condescending thread bombing and slinging red herring distractions.
Just bin his falsehoods; absolutely nothing will be lost.
(though one can be amused by binned’s long lists as thread bomb tactic)
How nice! A sweet binned personal history story that ends with nonsense.
Technically, binned does end with two logical fallacies:
A) argumentum ad ignorantiam: “regions like Greenland, Tibet, the Andes (in fact, anything clearly above 1,500 m, see their readme file)”
– – This particular example also depends on circular reasoning
B) Sophistic argument contradiction introducing paradox.
– – “are “poorly covered”
– – “Nevertheless, nobody claims the UAH dataset to be insufficient”
By binned’s own words, a dataset is insufficient, then binned claims nobody claims the UAH dataset is insufficient.
The strawman approach; introduce a contradictory strawman, argue against said strawman.
Ah, more logical fallacies!
-Composition Fallacy
-Confirmation bias
-Statistical Generalization
-Statistical Average
Base fallacy!
“This means that we need far less information to build a global average than we imagine”
Casually with condescension, binned substitutes gibberish for reality then makes a false claim; without parameters or confidence bounds.
From all of this illogic and sophistry binned feels free to thread bomb using his fallacies.
BOGUS!
ATheoK on April 14, 2017 at 12:17 pm
Ah, more logical fallacies!
-Composition Fallacy
-Confirmation bias
-Statistical Generalization
-Statistical Average
Base fallacy!
“This means that we need far less information to build a global average than we imagine”
Casually with condescension, binned substitutes gibberish for reality then makes a false claim; without parameters or confidence bounds.
From all of this illogic and sophistry binned feels free to thread bomb using his fallacies.
BOGUS!
Typical nonsense produced py people who write a 30 cm long comment without even one mg of scientific contradiction.
The perfect political antithesis to persons having interest in Science.
Download UAH’s grid data, ATheoK, and start on some heavy working, instead of eructating your redundant, complacent and egocentric blah blah!
Extrapolation and interpolation work well when the trend of the data is well-established and the relationship can be expressed in an equation. Neither of these apply when dealing with temperatures between two points, or temps out beyond the end of the collected data. It can’t be considered “data” either, but only a prediction. One doesn’t get to plug that data into the calculation to “refine” the precision.
Bindidon April 13, 2017 at 9:02 am
“The Extended Reconstructed Sea Surface Temperature (ERSST) dataset is a global monthly sea surface temperature analysis derived from the International Comprehensive Ocean–Atmosphere Dataset with missing data filled in by statistical methods.”-Extended Reconstructed Sea Surface Temperature (ERSST) v3b.
This is the description from the NOAA website: **with missing data filled in by statistical methods.**
The description goes on to read:
“This monthly analysis begins in January 1854 continuing to the present and includes anomalies computed with respect to a 1971–2000 monthly climatology. The newest version of ERSST, version 3b, is optimally tuned to exclude under-sampled regions for global averages. In contrast to version 3, ERSST v3b does not include satellite data, which were found to cause a cold bias significant enough to change the rankings of months.”
When they say “tuned to exclude under-sampled regions for global averages” this is a De-facto admission of under sampling in the historical data set. Read as *missing data*.
You state: “See for example a picture displayed month by month on Nick Stokes’s moyhu web site, showing the integration of GHCN and ERSST:
Be sure that this chart is a thoroughly correct integration of land and ocean data!”
Let me correct your statement: this chart is a thoroughly correct integration of land and ocean data and MISSING data. (There, I fixed it for you.) It just doesn’t show where the missing data locations reside. It does pretend to show data where none exists. We know this from the GHCN mapping which is being honest about their deficiencies.
James Schrumpf on April 15, 2017 at 4:52 am
Extrapolation …
1. Extrapolation? Where did I mention that in the text you refer to?
… and interpolation work well when the trend of the data is well-established and the relationship can be expressed in an equation.
Neither of these apply when dealing with temperatures between two points…
2. Wow! You are pretending strange things here! What about citing some valuable source a mining engineer specialised e.g. in kriging would immediately subscribe to?
… or temps out beyond the end of the collected data. It can’t be considered “data” either, but only a prediction. One doesn’t get to plug that data into the calculation to “refine” the precision.
3. Nobody spoke about that, especially didn’t I.
My guess: you seem to have read my little comment in ‘ultradiagonal mode’. You didn’t react to what I wrote, but rather to what you thought I did.
Richard G. April 15, 2017 at 2:21 pm
Let me correct your statement: this chart is a thoroughly correct integration of land and ocean data and MISSING data. It just doesn’t show where the missing data locations reside. It does pretend to show data where none exists.
Yes, Richard.
But interestingly, you are ONLY interested in missing data originating from SURFACE temperature measurements.
Otherwise, you CERTAINLY would have shown some appropriate reaction to the information contained in my last post concerning the 90 % similarity between a full UAH grid dataset and laughable 5 % of it.
But since it is SATELLITE data, everything seems to be OK for Richarg G. 🙂
If I had time enough to do such an incredibly stoopid job, Richard G., I would carefully thin out the GHCN V3 and the ERSST V4 data, keeping about 10 % of them, and show you the result and how little it differs from the original.
Unluckily, that’s a huge job compared with solely selecting 512 evenly distributed cells out of an array of 9,504!
With statistics anything is possible! And “journalists” are too dumb to know when they’re being snow-jobbed (or they just like reporting drama-filled stories and don’t care about truth).
Windchasers: I think you’re talking about discrete vs continuous distributions. The math is, I believe somewhat different although the difference(s) can often be safely ignored.
The math for estimating a probability distribution is a bit different; for a continuous distribution you can take ever-smaller intervals whereas you can’t for discrete.
But generally? Yeah, they’re pretty similar. And things like the Laws of Large Numbers apply either way, as you’re talking about averages.
the Laws of Large Numbers apply either way
================
the law of large numbers only applies for a constant average and distribution, such as a coin toss. time series data rarely satisfies this requirement.
Well, the instruments are precise to 0.1K but their accuracy is questionable. In principle the precision increases with more measurements, but the accuracy may still lack. To be fair, the concept of temperature sounds well-defined but in practice you measure it near a sunny and windy runway. Your results would be several degrees different in the nearby forest. So, what you need to do is adjust the forest’s cooling effect away. Using virtual temperatures the warming can well be seen. /sarc
I think you misunderstand. Precision and accuracy are two different things. A measuring device with a precision of +-0.1 will generate a circle around a given point with a radius of 0.1. It doesn’t matter whether you take 10, 100, 1000, or 1,000,000 measurements. You can kid yourself that the center of the circle is the actual measurement, but it is not. Any given measurement is only somewhere within the circle. Accuracy is a whole different animal. That circle of precision may give you a reading of 5 degrees +-0.1, but the actual temperature is 0 degrees. This means the accuracy sucks, while the precision is really pretty good. Regardless this paper describes the problems with not using proper measurement techniques.
After examining this over the years, I’ve came to the same conclusions as the author. A “global temperature” is a joke. It is someone’s idea that probably started out as a simplistic way of describing earth and the media blew it up, then government said, hey lets get involved too. I have never seen any definition of what it is in physical terms. If it is 75 degrees in Kansas, what should the temperature in Timbuctoo be? I know it takes a supercomputer to manipulate the data, but that is all it is, manipulation. There is no unique, defined way to actually say what a global temperature is. It can change upon someone’s whim as to how the data should be manipulated.
“””””….. 1Note: One cannot take a single measurement, add it to itself a hundred times, and then divide by 100 to claim an order of magnitude increase in precision. …..”””””
And one cannot take 100 totally separate events, and add them together, and divide by 100 and claim that as the AVERAGE event.
I can recall two explosions which took place among a whole raft of explosions that happened a long time ago in the Japanese Islands.
I suppose on average, those two really didn’t do much damage; on average.
Well tropical Storm Sandy over its lifetime, really didn’t do a whole lot of damage. It is only if you cherry pick that part of its existence when it was in the vicinity of the US East Coast, that it did anything much of note.
Different events are different, because they are supposed to be different; they are NOT anomalous occurrences of some cookie cutter event.
G
They need a lesson in significant figures!
Well climatists don’t deal in Temperatures; they only deal in anomalies.
Ergo, accuracy is not even a requirement; precision is sufficient.
You are only dealing in what the thermometer says today relative to the average of what it has read during some base period. The real Temperature could be 10% off and not bother the anomaly results much at all.
G
Unfortunately, the climastrologists are not working with precision either.
One instrument’s temperature records may have some precision.
The accuracy of that particular instrument is never validated or verified at any portion of diurnal, seasonal or solar cycles.
Nor does the NOAA perform any sort of measurement tracking comparisons or calibration, certification when replacing equipment, changing landscape, burning nearby, structures reflecting sunlight during diurnal or solar cycles, etc.
Isn’t amazing that NOAA presumes to advise governments while using instruments that are not regularly calibrated or certified in place?
Engineers in critical industries must send their measurement equipment in for calibration and recertification regularly.
Then to hide NOAA’s error recognition avoidance, NOAA happily accumulates all of the disparate unique temperature measurement devices into one gross temperature field.
None of the equipment installed is checked for accuracy or precision.
Aggregating multitudes of non calibrated or certified measurements yields sums of unknown value; without accuracy or known error bounds.
The old “Do not look a gift horse in the mouth” approach to quasi-science.
george e. smith on April 13, 2017 at 4:07 pm
Well climatists don’t deal in Temperatures; they only deal in anomalies.
Ergo, accuracy is not even a requirement; precision is sufficient.
You are only dealing in what the thermometer says today relative to the average of what it has read during some base period. The real Temperature could be 10% off and not bother the anomaly results much at all.
Are you sure?
1. Even UAH’s engineer-in-chief Roy Spencer publishes every month only anomaly-based temperature series. A science man like him wouldn’t like to call a ‘climatist’: that is imho too impolite. And above all, that does not at all mean UAH wouldn‘t store any absolute data!
2. NOAA conversely does not publish anomaly-based data for GHCN nor for the IGRA radiosonde network. All the stuff is absolute there.
3. You may at any time, as you certainly know, reconstruct absolute values out of anomalies: you just need to add the baseline’s absolute values to anomalies in order to obtain them ( a yearly average to yearly anomalies, a monthly average to monthly anomalies, etc etc).
You must of course ensure that
– you choose the correct reference or baseline to obtain the absolute values; getting absolute temperatures for the Southern Hemisphere on the base of a baseline computed for the Globe is of course nonsense;
– the uncertainty of the baseline value does not exceedingly differ from that of the anomaly it is added to.
4. What would be the sense of an anomaly-based storage e.g. of GHCN data? GHCN’s users (NOAA itself, GISTEMP) all have different baselines, what would mean for them the need to shift from GHCN’s baseline to the own one.
5. According to ISO 5725, accuracy denotes how close a measurement is to a true value, while precision is the closeness of agreement among a set of results. Thus accuracy hasn’t anything to do with either anomaly-based or absolute representation of what has been mesured. Accuracy is, what concerns temperature measurement, a matter of calibration.
6. Important when dealing with temperature series is the uncertainty of trend estimates, i.e. the deviation from the series‘ mean. And here its gets interesting because this deviation increases with the difference between minima and maxima in annual cycles.
Thus a trend estimate computed on the base of anomalies shows less deviation from the mean than it would be when absolute values are used.
BEST Globe land-only trend estimate 1880-2013
– using anomalies: 0.11 ± 0.02 °C / decade
– using absolute values: 0.11 ± 0.28 °C / decade
You see here that using absolute values, the standard error is more than twice the value to which it applies.
It gets even worse when you compare e.g. Antarctic temperatures or its sea ice extent in the same way.
7. Last not least, temperature series and their trend estimates aren’t used by computers only: we like or need to have a look at them.
Did you ever see a chart superposing for CONUS, the plots of
– the full rural GHCN stations
– all other ones
– UAH6.0 USA48 aka CONUS
using absolute data instead of anomalies wrt UAH’s baseline?
Having been involved with AWOS-3 calibration for a number of years (15+), I always thought it was unreasonable for anyone to use more than one digit right of the decimal for any use. Given that up to the late 1990s, our external standards were still analog thermometers and the potential bias of the reader judging the curve.
@ur momisugly Wyatt
And the literal fact is, that only a few dozen people are willing to publicly admit that the “near-surface air temperature data” that is stored somewhere in the “bowels” of the NWS and referred to as the “Historical Temperature Record”…… is of no value whatsoever to anyone anywhere other than ….. local, regional or national weather reporters/forecasters for the purpose of “appeasing their audiences” by citing the “date and location of record-breaking temperatures”.
Sorry, but this is mathematically wrong. The Law of Large Numbers explains how with enough trials, you can get to an arbitrary degree of precision.
Sure. But when you’re trying to measure the global temperature anomaly over, say, a year, then all those individual measurements add up. You have both spatial and temporal variations that largely wash out. (If you have a cold front today, it’ll probably warm up tomorrow. Or if it’s colder than average here, it’s generally warmer than average somewhere else.)
The claim that spatial and temporal variations wash out is a complete lie. They don’t. Spatial and temporal variations actually decrease the accuracy of your assumed readings, making the error bars bigger, not smaller.
Of course spatial and temporal variations will increase the error bars relative to the case where there are no variations. Yeah, sure, the temperature would be easier to measure consistently if it was literally the same everywhere at every time.
But measuring and averaging spatial and temporal variations still decreases the uncertainty. I.e., the uncertainty of a given day is going to be higher than the uncertainty of a given year. Local variation is higher than global variation. Etc.
Yes? You agree that annually-averaged variations are less than daily variations. The error bars are less for the former. They literally have to be, mathematically.
Not even close to being true.
Great, then show it. Should be easy, neh?
Take a sample of time-varying data, distributed however you like. I can show you that the standard deviation of the average will decrease as the length of the timespan you’re averaging over increases. Heck, it’s already shown; that’s what the Law of Large Numbers is.
Windchaser, I’ve already done that. Shown why what you seek to do is invalid.
Nah, you just said that it was invalid.
You need to mathematically back up your claim that spatial and temporal variations don’t “wash out”; that an averaged set of measurements over some time period doesn’t have a smaller standard deviation than individual measurements.
Spatial variations in temperature anomaly are actually anti- correlated, such that averaging them reduces the standard deviation faster than you’d expect from normally-distributed variations. And this makes sense, of course – often, one place being warmer than usual is offset by someplace else being cooler due to physical phenomena like weather fronts, the change of seasons, etc.
Windchasers,
A requirement for the use of the Law of Large Numbers is that the data be IID. We know that temperature data is not, so the LLN is not applicable.
No, the strong law of large numbers does not require independent and individually distributed samples. Not having IID just changes the rate of convergence; it doesn’t change the fact that convergence exists. So you use timespans or spatial lengths long enough that the correlation is low.
On Earth, the fact that spatial variations are anti-correlated increases the rate of convergence compared to the individual measurements. Again: you can demonstrate this mathematically.
*identically distributed, not individually distributed.
I said it was invalid and showed the reason for it.
Windchasers,
The LLN, both the weak and strong versions, assume that the data samples are IID. There are some special exceptions where identical distributions are not required, however the temperature data sets used in this case do not seem to meet the conditions of any of them. Perhaps you could elaborate on why you think they do. Also, in order to determine the effect of the non-identical distributions, you would need to first characterize all the distributions involved, which has not been done, and I don’t think can be done. In my opinion you are on very weak footing here, and if you are going to resort to special pleading, you had better have your facts (and data) lined up and well presented. Otherwise it’s just hand-waving and guessing.
“often, one place being warmer than usual is offset by someplace else being cooler”
That’s just garbage. With weather, cloud cover often cools large areas at the same time. Look at the power generation figures from wind power. Often large areas are left without any wind at all.
That could be true for heat content, but not for temperature.
You can argue that the total heat stored on Earth does not change (or that it changes stadily by changes in solar output, the amount of energy radiating out to space, etc…) that this energy is what is being transferred from one place to another and that you can calculate Earth heat content by measuring heat content in different places and averaging the result, so the more values you have, the better the precision.
But that is not true in case of temperature. A gram of ice at 0ºC has the same temperature as a gram of water at 0ºC but they do not have the same heat content. Same happens with air with low humidity and air at the same temperature but with high humidity. Same temperature but different heat content, different values for energy.
“often, one place being warmer than usual is offset by someplace else being cooler”
This is an assumption on your part. An actual review of the climate network showed that the vast majority of contaminations warmed the record.
PS, your assumption that one place would be warmer while another place colder would only be true if we had an adequate number of sensors distributed over the entire surface of the earth.
The fact that less than 5% of the world’s surface is adequately sensored and that 85% of the planet comes close enough to totally unsensored that the difference isn’t measurable, puts the lie to that claim.
The Law of Large Numbers works when one is taking multiple measurements of the same thing, such as a thousand measurements of the length of a board — or a thousand measurements of the temperature in a room. It doesn’t work if one takes a single measurement of a thousand different boards and then tries to claim one has the average length of “a board.” One can claim to have measured the average length of “a board,” but even so, since they are all different boards with one measurement each, one can’t use the multiple measurements to improve the precision. One has to use the precision of one measurement.
Not if you violate Identicality. The limiting factors to each measurement, as in the article, must be neglible with regards to the magnitiude and variation of the thing you are measuring. Otherwise you cannot apply large number processes such as CLT.
Windchasers,
I refer you back to the quote by Smirnoff (1961) regarding a need for variability to avoid redundancy. You don’t address the estimate of the standard deviation for global temperatures being 3 or 4 orders of magnitude greater than the precision commonly quoted.
The precision quoted is for individual thermometers. As long as you’re using more than one thermometer, the average global temperature anomaly has greater precision due to the Law of Large Numbers.
Basically: when you gather more data around the globe, you can get a more-precise estimate of the global temperature.
Windchasers- while you can measure temperatures anywhere you want global average air temperature is not a useful number no matter how accurate and precise the measurements are. Temperature is an intensive property. The climate is a heat engine and driven by energy differences- extensive properties. You can put buckets of water half filled with ice and a thermometer anywhere ond earth an measure some average temperature very close to 0degC. It won’t tell you anything at all about whether or not the ice in any or all of the buckets is melting.
Clyde is entirely right. The accuracy and extent of the temperature record is not nearly as accurate or useful as most presentations imply. Due to the way the record was developed and why have resulted in many attempts to “improve” the data with questionable, ham-handed corrections after the fact.
No!
Errors accumulate! Addition for large amounts of measurements from disparate unique temperature measurement devices that range from thermometer guessing up to badly installed modern platinum thermistors; not forgetting NOAA’s happy habits for data substitution in lieu of missing, corrupted or unacceptable data, is wrong!
One temperature instrument’s reading undergoes multiple stages from instrument to NOAA database.
Each stage introduces error possibilities.
Nothing in industry is manufactured without engineers thoroughly testing each stage for error rates. Unacceptable error rates force stage re-engineering. Low or transient errors are tolerated, but tracked.
NOAA has not performed accuracy or error analysis for any of their stages from instrument to presentation.
In Engineering, it is unacceptable to aggregate disparate measurements without rigorous verification.
I already mentioned engineers having to send in their measurement equipment regularly for calibration and recertification. Just as gasoline pumps have calibration/certification stickers dated and signed; so do weight scales throughout retail and industry, personal cars are inspected, as are elevators and many other important items in use.
NOAA has not performed equipment calibration or certification! The accuracy levels stated by NOAA are under laboratory conditions accuracy; not installed in a badly sited temperature measurement station.
One temperature station, without error determination, can generate approximate temperatures for one very small spot. Averages for that geographical spot are only viable when stated in diurnal and seasonal range of averages. Much as realtors use a general temperature graphic for their location area.
Pick any temperature station, hold a temperature monitor and walk the surrounding area and you will find a range of temperatures. The differences might be small, but they exist.
Assumption that one nice anomaly number can represent the globe is only valid when every point of surface through all altitudes is carefully measured, errors constrained or controlled, 360° by 360°.
NOAA’s anomaly approach is a joke in comparison; embarrassing in reality.
For amusement read ”NOAA’s Newsletter What’s in that MMTS beehive anyway”; I read not too long ago, another ocean based maintenance staff’s efforts to clear buoys of algae, barnacles, pelican and gull feces, etc.
Accurate or precise ocean or surface temperature averages? Yeah, right.
Nor do I understand that the “strong law of large numbers” works for data sets with negative numbers with large error variances or NOAA datum manipulations.
PS Windchasers:
I like most of your comments in this thread. My above response is the only quibble with your comments so far.
Philo: Excellent comment!
I especially agree with your praise for Clyde Spencer. (should we wonder about last names?)
Who would care if the numbers still need large adjustments for their uncertain biases?
Or the other way around, walking around a sunny day you spot hot and cold places, and then someone defines the temperature anomaly to a hundredth of a Kelvin using measurements from elsewhere in space and time, and a climate model. What good does that representation do? It tells nothing about your sunny day.
Windchasers: I think you are misinterpreting the law of large numbers and conflating it with statistical sampling methods. If I have measurements of some property of 100 samples taken from a population of 10,000 items, I might get an average of 50 and a Standard Deviation of 10. Assuming a normal distribution, there would be about 95 samples in the range of 30 to 70. But this data also allows me to estimate the likely mean of the population from which the sample was drawn. This is where we divide the sample SD by the square root of the number of samples, In this case the population mean is estimated at 50 +/- 2 @ur momisugly 95% confidence. (50 +/- 2 x SD/SQRT(N)). BUT, this is only applicable if the sample was drawn truly at random. i.e. every one of the 10,000 members of the population had an equal chance of being selected. There is simply no way of producing a representative random sample of global surface temperatures from the existing surfaces temperature record. Therefore, the fact that AGW alarmist use data sets which average millions of data points does not mean that they can legitimately claim to know the global average temperature with any high precision. The only system that has the potential to produce a valid measurement of a global temperature is by satellites designed for the purpose.
It can be argued that the data sets used and the annual averages can still be a reasonable indicator of long term trends. However, this would require that same instruments with the same accuracy in the same locations with the same surrounding conditions be maintained over the entire time span. The fact that this is not the case has been well documented. Thus we see the ongoing “adjustments” of the historical data to try and compensate for “known” biases (UHI, TOB, screen type, etc.).
I think Mr. Spencer has made a very sound argument and temperature data presented to more than one decimal is nonsense. In fact I think all such data should be considered no better than +/- 1 C. Oh, and the paleo data (ice cores, tree rings, etc.) has to be much worse.
Rick,
I am arguing that if one measures a parameter with a fixed value, then they are justified in quoting the Standard Error of the Mean (i.e. dividing the standard deviation by the SQRT of the number of samples). However, if what is being measured is something that is varying, and is used to construct an estimate of the central tendency of the measurements, then one must use the Standard Deviation as the estimate of the uncertainty, and it makes no sense to use significant figures much smaller than the SD.
Right – but what we’re doing here is taking individual measurements and using them to create a spatial and temporal average. The goal isn’t the individual measurements; the goal is the average.
The actual average temperature of the Earth’s surface at any given moment in time is a fixed number. But you have to take a lot of measurements from around the globe to calculate it. You could calculate it using only one sample, but you’d have very large uncertainty. More measurements == less uncertainty for the average.
The same also applies to the temporal average. If you were trying to calculate the monthly average of temperature where you are, and you only took temperatures one day, you’d have a high uncertainty. Take measurements once a week, and your uncertainty will be lower. Every minute, and your uncertainty will have come down quite a bit.
Clyde: Yes, I do understand your point. However, there are always at least three components to instrument measurement uncertainty – the standard error as you describe, 1/2 of the instrument resolution, and the stated uncertainty of the calibration reference. There are typically other sources of uncertainty such as drift, environmental effects, etc. The actual MU is the SQRT of the sum of the squares of these uncertainties.
I’ve used many types of temperature measurement systems for over 35 years in a laboratory setting and can say that temperature measurement in most cases with an MU of less than +/- 1 F (0.5 C) is challenging and expensive.
Windchaser, by taking lots of samples scattered over the whole earth, you are only narrowing one of the three possible sources of error. That being the sampling error.
Regardless, to get down an accuracy of 0.01C, you would first need sensors accurate to 0.01C and then you would need to put one sensor every 10 to 15 feet over the entire surface of the earth, including the oceans.
And that would be one measurement.
If you took another measurement a couple of minutes later, you could not average the first reading with the second, because you aren’t measuring the same thing. You are measuring the temperature a couple of minutes after the first reading and any rational person would expect the two numbers to be different.
For the LLN to apply, each measurement must be of the same thing.
+1!
MarkW:
I agree with most of your statement.
Each temperature station is one component of a multistage process resulting in a number posted into a database.
Each stage has a very real possibility of error that has never been measured, that I (we) have ever heard about.
Then there is the NOAA habit of manipulating recorded temperatures. Each manipulation is another stage that introduces errors.
e.g.: Courtesy “Quality control and improvement for multistage systems: A survey
JIANJUN SHI1,∗and SHIYU ZHOU2, April 2009”
Multistage process illustration
Well your law of large numbers presupposes that each of your trials is an observation of exactly the same “event”.
If you use a meter stick to measure the width of a ditch you just dug with a spade and shovel, you are unlikely to ever repeat the measurement you just made, so the precision does not necessarily increase indefinitely.
On the other hand, if your experiment consists of reading the number written down on a piece of paper, You can reasonably expect that given enough time you will read it and get the correct number.
G
Windchasers: Your chemistry professor would rightfully lambaste you for spouting drivel about the law of large numbers. It does NOT apply in this case. These are measured values. The degree of precision of a measured value is determined solely by the quality of the instrument used to take the measurement. When dealing with measured values, the only law that applies is the law of significant figures. The law of large numbers is completely irrelevant.
Louis you are correct about precision in an individual measurement. But when you begin to deal with large sets of measurements, specifically averages and the confidence intervals associated with large sets of numbers….. standard error applies as a function of standard deviation.
Only when you are measuring the same thing.
In this case you aren’t.
Most of the data sets contain temperature measurements, so they in fact are measuring the same thing.
Even you should be smart enough to realize that the temperature in LA is not the same thing as the temperature in Boston. They are two separate measurements of two separate points.
Windchasers:
This is a teachable moment on why climastrologists are full of crap:
They don’t follow the scientific method.
They don’t follow basic rules of mathematics regarding measured values.
They follow Michael Mann’s mantra: “If you can’t dazzle them with brilliance, baffle them with bullshit statistics”.
Then they tell you you’re too stupid to comprehend and follow their logic.
Oh Yeah!! +100!
I have read somewhere that the average temperature on the moon is minus 60ºC.
That uniform temperature in our atmosphere is at about 12km altitude.
12 x 9.8ºC/km gravitational lapse rate downwards gives 57.6ºC at the surface.
12 x 6.5ºC/km average reduced lapse rate by water vapour gives 18ºC at the surface.
there are numerous data handling practices……running an algorithm that retroactively changes past temperature data
In effect you will never know what the current temperature slope is….
I believe this was implied in your article, but I would like to expand on it.
If I use the same instrument to take the a measurement of thing three times, it is possible that the average of the three readings can be more accurate than any individual reading.
The proviso here is that I must be measuring the same thing, using the same instrument.
If I take a temperature measurement. Reset the thermometer, take another reading, Lather, rinse, repeat a couple of times. Assuming temperature is varying slowly enough that there is no measurable change between my readings, then provided all the other things mentioned in the article are true, then it can be argued that the average is more accurate than any individual measurement.
However if I take one reading today, another reading tomorrow, and yet another on the day after, even if I am using the same instrument, then averaging these readings does not improve accuracy because I’m not measuring the same thing anymore.
This is even more true if I’m taking temperature measurements of places that are hundreds of miles apart, each measurement using a different instrument.
The accuracy of a given temperature reading at a given time doesn’t improve, sure.
But taking more readings at more places and more times does improve the global temperature anomaly over a given time period.
That’s not correct. Taking more readings of different things does not improve the accuracy of any individual reading.
You can repeat that lie all you want, but it still remains a lie.
I agree. Read my post again.
The accuracy of the individual readings does not improve. The accuracy of the average does.
To rephrase, one is taking multiple measurements of different things, not multiple measurements of the same thing. Accuracy does not increase in that case.
That’s only true when certain conditions, as spelled out in the article are true.
None of those things are true when you attempt to average temperature readings taken hours to days apart and hundreds of miles from each other. It is also never true when not using the same instrument for each reading.
Windchasers,
You said, “But taking more readings at more places and more times does improve the global temperature anomaly over a given time period.” That is the assumption many make, but is exactly the point I’m contesting!
NO. Absolutely NOT. Your “method” is a fundamental violation of the prerequisites for applying the Law of Large Numbers. You clearly did not read the article, much less any of the references.
I read the article, why else would I be quoting from it to argue against it? O.o And I’ve got a couple of probability and statistics books on my bookshelf, so I don’t know why I’d need to look up the author’s textbooks. I mean, if he’s wrong, he’s wrong. The fact that he didn’t actually lay out any of his equations or show how the assumptions are mathematically violated should really give you pause.
The only prerequisite for the LLN is that there’s not a systematic bias. For temperature anomaly, this would mean a changing systematic bias (e.g., switching between bucket or engine intake measurements for sea surface), as non-changing systematic biases are discarded by the fact that you’re considering the anomaly, not the absolute temperature.
Any uncertainty in systematic bias will get carried through to the final result, and it’s appropriate that uncertainties around things like the change in sea surface methodology do get carried through to the final result.
But this post wasn’t even about that. The author specifically says so. He’s taking issue with something that can be resolved through the LLN; how the precision of individual instruments is carried through to the global average.
Meaning, even if there were no systematic biases, the author’s argument is still that you can’t take individual measurements and get a global average with a higher precision. And this is straight-up, 100% mathematically incorrect.
Yes, if there are systematic biases or if the defined variable is artificial or badly defined to some extent, the accuracy is questionable.
It’s like measuring my height in micrometers. Can’t be done sensibly. Mathematicians too often fall in the trap of thinking reality is simply reducible to numbers. Real numbers seldom represent reality well. Reals are a one-dimensional model of reality, but reality is not one-dimensional.
“””””….. The accuracy of the individual readings does not improve. The accuracy of the average does. …..”””””
Well sorry. The average is ALWAYS exact.
You cannot take the average, or any other statistical mathematical algorithmic result of variable quantities.
Statistics only works on exactly known finite real numbers; and then only on a finite number of such numbers. It is a purely mathematical result and it is always exact.
Where the discrepancies come in is in the assignment of a real finite exact number to an observation. That may be difficult to get exact.
Nothing in the universe pays any attention to an average; it has NO meaning other than to the statisticians, who originally defined what “average” is. You can not even observe an average if one should occur; you simply would never know it was average.
G
Go back and read the article again. Concentrate on the difference between accuracy and precision. I would advise you to think in terms of shooting a rifle at a target at 100 yards. Some sniper stuff on the internet will help explain. Come back and tell us what minutes of angle means in terms of precision. Then tell us what point of aim means in terms of accuracy.
Any given instrument has a certain accuracy and precision. Trying to average multiple instruments with their own accuracy/precision just doesn’t give you anything worthwhile. You have no way to judge if their inaccuracies add together or offset each other.
Not as NOAA and many other alleged world authorities pretend averages.
From my post above:
Unless every error rate is meticulously determined for every temperature station, for every stage that measurement undergoes; there is no accurate or precise average.
This before pointing out that allegedly temperatures are collected at the same exact time of day around the world. I seriously doubt that stations worldwide are accurately adjusted to Greenwich time before posting to databases.
The Law of Large numbers is useless when faced with error introductions on an infinite basis. Thanks to irregular temperature adjustments during every temperature aggregation run.
MarkW,
That is essentially what I was saying. We are not measuring the temperature of the Earth’s atmosphere, but instead, a varying parameter that is used to characterize a hypothetical construct that tells us something about what kind of temperatures were experienced historically. The average tells us the point about which measurements cluster, and the standard deviation tells us how much variability was experienced.
Like so much of climate science “hottest year on record” is a political construct reverberating in an echo chamber. Lay persons like myself, given reasonable information by those with more expertise can understand the limitations of the science. Popular media outlets never write stories about average temperature years or fewer dramatic weather events. AGW plays right into the need for sensationalized news to grab an audience. Unfortunately it is coming from folks wearing the mantle of the scientific method.
Combining sensationalized science with government is what we are hopefully disassembling in the US now.
“Like so much of climate science “hottest year on record” is a political construct”
Central Texas experienced the “hottest March” on record this year. In the newspaper article, the tone suggested “Climate Change is Coming to Get Us Sooner Than We Thought!” Funny thing, according to my Central Texas utility, whose bill has a graphic showing the average temp for the period, March was TWO degrees cooler than the same period of 2015. So, one station’s “hottest month ever” is not even true on a regional basis?
An excellent article Clyde. I agree with you about different instrumentation and different techniques. I remember from my physics at school that mercury is far more accurate than alcohol and has a wider useful range. When temperature ranges are being discussed though absolute measurement cannot be relevant from different sites with different types of thermometer. For instance if one thermometer is reading 2 degrees Celsius higher than the temperature actually is, then the range of temperature over several years is the only factor of any relevance. I assume that the satellite measurements though are correct and have shown no warming at all apart from during the last El Nino, which was widely predicted before the event due to its expected strength.
Another issue is that historical data only measured daily low and daily high temperatures.
Trying to calculate a daily average temperature from that is a fools errand.
Way back when, there was a saying going around that there was nobody more likely to be wrong about reality than a businessman who’d just discovered spreadsheets.
Same thing happened to science; “the computer must be right” mindset took over.
I don’t know how many computer “science” graduates I have dealt with where their coursework never touched on the complete difference between the words “precise” and “accurate.”
Writing Observer,
It is likely that most scientists, who are practicing today, were educated during a time when calculators and computers were used routinely, and they never learned about significant figures. I know that when I was teaching in the ’70s, the early-adopters of hand calculators typically reported answers in excess of 6 significant figures, when the problem I tasked them with only had three significant figures.
I was one of the last of my engineering class (late 70’s) to take junior level exams with a slide rule. I couldn’t afford a calculator. I would always note at the top of my test “SRA” for “slide rule accuracy”. It forced on me a consciousness of significant digits that I have never forgotten. I feel sorry for people like Windchaser who just don’t get it. Also annoyed, as their low-information vote cancels mine on election day.
It’s not that he doesn’t get it. It’s that he doesn’t want to get it.
This. I’ve been thinking lately that any STEM major should be required to possess three credits on “Use of the Slide Rule.”
(I still have my big steel rule – one contemplated woodworking project is to mount it in a nice glass front case someday. With a little hammer on a chain attached…)
My undergraduate background is in math & computational science, so I find that I generally have an easier time ‘getting it’ if people can put their claims in mathematical terms, with equations.
Similarly, I have difficulty helping people ‘get it’ if they have trouble with equations. Math isn’t meant to be done in common language; equations have a precision that words do not.
But there’s so little math and so much bad math logic in the OP that… yeah, I’m never going to “get it”. There’s nothing to get. It’s mathematically incorrect. I mean, look at the way he tries to ascertain the global annual average temperature anomaly from the range at a single point in the desert. You can’t do that unless you know something about the spatial correlations of temperatures, and he doesn’t address that missing premise. The logic is sloppy and the math unsound.
In contrast, if you pull up the methodology papers from any of the major organizations – NOAA, NASA, BEST – you can actually walk through the math yourself and check it. And I have.
Why would I trust hand-wavey explanations with bad logic behind them over the actual equations that I’ve checked?
Nice, an appeal to authority.
You must be right because those you view as authorities are using the same faulty logic.
Windy,
Yup, Mann, HadCRU, NOAA, NASA and BEST can lie with fake statistics, but the fr@uds they perpetrate show either that they don’t care or actually don’t know how to conduct valid statistical analysis. Or just do what they know they can get away with, since before Trump no one in government or the media would call them on their conspiracy, except Canadian statisticians whom they denigrated.
Windchasers,
You said, ” I mean, look at the way he tries to ascertain the global annual average temperature anomaly from the range at a single point in the desert.” I’m afraid that your reading comprehension is deficient! What I said was, “That is, the range in global temperatures should be approximately four times the standard deviation (Range ≈ ±4s). For Summer desert temperatures reaching about 130° F and Winter Antarctic temperatures reaching -120° F, that gives Earth an annual range in temperature of at least 250° F;…” I was using both desert temperatures and Antarctic temperatures (not just desert) to estimate the range, not anomalies. Therefore, you are disagreeing with something you clearly don’t comprehend.
There is an equation there, but I guess it is too simple for you to get involved with it.
Clyde, you cannot apply the “range rule” to temperatures on planet Earth. https://www.thoughtco.com/range-rule-for-standard-deviation-3126231 The spread of temps on Earth are not normally distributed, but are functionally related by geographical latitude (meaning the equator is generally warmer than the poles.) So your application of the range rule is invalid.
Thank you for this comment windchasers.
It saves everyone the hassle of contesting the things you assert point by point.
You have looked over the maths of the Warmista High Priesthood, and declared it to be Good.
I want to point out for the benefit of anyone reading this who may be on the fence about what to believe, that people who “adjust” the data points they use in their calculations are no longer engaging in science or in statistical analysis. There are other names for such a practice.
Lets look at the example of using a single die: What is the average of 1000 rolls of a die which, prior to be averaged, are “adjusted” to bring the individual rolls in compliance with what that single roll ought to have been. Never mind the particulars of the reasons for these adjustments or whether they are based on a preconceived bias or political agenda. Never mind that…just tell us what is the average of the rolls is when all of the early rolls are adjusted in a single direction, such that all of the rolls form a more or less smoothly ascending curve?
Sophistry sounds good, it sounds persuasive, although only to the uninformed and the gullible and those who are True Believers.
Of lies, damn lies, and statistics… who could think that the statistical sophistry of a bunch of charlatans is anything a serious person would want to waste their time considering?
Michael darby,
Mendenhall (1975) disagrees with you. The text offers the approach as a check on the calculation of SD. In fact, in the discussion of Tchebysheff’s Theorem, it says, “Tchebysheff’s Theorem applies to ANY set of measurements,…” Indeed, the theorem predicts that AT LEAST 93.8% of the samples will lie within +/- 4SD of the mean for ANY distribution. Note that I was being VERY conservative in the estimation of the SD because I don’t know what the distribution looks like. Had I used the more conventional R~4s instead of the R~8s my estimate for SD would have been 62 instead of 31! Either way, the point is that the SD by either approach is 4 or 5 orders of magnitude larger than the commonly cited precision of the mean.
Mendenhall’s Introduction to Probability and Statistics continues to be used as a standard text even today. I’m inclined to believe Mendenhall over you because I don’t know what book(s) you have had published and have had widely adopted as a standard statistics text. I also don’t recognize the author of the link you provided. I prefer not to appeal to authority, but when a lone “voice in the wilderness” contradicts a widely adopted text, I need a little more than just a ‘anonymous’ complaint (and link) that you disagree.
Clyde, you are wrong again when you say ” ANY distribution.” I’ll give you an example of a distribution that Chebyshev theorem does not apply to: https://en.wikipedia.org/wiki/Cauchy_distribution
PS Clyde, Chebyshev theorem applies to distributions of probability You ignored the fact that surface temperatures of the earth are not random, as they are highly dependent on (read function of) LATITUDE. The temps may vary within range, but that range is constrained by latitude. So you cannot apply the range rule in this situation.
Oh Gd! You’ve gone and reminded me! Those days were horrible, but fun.
I was pulled from the line because I had an education in computers and languages. That was immediately assumed to include spreadsheets and plotters; Lotus 1A and soon after Symphony plus some excursions into IBM’s TSO version of Calc were my bread and butter along with computer setup and repair.
All using the original IBM PC with metal woven wire chain attached optional auxiliary drive enclosure and 10MB hard drive. (I later connected the PC to the mainframe via dial up line).
Long before real IT positions existed with titles; part of my assignment was “teaching”.
So, I started some Lotus, Symphony and BASIC classes at work.
BASIC died on the vine. Such deer in headlights look everyone had. Especially since the teacher, me, was drilled in the never use ‘goto’ ever school of languages!
Symphony went fairly well since the Industrial Engineering department was officially working with Symphony. Only worker bees attended that class.
Lotus 1A was loved by all attendees. Only most of them didn’t understand. A concept that attending managers really didn’t get.
The safety manager came after me with a huge safety manual. He told me he wanted me to help him put the entire book into a spread sheet. In Lotus 1A? Yeah, good luck.
Next the Human Resources manager talked to me, about putting everything HR into a spreadsheet.
Then the maintenance manager.
I avoided managers for a few weeks.
These tales go right into the newbie files along with disk drive coffee holders and newbie serial disk destroyers. e.g. “I accidently formatted my C drive again, can you restore it for me?”.
I had one co-worker who “lost” floppy discs because he kept putting them into a narrow vent slot an inch above the disk drive. Every now and then, I had to dismantle his IBM XT to get out his special boot discs. I also tried inserting a floppy into that vent; it wasn’t easy.
Then there was the Finance department where I was actually assigned.
After I wrote a macro to split annual employee work hours into work weeks, I learned from Finance folks doing input to the mainframe that rounded numbers in a spreadsheet don’t add up properly in a mainframe.
It was a shame they didn’t mention that before doing all of the input; I could’ve written a formula to eliminate generic roundings. A formula I ended up using for years in other Finance departments.
While I loved working with spreadsheets, it did not take long before discovering there is no truly random function in either BASIC or spreadsheets. I started using the average of a series of random numbers; still not a random number, but better than the simple random function.
Then there were published errors early logic chips incurred when working with double numbers. I was amused, one allocates double functions to increase right of decimal accuracy, but mathematically the chip introduces errors.
Yes, I replicated some of PC’s magazine published matrices to verify chip abilities, then assigned PCs for only database or word processing (hello DBase and WordStar!).
Another memory; Few things are as irritating as a Wordstar expert being introduced to current Word Processing programs…
Should I mention where I arrived hours early, collected every calculator and locked them up? I returned one calculator because the user proved her one calculation only was easier and quicker with the calculator.
I’d never confiscate slide rules!
Writing Observer and D.J. Hawkins:
Any slide rule user was far faster and more accurate than any computer or computer user.
The computer’s value is for repetitive calculations. GE bought the first commercial computer to run payroll numbers.
My Father worked as a technician on Eniac; not as one of the main members. Dad was one of the electricians sent in to find and replace vacuum tubes after every run.
Till he passed, my Father preferred a slide rule to computers. With good reason too! Just prior to my getting reassigned to Finance, HP calculators sold for $350.
The IBM PC was $5000 without the auxiliary 10MB hard drive and enclosure.
Sun’s over the yardarm now, so I shall hoist my beer stein to a fellow veteran.
Ah, those were the days… But all I miss is the hair.
To make matters even murkier. Temperature is itself not a very good indicator of the energy of the point being measured. Averaging without consideration of the affects of moisture just makes the analysis of anomalies worse. There is an unstated uncertainty swallowed by the averaging.
When I do an energy balance around a steam plant, I absolutely do not average temperatures across a device. I will average the temperature readings of one point. I have to keep a running average of the actual instrument, our state equations have a tendency to blow up if I use the instantaneous readings. Thermodynamics is never violated, but latency can cause readings to not quite match reality. The calculations always pass through enthalpy before I get to an answer.
We aren’t dealing with superheated steam in the atmosphere, but that just makes it worse. The most challenging part of the analysis doesn’t occur in the superheated region. The most challenging is in the saturation region. Our atmosphere is almost entirely in the saturation region. Well. Expect for those vast stretches of country with winter temperature dropping way below zero…
Congratulations. I searched all the comments for the magic word, enthalpy, and your comment was the only one to include it. Temperature is an intensive property and cannot be averaged. Extensive properties like enthalpy can be averaged. A thorough analysis of the records would require including moisture content of the air associated with each temperature measurement so that enthalpies could be averaged.
Bingo!
Give us a break, Neil. To go over all of the things wrong with the current state of “consensus climate science,” (the total ignorance of enthalpy being just one of them) requires not a comment – not a blog post – but a book – better yet, a whole series of books. (Not marketing for anyone in particular, but the regular contributors here can fill a comfortable two bookshelves with their more extensive writings.)
Loved this! Great explanation of the absurdity in declaring a global temperature at all…let alone with the accuracy/precision they claim to have.
The article touched on the fact that the ground based temperature network only covers a few non-representative areas of the planet. The vast majority of the planet, close to 90% of it, is either totally uncovered, or covered inadequately.
This will also increase the error bars tremendously.
(Non-representative because most of the planet is covered by water, and most of the sensors are on land, beyond that, urban areas aren’t representative of land either.)
Also note that the Mecator projection for this map is deceiving. The land area of Africa is, in the word of the Donald, HUGE. Brazil and central S. America as well. The map actually under-empasises the lack of coverage. Also check out the UHI effect in USA and Siberian under-reporting of winter temps in USSR days to get more government money for heating oil. Not myths but well documented biases (see Wattsup and Heartland).
MarkW on April 12, 2017 at 9:36 am
Non-representative because most of the planet is covered by water, and most of the sensors are on land, beyond that, urban areas aren’t representative of land either.
This is the same mistake as Richard G. made.
Your are talking about land-only measurements you guess be used to estimate the rest. That is wrong.
The world average is built on a mix of land stations and sea surface measurements.
When we talk about sea surface measurements, are you talking air of water temperature. As for coverage how many of the grids has a stable place where they make the measurement from. Argo does not do it they float, never in the same place, surface ship measuring water well talk about variables, not the same place not the same depth, not the same ship. How do you get a number that makes and sense from that? Other than satellites we do not truly have a consistent measurement system of the earth atmosphere. The variables are enormous and they do not “average” out.
Bindidon
I simply posted a map from NOAA that speaks for itself about the ‘Land-Only’ data. Was that a mistake?
Please tell me, does the map show that Africa has uniform coverage? Canada? Brazil? Amazon basin? What is the average of a lot of nothing? How about Nothing plus Something? A Global Land-Only temperature average is ridiculous at best.
For reasons I covered elsewhere, trying to combine air temperature measurements with water temp measurements is an exercise in dishonesty.
MarkW on April 13, 2017 at 7:16 am
For reasons I covered elsewhere, trying to combine air temperature measurements with water temp measurements is an exercise in dishonesty.
Why don’t you give us a résumé of your “covering” ? So we could manage to see what probably is wrong in it.
Blind much?
Well done – this article goes to the heart of why I not only don’t believe the Alarmists, I don’t trust them – improper data claims. I learned this stuff as a chemistry student in high school and again as a first year chemistry student at university. The fact NASA and other supposedly scientific operations are willing to claim accuracy and precision that is laughable is damning.
I took every undergraduate-level chemistry class offered, and I agree with your sentiment 100%
How many nights in chem labs did we toil for hour after tedious hour, to get a single result and report it to the appropriate confidence interval?
The statistical flim-flammery used by warmistas would have gotten them a failing grade in every science class I ever took.
Ok, but what about the more important tiny data set argument?
http://www.maddogslair.com/blog/ok-but-what-about-the-more-important-tiny-data-set-argument
This is a good, if “inside baseball” argument, but the killer argument is that the data set is too small to be of use in determining the earths climate over time. This data set only goes back to about 1880, precisely the time the earth was exiting the Little Ice Age. A good comparison would be to take the Average Temperature of Detroit but then begin the data set at the end of September, and only take data through the end of February. The data might be skewed a bit cold, no? Of course it would, and only a charlatan or fool would take this tactic, but this is the tactic the global alarmist cabal has taken. They truncate the evidence to sometime around 1880, so the data shows a sharp climb. But this is expected since the Little Ice Age was the longest, and one of the three coldest temperature depressions during the Holocene. It is the Holocene Winter.
The average temperature over the totality of the Holocene is higher than it is today. The Earth is essentially still trying to climb back to average from this Holocene Winter.
http://www.maddogslair.com/blog/the-holocene-and-how-it-undermines-climate-fear-mongers-arguments
Mark Sherman
And the average of the Eemian, the previous interglacial, was even higher, if not indeed warmer than now for practically its entire 16,000 years.
I wonder. Why has there been no attention paid to the fact that we are in an interglacial period, during which it is expected that the climate will continue warming until it doesn’t; then back into another ice age.
I wonder. Why has there been no attention paid to the fact that we are in an interglacial period, during which it is expected that the climate will continue warming until it doesn’t; then back into another ice age.
For true climate accuracy and precision you would need at least two bristlecones.
Mr. Spencer thanks for your article. I’ve looked at information on meteorological thermometers and they typically say they are accurate to +/- 0.2 degree F. It is unreasonable to then say that the globe has warmed by 0.01 degrees if these thermometers are the ones being used. That means the thermometers would have to be accurate to +/- 0.005 degree F. Additionally, there can be reading and other errors.
Per the graphic in Ricard G.’s comment, it is perfectly obvious you can be as accurate and precise as you want, but until you are measuring the entire globe instead of pieces of it, accuracy/precision is all a very moot point.
With no recording instruments in the arctic/antarctic regions or out in the vast oceans or in the jungles of Brazil and Africa or Siberia or the Sahara (and on and on), all you can really do is just guess. Maybe guess to the hundredth of a degree.. but that is about it. Even Satellite temps are indirect readings.
Excellent article on explaining accuracy and precision, but garbage in/ garbage out and it just doesn’t matter.
Good article and good reasons for everybody to go back to school to refresh the basics. References are too old for this millennium, but ask (I have) a teacher of statistics how many using it could do it (or understand it) without punching a button on a computer. Compared to what some are averaging, T is accurate, oops, precise.
HDH,
I was relying on references that were readily available in my library — my old college texts. However, some facts don’t change with time. Unfortunately, new technology (i.e. computers) sometimes requires that some subjects be skipped to make time for new things. Therein lies the problem! The students don’t learn the fundamentals, and they don’t know what they don’t know.
When I went to college, EE’s had to take two classes in antenna design. I had chosen to concentrate on the digital side of things, and the odds of my ever having to design an antenna were low enough that I was willing to take the risk. 40 years later, I still haven’t designed an antenna and couldn’t even if I wanted to.
Perhaps the way to make more time is to put more thought into what truly is required and what should be optional.
When I went to Stevens it was notable for the very late declaration of your major if you were on the engineering track. I could be an EE, CE, ME, or ChE by declaring or shifting as late as second semester junior year. The admin and professors explained: “We have no idea what you might be doing 30 or 40 years into your career and what kind of technologies you might be dealing with. We want you to think of yourselves as engineers. Just engineers. With a little more training in one branch than the others, but above all, engineers, and capable of tackling any problem that might reasonably be assigned to the engineering sphere.” It’s been a very long time since I’ve been a chemical engineer, but I’m still an engineer.
D. J. Hawkins pril 12, 2017 at 11:06 am
Stevens?
Stevens Hoboken Institute of Technology?
The place up the street from Michelob importers?
Yes, I know; Stevens Institute of Technology. I had a close friend, Barry Lange, who attended Stevens, and he used the Stevens Hoboken description.
We visited him a few times. Great place!
precisely
MarkW if you ever had to design digital circuit layouts for very high speed electronics that antenna design course would have been very helpful. 1ns rise and fall times make for many noisy antennae on the board if you don’t pay attention.
I switched over to the dark side, programming back when clock frequencies were still about 6 MHz.
Even then, when we laid out circuits, we had to be careful to make sure that no two lines ran for long lengths parallel to each other, to prevent what we at the time called crosstalk.
Exactly.
“The students don’t learn the fundamentals, and they don’t know what they don’t know.”
I agree completely.
I always thought that if one knew the fundamentals one could solve practically any problem. Of course there are exceptions, but today specialization has left many graduates without these skills. I find Mechanical Engineers that can do a Finite Element Analysis on a structure, but make errors on boundary conditions or properly interpreting the results since they were never taught the fundamentals.
“In general, modern temperature-measuring devices are required to be able to provide a temperature accurate to about ±1.0° F (0.56° C) at its reference temperature, and not be in error by more than ±2.0° F (1.1° C) over their operational range.”
______________
Do you have a reference for this please?
DWR54,
That was summarized from the link I provided above your quote. I added the conversions to deg. C.
I have read claims that “global temperatures are increasing”,
whereas what I thought was actually being claimed was that
mean temperatures are increasing, which is different. After all,
if night-times are less cold than before then this will result in
an increase in the mean temperature.
Or, by way of example, of the two temperature ranges 10-20
and 12-19, the former has the higher maximum temperature
and the latter the higher mean.
Further I have serious doubts that temps in some places can
be properly area-weighted … take ‘my place’ for example, New
Zealand, in which I hazard that homogeneity of temperature
cannot be guaranteed for more than a few kilometres from the
point of measurement.
I thought of one way you could derive an area-weighted mean
(for any point in time), and it came out as
( T1*A1) + (T2*A2) ….. + (Tn*An )
——————————————-
( A1 + A2 ….. + An )
where T1 etc were temperatures at n measuring stations,
and A1, A2 etc were the areas “represented by” each station.
Doesn’t work in NZ because we simply don’t know the areas
in question (without a lot of pre-judgements and arbitrary
decisions)
As for: mean = (min + max) / 2
forget it. This is risible, because it assumes an even progression
from one extreme to the other, which assumption is not warranted
if all you know is the Min and the Max.
Rex,
Perhaps you didn’t see my previous article on examining the BEST data set: http://wattsupwiththat.com/2015/08/11/an-analysis-of-best-data-for-the-question-is-earth-warming-or-cooling/
It is clear that the major early warming,as captured in the mean,was a result of the low temperatures increasing more rapidly than the high temperatures. I suspect that there are different drivers for the changes in the low and high temperatures, and only reporting an average of the two hides that.
What doesn’t get addressed in stating an “average” surface temperature is the elevation that the temperature is appropriate for. Does it make sense to say that the average temperature is known to the hundredths or thousandths of a degree if the elevation isn’t specified? That is another reason I believe that the standard deviation has to be taken as the uncertainty.
Brilliant… I wanted to highlight this point too. Well said sir. Clear as Day vs night.
Preposterous. This procedure alone introduces an almost two third centigrade wiggle into the data stream.
…and since 5 is always rounded up…it has a built in warm bias
Latitude,
l don’t agree with you. However, the point is that the averages rounded to 1 deg F should be converted to the equivalent C temp, with 1 significant figure.
Re accuracy and precision: As far as trends go, it can be said that for periods exceeding 15 years the upper 95% error margins of the LTS satellite data trends all fall within the ‘best estimate’ range of the surface data.
The opposite is not the case. That is, the lower 95% error margins of the surface data all still point to warming, making the warming ‘statistically significant’.
Folks who question the reliability of global temperature data should be aware that by far the biggest uncertainty levels are associated with the satellite data, not the surface data.
DWR54,
I’m not arguing that the temperatures aren’t increasing. I’m arguing that the claims for the magnitude and precision of the increases are not supportable.
After a truly excellent article, many comments destructing global average temperature horrifying methods, terrible accuracy, bad precision and laughable error rates?
That makes it obvious that you did not read most of the comments.
Why did you pass so many over? Was it the logic? Perhaps it is the numbers?
Then you question the satellite data?
Truly absurd and quite sad!