Guest essay by David Archibald
Our divination of solar parameters is aimed to elucidating two things – the length of Solar Cycle 24 and the amplitude of Solar Cycle 25.

Figure 1: F10.7 Flux from 2014
The F10.7 flux was exhibiting high volatility up to the beginning of 2015 after which it entered a disciplined decline in activity to late 2016. Now it is not far above the activity floor of 64 with three years of the solar cycle to go.

Figure 2: Solar Cycle 24 progression relative to Solar Cycles 19 to 23
For the last couple of years Solar Cycle 24 has been bumping along the lower bound of activity for the cycles for which we have F10.7 data, but with much lower volatility. From here it looks like Solar Cycle 24 will have a long, flat tail until minimum.

Figure 3: Interplanetary Magnetic Field 1966 to 2017
Combined with the solar wind flow pressure, the magnetic field coming out of the Sun is what pushes galactic cosmic rays away from the inner planets of the solar system. Activity in Solar Cycle 24 was backloaded but is now down to levels of previous solar minima.

Figure 4: Oulu Neutron Count 1964 – 2017
The neutron flux, caused by galactic cosmic rays hitting oxygen and nitrogen atoms in the atmosphere, causes changes in cloudiness by providing nucleation sites for cloud droplets. Changes in cloud cover in turn cause change in the Earth’s albedo, perhaps the largest driver of climate. The neutron count is climbing fast now that the peak in the interplanetary magnetic field (and Ap Index and solar wind flow pressure) has passed.

Figure 5: Solar Cycles aligned in month of solar minimum
Solar Cycle 24 is the cycle in blue at the top of the figure. It is three years ahead of Solar Cycle 23 at the same level of neutron flux. It also looks like it will have a higher count than Solar Cycle 20 which caused the 1970s cooling period.

Figure 6: Circum-Arctic oceans temperatures 2004 to 2017
The Climate4you site carries a graphic of circum-Arctic ocean temperatures from the surface to 1,900 metres using Argo data. What is interesting is that the water depth slice from from 200 metres to 1,500 metres is showing a strong and consistent cooling trend from 2012. The slice from 400 metres to 1,200 metres is shown above. The temperature decline at 1,000 metres has been 0.1°C per year from 2012.

Figure 7: Solar Polar Magnetic Field Strength by Solar Cycle and aligned on solar minimum
Solar polar magnetic field strength at solar minimum is the best indication of the amplitude of the following solar cycle. With an amplitude similar to that of Solar Cycle 23 at the same stage, it looked like Solar Cycle 25 might be just a little weaker than 24. It is still too early to tell.
David Archibald is the author of American Gripen: The Solution to the F-35 Nightmare.
The moment of truth is coming and I am confident that I will be correct along with others that have the same general opinions as myself . The evidence is strong in the historical climatic record which supports solar/climate connections and not co2 /climate connections.
Salvatore del Prete March 19, 2017 at 2:00 pm
Well goody for you. Unfortunately, the moment of truth has come and gone, you just didn’t notice. The sun has been at historical low levels and the global mean surface temperatures have been at historical high levels for a decade or so. Like most solar cyclomaniacs, however, actual observations seem to mean nothing to you unless they agree with your theories …
Regards,
w.
I seem to recall that Salvatore was saying that solar behaviour did not yet satisfy his parameters for a cooling world.
However, if solar activity drops further then it would satisfy his requirements.
Cycle 24 has stabilised the situation but we need a quiet cycle 25 to induce cooling.
REALLY WILLIS
Exactly Stephen . They do not pay attention.
What Willis said.
Stephen Wilde
March 19, 2017 at 3:42 pm
I seem to recall that Salvatore was saying that solar behaviour did not yet satisfy his parameters for a cooling world.
However, if solar activity drops further then it would satisfy his requirements.
Cycle 24 has stabilised the situation but we need a quiet cycle 25 to induce cooling.”
————
Is only a 50-50 outcome, either cooling or warming…….Salvatore is banging his chips in a worse than throwing the coin or a crystal ball……because up to the present the evidence has no any means to support his claims…….that mostly happen to be based in only a shaking conjecture…..
thanks
cheers
I do not rule out anything happening with the Sun and Earths climate in the next decade or so I am open to being surprised maybe even this
http://www.dailymail.co.uk/sciencetech/article-3156594/Is-mini-ICE-AGE-way-Scientists-warn-sun-sleep-2020-cause-temperatures-plummet.html
There are true experts in atmospheric physics, such as John Dutton, Richard Goody, Richard Lindzen, et al. Regrettably, unlike pretenders, they almost never comment here.
Leif (Svalgaard), my profound thanks for your knowledgeable and topical comments here at WUWT. It’s hilarious to watch the usual suspects try again and again to sell their usual solar cyclomania, only to crash into actual reality backed up by your endless cites and supporting evidence.
Your patience with fools and wannabes is an example to all of us, and is particularly a good example for me. I tend not to suffer fools gladly, so it’s good to see that it can actually be done with a light heart and a good spirit. I’m working on it.
Live long and prosper, my friend …
w.
Fools can be very ingenious. Murphy’s third law.
Leif,
You are so right on that account -but maybe not the way you had in mind.
The “climate establishment” – all those in academe, politics, the MSM, assorted green organizations, etc., who chose to get onto the now 25 year old career enhancing CAGW/CACC gravy train – are either intellectually dishonest or scientifically illiterate fools, but ingenious fools for sure.
I don’t know that Murphy has a law for this, but in the Faustian bargain the devil is always paid his dues in the end…
ingenious fools for sure
There are these of every stripe and persuasion.
Leif
Some naive questions for you. Given the solar cycle is well established, and is approximately 11 years long, If I’ve understood you correctly, you can’t make an accurate prediction of the next cycle until you’ve halfway through the current cycle. Is there is a measure of ‘fitting’ to complement the physics going forward in such a prediction?
If one considers a concept such as Lyapunov time, how far forward can we be sure that the sun maintains this 11 year cycle? Likewise how far back in time do you think it displayed this time signature? Could the Maunder minimum have been predicted ahead of 1/2 the current cycle you currently hint at?
For reference, here’s a link to Lyapunov time
https://en.wikipedia.org/wiki/Lyapunov_time
you can’t make an accurate prediction of the next cycle until you’ve halfway through the current cycle
The reason is that the next cycle depends on the solar polar fields near the end of the current cycle. Those polar fields are formed by a rather random process that transports magnetic fields from decaying sunspots towards the poles. It only takes a handful of [large] sunspots to make their way to the poles to reverse and rebuild the field to seed the next cycle. And with only a few, statistics doesn’t work. You can easily by chance get 4 heads in a row when tossing a coin.
http://www.leif.org/research/Prediction-of-Solar-Cycles.pdf
I have listed solar parameters that need to be reached and sustained before solar will have a climatic impact .
It has not happened yet although finally it seems to be in the process of happening now.
Thus the moment of truth is probably arriving and I am very confident those who embrace solar /climate relationships will be proven correct.
I happen to think Leif is and always was off base with his understanding, if you can call it that, of the sun-earth temperature relationship, and today he’s more charged up about that than usual. I guess he must be feeling desperate now that more and more people are waking up to the reality about the solar control of the weather and climate, and by god, he just can’t have that! Someone has to stop that insurrection right!?
In my opinion he is misleading this audience and always has on this matter, for example earlier today, here
https://wattsupwiththat.com/2017/03/19/solar-update-march-2017-still-slumping/#comment-2454938
He said “the high count at the last minimum [2008] occurred during the highest temperatures evah…”
The temperatures in 2008 were not the highest temperatures evah up to 2008. That was wrong!
Leif’s comments were not factual, but misleading, like him saying the sun doesn’t cause climate change!
Of course he’s entitled to have an opinion, just as you’re entitled to hear the other side.
Climate change occurs when solar activity is sufficiently high or low for 2 or 3 cycles.
The sun caused 20th century ‘global warming’ by being more active for far more than just 2 or 3 solar cycles. Solar variability caused climate change in our lifetimes!
The sun was 65% more active with href=http://www.sidc.be/silso/DATA/SN_y_tot_V2.0.txt>sunspots for the 70 years from 1935-2004 than for the previous 70 years from 1865-1934, 108.5 vs 65.8 per annum, respectively
The earth warmed up because the sun put out more energy overall for a long time, decades overall, heat that is slowly slipping away as the sun quiets down.
You’ll never hear that truth from Leif Svalgaard.
He said “the high count at the last minimum [2008] occurred during the highest temperatures evah…”
The temperatures in 2008 were not the highest temperatures evah up to 2008. That was wrong!
No, during the last minimum temperatures were higher than at every minimum before that.
Solar activity has not been usually high [unless you hunt for and cherry-pick times when it was]:
http://www.sidc.be/silso/IMAGES/GRAPHICS/wolfaml2.png
The earth warmed up because the sun put out more energy overall for a long time, decades overall, heat that is slowly slipping away as the sun quiets down.
Very likely it did not. Here is our best reconstruction [the red curve in the top panel] of the energy the Sun has put out the last 400 years:
http://www.leif.org/research/TSI-recon6.png
You graphs prove my point very well thank you. The sun was more active during modern times.
I think the real problem Leif is you don’t understand what’s going on ie how the sun’s variation changes the climate, and since you don’t understand it, you are sure no one can either.
In fact I would say that attitude is prevalent in a few more in residence today.
You graphs prove my point very well thank you. The sun was more active during modern times.
Well, you have fooled yourself, but few others will fall for that.
Leif here is a repeat of part of an earlier comment
The longer term connection is more important . The trend of solar activity as it effects climate is best illustrated on the Lockwood Open Solar Flux and Usoskin CR modulation data at PPT slide at 48 http://www.leif.org/research/w6yx-Talk.pdf
For discussion purposes the most useful temperature time series for comparing these with solar activity is seen in Fig 5 at Christiansen B and Ljungqvist FC. Clim Past 2012; 8: 765–786,
http://www.clim-past.net/8/765/2012/
( Fig 3 at )
http://climatesense-norpag.blogspot.com/2017/02/the-coming-cooling-usefully-accurate_17.html
The Lundquist time series time seem to generally match the solar activity trends of Lockwood and Usoskin.
IMHO
The trend of solar activity as it effects climate is best illustrated on the Lockwood Open Solar Flux and Usoskin CR modulation data at PPT slide at 48 http://www.leif.org/research/w6yx-Talk.pdf
They show no trend since AD1700, so do not match the climate record. So you are correct: they illustrate best the lack of a solar influence on climate. Good that you have seen the light [finally]. Don’t forget to put that insight on your webpage in a prominent place.
Leif I invite readers to look at the time series I referred to and judge for themselves.
If you believe there are no trends since 1700 there is little point in further discussion
No trends:
http://www.leif.org/research/No-Trend-OSF-GCR-GN.png
The varitions are limited to the red boxes shown. They do not support the notion of a long-term trend.
As you say: no need for further discussion. The facts are clear.
The claim that “there is no slowly varying background [in TSI] acting as a climate forcing” is sustained by little more than naive visual impression. In fact, there’s a clear propensity for the waxing and waning (i.e., grouping) of the magnitude of the 11-yr cycle, corresponding roughly to the multi-decadal oscillations of temperature observed at vetted station records of long duration. Such signal-envelope behavior, along with the results of proper spectrum analysis (NOT just simplistic periodograms), is quite suggestive of SUBHARMONIC response of a strongly nonlinear system. Sadly, such well-known dynamic response (see, e.g., http://www.sciencedirect.com/science/article/pii/S0022460X0900491X) seems to be no less terra incognita to solar physicists than to “climate scientists,” reminiscent in their certitude of the philosophical limitations of Shakespeare’s Horatio!
No, that is not the way the ‘background’ was originally determined. It was thought 20 years ago that there were a lot of small magnetic regions [without visible sunspots] called ‘ephemeral regions’ and that their number varied with the size of the sunspot cycle [more precisely with the 11-year running mean of the sunspot number], such that a large cycle had a lot of those regions throughout the cycle, hence would give rise to a slowly varying background, on top of which the sunspot-related variation would ‘ride’. Later observations have shown that this assumption was false and that there therefore is no background. We also see this in the constancy of the EUV flux at every minimum. The Ephemeral Regions should give a variable contribution to the EUV flux, and none is found.
So, the issue here is one of physics and observation, not of non-linear signal-envelope behavior.
Leif, earlier you did not say “No, during the last minimum temperatures were higher than at every minimum before that.”
You did not say higher than at every minimum before that. before. Lame CYA.
“Solar activity has not been usually high [unless you hunt for and cherry-pick times when it was]:”
This is also a very dangerously misleading statement because what you seek to do to the reader is prevent them from analyzing the more recent higher solar activity cycles by pre-programming a negative connotation towards analyzing and understanding any selection of time other than your cherry-pick!
I contend no one can understand climate change vis vis solar activity without looking at short terms too.
The very most important thing for people to understand, that recent high solar cycles were responsible for the recent warming, is the very thing that you continually attempt to prevent!
You did not say higher than at every minimum before that. before. Lame CYA.
Climate is the average of many years and solar minima are representative of low solar activity so the comparison is apt.
that recent high solar cycles were responsible for the recent warming, is the very thing that you continually attempt to prevent!
I think the Sun itself is doing a good job at that.
Javier
I have long regarded Milankovitch as a rule based-system having realised that simply looking at the long squiggly solar insolation line gets one nowhere. Trouble is I couldn’t figure out the rules. Thanks to you I can now say.
Rule 1. Interglacials end when obliquity begins its decline.
Rule 2. Interglacials begin when …
Since you have cracked rule 1 any ideas on rule 2? Obviously obliquity is part of it but not the whole story. My thinking is that probably more than one condition needs to be in place. It probably is, but need not necessarily be, in Milankovitch itself. Volcanic eruption, asteroid strike, Donald Trump in the Whitehouse …
Your move!
Michael, sorry for getting to you this late. If you answer to one of my posts, WordPress tells me about it.
Rule 2 Interglacials begin when … used to be when obliquity is high enough during the Early Pleistocene for over 2 million years. Occam’s razor is a good guide that the explanation for the Early Pleistocene should be still valid for the Late Pleistocene. Obliquity is still the main factor, but no longer sufficient. It requires help.
That help can be:
1. High eccentricity. When eccentricity is very high, every 400,000 years, every obliquity cycle gets an interglacial.
2. High precession. When northern summer insolation gets very high due to precession, at a time when obliquity has been rising for a few thousand years an interglacial is triggered.
3. A time dependent accumulation of ice-sheet instability. “over time, the glacial system accumulates instability that makes ice sheets more sensitive to insolation increases. This instability can be due to any of the following negative feedbacks on ice growth: (i) mechanical instabilities of the ice–bedrock system, enhanced calving and exposure to lower-latitude insolation as ice sheets grow; (ii) a decrease in ice-sheet albedo and an increase in ablation as a result of higher rates of dust deposition as ice sheets expand; and (iii) releases of deep-ocean CO2 as a function of extension of the Antarctic ice sheet over continental shelves” (Tzedakis et al., 2017)
So after an interglacial has taken place, unless there is high eccentricity or coincident high precession the next obliquity period is skipped. Usually the second obliquity period gets an interglacial due to a combination of 2 and 3. MIS3 50,000 years ago was an exception. It should have had an interglacial, but precession was too low at the time window. This is explained very well in Tzedakis et al., 2017, but I had already worked it out from the data before it was published.
http://i.imgur.com/rZGm1iu.png
Green circles trigger interglacials. Red circles favor interglacials. Blue circles hinder interglacials.
https://judithcurry.com/2016/10/24/nature-unbound-i-the-glacial-cycle/
Tzedakis, P. C., et al. “A simple rule to determine which insolation cycles lead to interglacials.” Nature 542.7642 (2017): 427-432.
https://dl.dropboxusercontent.com/u/75831381/tZEDAKIS%20Simple%20rule%20for%20interglacial%20timing.pdf
Thank you for your detailed response Javier, makes perfect sense to me. I would expect high eccentricity to trigger interglacials due to tidal forces and mechanical stress on sea ice sheets and possibly even land if there was a layer of water (lake) underneath.
Irregular heartbeat of the Sun driven by double dynamo
Last Updated on Thursday, 09 July 2015 12:41
Published on Thursday, 09 July 2015 08:17
Zharkova small
Montage of images of solar activity between August 1991 and September 2001. Credit: Yohkoh/ISAS/Lockheed-Martin/NAOJ/U. Tokyo/NASA. Click for a full-size image
A new model of the Sun’s solar cycle is producing unprecedentedly accurate predictions of irregularities within the Sun’s 11-year heartbeat. The model draws on dynamo effects in two layers of the Sun, one close to the surface and one deep within its convection zone. Predictions from the model suggest that solar activity will fall by 60 per cent during the 2030s to conditions last seen during the ‘mini ice age’ that began in 1645. Results will be presented today by Prof Valentina Zharkova at the National Astronomy Meeting in Llandudno.
It is 172 years since a scientist first spotted that the Sun’s activity varies over a cycle lasting around 10 to 12 years. But every cycle is a little different and none of the models of causes to date have fully explained fluctuations. Many solar physicists have put the cause of the solar cycle down to a dynamo caused by convecting fluid deep within the Sun. Now, Zharkova and her colleagues have found that adding a second dynamo, close to the surface, completes the picture with surprising accuracy.
“We found magnetic wave components appearing in pairs, originating in two different layers in the Sun’s interior. They both have a frequency of approximately 11 years, although this frequency is slightly different, and they are offset in time. Over the cycle, the waves fluctuate between the northern and southern hemispheres of the Sun. Combining both waves together and comparing to real data for the current solar cycle, we found that our predictions showed an accuracy of 97%,” said Zharkova.
Zharkova and her colleagues derived their model using a technique called ‘principal component analysis’ of the magnetic field observations from the Wilcox Solar Observatory in California. They examined three solar cycles-worth of magnetic field activity, covering the period from 1976-2008. In addition, they compared their predictions to average sunspot numbers, another strong marker of solar activity. All the predictions and observations were closely matched.
Looking ahead to the next solar cycles, the model predicts that the pair of waves become increasingly offset during Cycle 25, which peaks in 2022. During Cycle 26, which covers the decade from 2030-2040, the two waves will become exactly out of synch and this will cause a significant reduction in solar activity.
“In cycle 26, the two waves exactly mirror each other – peaking at the same time but in opposite hemispheres of the Sun. Their interaction will be disruptive, or they will nearly cancel each other. We predict that this will lead to the properties of a ‘Maunder minimum’,” said Zharkova. “Effectively, when the waves are approximately in phase, they can show strong interaction, or resonance, and we have strong solar activity. When they are out of phase, we have solar minimums. When there is full phase separation, we have the conditions last seen during the Maunder minimum, 370 years ago.”
In cycle 26, the two waves exactly mirror each other – peaking at the same time but in opposite hemispheres of the Sun.
That paper has been debunked several times.
Leif is wrongly convinced that he is right. Live and learn as they say.
When comparing minima and maxima it is necessary to know where earth is relative to the trends in the major 60 and 1000 year cycles. The latest peak in the millennial temperature cycle was at about 2003/4 in the RSS data.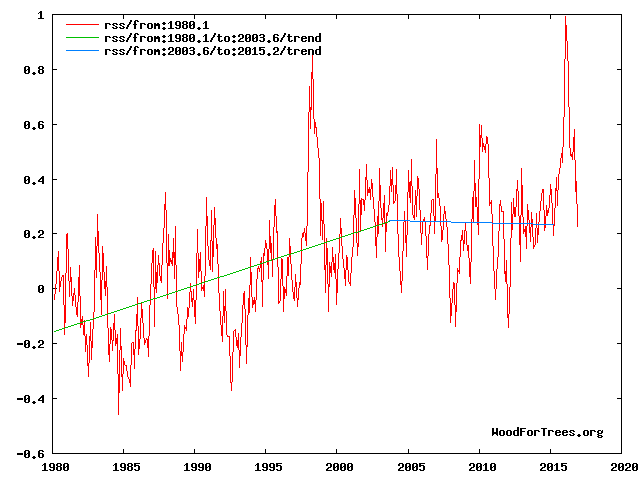
For future trends see

Fig. 12. Comparative Temperature Forecasts to 2100.
Fig. 12 compares the IPCC forecast with the Akasofu (31) forecast (red harmonic) and with the simple and most reasonable working hypothesis of this paper (green line) that the “Golden Spike” temperature peak at about 2004 is the most recent peak in the millennial cycle. Akasofu forecasts a further temperature increase to 2100 to be 0.5°C ± 0.2C, rather than 4.0 C +/- 2.0C predicted by the IPCC. but this interpretation ignores the Millennial inflexion point at 2004. Fig. 12 shows that the well documented 60-year temperature cycle coincidentally also peaks at about 2004.Looking at the shorter 60+/- year wavelength modulation of the millennial trend, the most straightforward hypothesis is that the cooling trends from 2004 forward will simply be a mirror image of the recent rising trends. This is illustrated by the green curve in Fig. 12, which shows cooling until 2038, slight warming to 2073 and then cooling to the end of the century, by which time almost all of the 20th century warming will have been reversed
The green curve is already wrong. The has been no cooling since your purported maximum in 2004.
You, nor nobody, know what’s going on in the oceans.
==============
but we know a failed prediction when we see one, don’t we?
See Blue trend in RSS time series above
“The RSS cooling trend in Fig. 4 and the Hadcrut4gl cooling in Fig. 5 were truncated at 2015.3 and 2014.2, respectively, because it makes no sense to start or end the analysis of a time series in the middle of major ENSO events which create ephemeral deviations from the longer term trends. By the end of August 2016, the strong El Nino temperature anomaly had declined rapidly. The cooling trend is likely to be fully restored by the end of 2019.”
From http://climatesense-norpag.blogspot.com/2017/02/the-coming-cooling-usefully-accurate_17.html
“From Figures 3 and 4 the period of the latest Millennial cycle is from 990 to 2004 – 1,014 years. This is remarkably consistent with the 1,024-year periodicity seen in the solar activity wavelet analysis in Fig. 4 from Steinhilber et al 2012 (16).Fairbridge and Sanders 1987 (17) p 452 provide the commensurability relationships of planetary and lap periodicities as a basis for future analysis of the sun-climate connection. Their reported Uranus Saturn Jupiter Lap time periodicity of 953 years is pertinent. here. Scafetta 2013 (18) compares the GCMs with a semi-empirical harmonic climate model based chiefly on astronomical oscillations. The model is constructed from six astronomically deduced harmonics with periods of 9.1, 10.4, 20, 60, 115 and 983 years. Scafetta’s abstract also states: “In particular, from 2000 to 2013.5 a Global Surface Temperature plateau is observed while the GCMs predicted a warming rate of about 2 C/century. In contrast, the hypothesis that the climate is regulated by specific natural oscillations more accurately fits the GST records at multiple time scales.”
See RSS at post at 5:22 pm above
No, show it here again. Don’t let me waste my time by having to hunt for it.
Leif, it’s only a short scroll up, and you are wasting time and confusing the dialogue with placing comments out of chronological order.
==============
I don’t. WordPress may do. I simply click on Reply in the Notification I get.
Forgive me if it is not deliberate, but others can’t do that.
===============
makes no sense. Try again.
Clicking on reply places a comment in chronological order. Your comments are often out of chronological order. It seems deliberate because you often place a comment directly after one to which you are responding. Frankly, sometimes it improves dialogue, but you have been doing this for a long time.
================
I am a lazy person. I [almost] always just click on the reply icon, anything else is extra work.
Perhaps your display shows a reply button deeper in the branch than does mine.
==============
But why no new twig with your achronological comments?
=========================
Why didn’t someone warn me to get some popcorn before I started reading this thread.
Sheesh.
It’s poppin’ fresh. Can we at least agree that the vasty deep is blowing smoke in many eyes?
========
I have a lot of faith in Leif and Willis, but their certainty is disconcerting.
============================
And the certainty displayed by the other usual suspects is not disconcerting?
Oh, sure, Leif. Much disconsertion.
========
Well, express it for all to see.
Heh, inventing words isn’t enough expression for you? I’ll have to try harder.
==========
<iI’ll have to try harder
Precision in words often show precision in thought, and similarly for lack thereof.
Ah, yes, were I to precisely understand all this I could most precisely express. Your precision with words, and your deep understanding, helps you mask what you don’t understand, which, I’ll bet you’d agree, is a lot.
=====================
being vague and wishy-washy helps even more in that regard.
It’s maddening, my uncertainty, ain’t it?
==========
No, Wittgenstein said it best: Wovon man nicht sprechen kann, darüber muss man schweigen
[Whereof one can not speak, thereof one must be silent. .mod]
Wittgenstein, with his fine sounding but autocratic aphorism, would shush the formation of hypotheses.
===================
And I agree with Javier that if there is a sun/climate connection it is on a millennial or longer scale. On this, Leif does display a little uncertainty, and Willis is wisely silent.
================
A hallmark of good science is the ability to predict. Shoving solar influence out to time scales of thousands of years, make it impossible to verify predictions and thus makes the hypotheses unfalsifiable in practice. Very convenient, but hardly science.
Since it takes 50,000-200,000 years for the energy to percolate out from its production site, any variation on timescales less than that will be washed out.
Not IMO. The sun influences climate on the centennial to decadal scale.
We just saw that with the recent super El Nino. It took about 18 years for the tropical Pacific to soak up enough solar energy to blow it off so spectacularly in 2015-16. There were weak El Ninos in between, but they didn’t discharge enough stored energy.
We also have the examples of the solar minima (Spoerer, Maunder and Dalton) of the Little Ice Age. Those were solar-caused decadal climatic phenomena (cooling), which, taken together, produced the LIA cold period.
Well, I still like my little solar cosmic ray clock, tickling the oceans into a nice little sine wave.
============
Except that the clock does not show correct time:
http://www.leif.org/research/GCR-Temps-Discord.png
Of course, for true believers such discordance is not important.
By the way, Leif, there’s a nice little example of your uncertainty. However, you still seem hung up on TSI, which I agree is pretty stable.
===============
Back when I first got interested in this subject [early 1970s] it was thought [based on Abbot’s measurements] that the solar cycle variation of TSI was of the order of 2 to 3 %. Such a variation would result in a temperature variation of up to 2 degrees and thus be a viable explanation for climate change. Alas, we found that the variation is about 25 times smaller which pulled the rug out from under that explanation. Even Jack Eddy in his dinner talk at a meeting in 2003 acknowledged that.
I find this a pity as funding for my chosen field would be immensely helped by a clearly demonstrated effect.
Re: your out of chronological place comment @ur momisugly 8:26. You choose such a short time period for something that may have taken many millennia to lock.
===========
many millennia to lock
and that conveniently puts it out of falsifiability. Not science, then.
And on such a long time scale [many millennia], the solar modulation is completely drowned out by the change of the geomagnetic field which is the primary modulator of the cosmic rays that gets through the magnetosphere. The SST is not much different from the other temperature records.
And please, what’s with HADSST3? You’d stake your beliefs on that tiny portion of the oceans?
=============
Re: your 8:36, of course it’s conjectural. I’ve previously hoped that if that is an operative mechanism, we’d take less time to figure it out than it has to lock the mechanism.
================
your 8:36, of course it’s conjectural
Looks like data to me.
You should be more precise. What is conjectural? And it does not take long to falsify a hypothesis.
You misunderstand. With conjectural I refer to my clock. As you’ve taught me, the shape of the peak of solar cosmic rays alternates from sharp to flat in each succeeding eleven year cycle, allowing two of one shape and one of the other in each phase of the oceanic cooling and warming cycles. Tick-Tock-Tick, Tock-Tick-Tock.
==================
Those variations are so minute that they would be even harder to see, especially since the first-order effect [the 11-year effect] doesn’t seem to be present.
About your 8:51, I disagree. I think it might take a long time to prove or disprove that hypothesis. But it’s silly to say that formulating a hypothesis is not science, if you’ve actually said that.
==================
The hypothesis was formulated by Svensmark based on the first two cycles: very direct effect, no lag, mechanism to boot, everything making sense, etc. The next three cycles disproved all of that. Still clinging to it is bad science.
Yes, your first order effect doesn’t show a correlation with an observed oceanic phenomenon. My lower order one does.
==============================
A second order effect is a higher order effect. Not a lower one. And if there is no first-order effect there will be no second-order effect which would be a modulation on top of the first-order effect.
Now you are melding different hypotheses.
===============
As Willis would say: which two exactly?
And you are being tricky with your 8:42. Neither SST nor the atmospheric temperatures tell you what is going on in the whole ocean.
=============
Since we live on land the deep ocean doesn’t matter on the short time scale on which Svensmark claimed his hypothesis was operating, so your remark is about a straw man, perhaps trying to deflect the issue from the facts. It doesn’t matter what goes on in the whole ocean: Svensmark’s hypothesis has been soundly falsified.
Re 9:13, you are quibbling about the nomenclature of orders, and I don’t accept your dogma that there can be no mechanism from a lesser order effect.
===============
dogma?
For a second-order effect to show there has to be an effect in the first place. If cosmic rays have no effect then a second-order cosmic ray variation won’t have any effect either.
You may believe otherwise, but find me an example that demonstrates the plausibility of your claim.
Hmmm, can you tell me what causes the shape of those peaks to alternate?
===============
Yes. Slide 25 of http://www.leif.org/research/What-Geomagnetism-can-Tell-Us-about-the-Solar-Cycle.pdf
The polarity of the sun’s polar field determines how cosmic rays enter the solar system.
Thanks, that’s helpful. I love the red ‘yet’.
==============================
we are working on it….
This paper by my good friend Miyahara gives more details:
http://www.leif.org/EOS/IAU2011_Miyahara.pdf
P.S. I don’t agree with ALL her speculations, but they are clearly marked as such, so she is excused.
Funny(peculiar) that she shows a climatic effect at a chokepoint for the oceans.
============
Leif, it’s taken a day, but I think I’ve an inkling as to how we talked past each other so much last night. It isn’t the cosmic rays, per se, or even the shape of the peaks, but if there is a mechanism, it’s from a more primal cause. Something about the phenomenon that shapes those peaks may may create an earthly mechanism. I’m sorry to be so imprecise, and so conjectural, but it’s the best I can do.
Again, this is not something easy to figure out, but the correlation with the oceanic cycles is attractive.
===============
The peaks are due to processes that take place a billion miles away from the Earth…
Yes, act at a billion miles through forces that originate a lot closer than a billion miles, something large, hot, and bright.
====================
Being large, hot, and bright has nothing to do with the modulation of cosmic rays which happens in the outer solar system. There are no ‘unknown’ forces at work.
They are throughout those billion miles, including Earth. Surely you can see that?
================
Actually not. I can see stuff that may have an effect and this ain’t in that category.
I’ve been imprecise. Your processes may act to shape cosmic rays out a billion miles, but what can cause an effect at a billion miles may well have a much stronger effect more closely, not in cosmic ray formation, but something else impacting the Earth. Conjectural, sure, but hardly implausible.
================
implausible
Very much so, because of the energies involved [or rather the lack thereof]. Your argument is of the same caliber as that which says I have a 50% chance of winning the lottery: either I don’t or I do.
Well, since we don’t know the mechanism, you don’t know the energies required, particularly given the extremely long period of time it may have taken to lock with the oceanic cycles.
Tiny inputs over a long period of time could add up.
===============
We do know the energies that are impacting us. We measure that high and low. And we have a good understanding of the environment surrounding the Earth. That you can’t think of a mechanism is perhaps a clue to its [im]plausible existence.
Thanks, Leif, as always.
========
joelobryan
March 19, 2017 at 5:49 pm
joelobryan……..maybe late in the day, but please do consider me warning….get coca-cola or pepsi on the tap……..:)
cheers
Past climatic history proves that those who do not support solar /climate relationships and abrupt climatic shifts are in denial.
It is on a decade scale when it happens not over millennial but that is what the data shows and who cares about data if it does not fit ones false idea on how /why the climate changes.
Ok, back in the bit-bucket you go….your comments are just too stupid to publish anymore.
cerescokid March 19, 2017 at 1:24 pm wrote:
“I will ignore protestations from those such as Mosher who say there is no such thing as the MWP.”
Let’s see your data, all compiled for a time series.
“There were no globally synchronous multi-decadal warm or cold intervals that define a worldwide Medieval Warm Period or Little Ice Age.”
— “Continental-scale temperature variability during the past two millennia,” PAGES 2k Consortium, Nature Geosciences, April 21, 2013
http://www.nature.com/ngeo/journal/v6/n5/abs/ngeo1797.html
“There were no globally synchronous multi-decadal warm or cold intervals that define a worldwide Medieval Warm Period or Little Ice Age.”
— “Continental-scale temperature variability during the past two millennia,” PAGES 2k Consortium, Nature Geosciences, April 21, 2013
Seems to contradict Javier who claimed that there was a strong MWP between 900 and 1000 AD.
Comments?
Who is “Javier,” and where is his (1) publication, and (2) global dataset?
Marcott et al 2013 also did not find a global MWP or LIA.
There are 34 references to Javier on this thread…
What are Javier’s publications in the peer reviewed literature on this topic?
I’ll let him answer that. He says he is a ‘trained scientist’.
OK. But that and $3.50 will get you a latte at Starbucks.
I simply do not buy blog posts as proof of anything. Show me the peer reviewed science, as a start….
PS: I’m also a “trained scientist.” Hence my skepticism.
Heh, Marcott and Pages 2K, poster children for why funding to the alarmist cabal is under pressure.
=============
Disingenuous, too, Crackers345; Marcott’s method obscures(deliberately?) such excursions as the MWP and the LIA.
==============
kim wrote:
“Disingenuous, too, Crackers345; Marcott’s method obscures(deliberately?) such excursions as the MWP and the LIA.”
They did not — their time resolution (120 yrs) was determined by their data.
There simply is no evidence of a global MWP or LIA. PAGES 2k found this too.
If you think they were global, let’s see your data and papers saying that.
The MWP and LIA do appear to have been global phenomena:
https://notalotofpeopleknowthat.wordpress.com/2015/12/24/evidence-of-mwp-in-argentina/
Crackers,
Marcott et al 2013?!
LOL!
The evidence for global MWP and LIA was already overwhelming in the 1960s, and now is so voluminous, covering so much of the globe, that it can only be ignored by the blind faithful of the CACA cult.
This just scratches the surface:
https://wattsupwiththat.com/2017/01/03/documenting-the-global-extent-of-the-medieval-warm-period/
Global LIA:
https://www.sciencedaily.com/releases/2014/11/141119204521.htm
The Holocene Optimum (~5 Ka), Egyptian WP (~4 Ka), Minoan WP (~3 Ka) and Roman WP (~2 Ka) were also global climatic phenomena, as were the intervening cold periods, like the Greek Dark Ages and Migration Dark Ages CPs. Previous interglacials have shown the same cycles.
CACA has corrupted all that it touches.
Chimp commented:
“The evidence for global MWP and LIA was already overwhelming in the 1960s”
And just where is that data? What proxies were available in the 1960s to infer global tempertures?
Lamb’s hand-drawn graph of northern Europe?
Stephen Wilde wrote:
“The MWP and LIA do appear to have been global phenomena:”
the title of that post is “Evidence Of MWP In Argentina, with others in South America. that hardly gives global coverage. and the conclusion seems to be based on eyeballing it, not by any valid mathematical reconstruction techniques.
and any such proxies, if they were good, would have been included in PAGES 2k. Look at their Figure 2. They find little change of temperature in South America from 800-1200 AD. they do find cold temperatures there from 1300-1700 AD.
they did not find evidence of a global MWP or LIA. and as far as I know their study incorporates the most extensive set of proxies ever published. Correct me if I’m wrong.
Crackers,
The MWP and LIA were identified using historical records as well as archaeological and physical, chemical, botanical and zoological evidence. Had you ever studied paleoclimatology, you wouldn’t ask such embarrassing questions. Do you know why the Dryas events are so-called?
Please start your study of this topic, about which you’re clearly so unfamiliar, with the classic literature on the subject, which includes whole books, not just one graph. What is it that you find objectionable about Lamb, the Father of Paleoclimatology? The fact that his work shows that today’s “climate scientists” are shameless liars and rent-seeking charlatans?
crackers345 March 21, 2017 at 5:04 pm
There is evidence of prior global warm and cold cycles from every continent and every ocean, not just Argentina. Only among CACA cultists is this fact not recognized.
You must not have been a regular reader of WUWT before commenting here:
https://wattsupwiththat.com/2013/04/11/evidence-for-a-global-medieval-warm-period/
Or even general interest media:
https://www.forbes.com/sites/peterferrara/2013/05/26/to-the-horror-of-global-warming-alarmists-global-cooling-is-here/#4a18054a4dcf
There are also counter-secular-trend cycles within the centennial-scale warmings and coolings, such as the Sui-Tang warm interval during the Dark Ages Cold Period, preceding the Song-Yuan warming (peak Chinese Medieval WP):
http://onlinelibrary.wiley.com/doi/10.1002/2014JD022941/abstract
You would do well to study a topic before presuming to comment upon it by regurgitating the scientifically baseless articles of your blind faith in the cult of CACA.
sure i’ve studied paleoclimatology. just finished a upper-level undergraduate class in it, and read thomas cronin’s textbook. you?
what’s objectionable about lamb is he had a very limited view (northern europe, iceland), had few-to-no temperature proxies that covered the rest of the world, did not use the mathematical techniques that exist today to account for spatial and temporal data limitations. the graph he’s famous for, he drew by hand. not even any error bars.
chimp, do you have any real science? published? not blog posts and media articles. any papers not limited to china or argentina or other relatively small regions (cp the globe)?
i know of marcott et al and PAGES 2k. and of course many papers that reconstruct the northern hemisphere, starting with mann et al, crowley and lowery, esper et al, moberg et al, wahl and ammann, tingley and huybers, and others.
crackers345 March 21, 2017 at 5:15 pm
You clearly need better undergrad teachers, who themselves appear to adhere to your anti-scientific cult.
Lamb’s conclusions have been confirmed by data from all over the globe in the past fifty years, as you’ve been repeatedly shown.
chimp: cite the papers Lamb wrote on global temperature reconstructions.
crackers345 March 21, 2017 at 5:22 pm
I’ve provided you links to dozens of the hundreds of genuine scientific papers showing beyond any reasonable doubt that past warm and cool cycles such as we’re now enjoying are perfectly natural. Links to my own work would add little to this massive accumulation of overwhelming evidence, which your cult forces you to ignore.
Please try reading some of them before regurgitating more CACA. Ad hominem is the last refuge of the desperate and evidence-less.
The Modern WP is no different from any of its predecessors, hence the null hypothesis cannot be rejected, and there is no basis for Catastrophic Anthropogenic Climate Alarmism.
crackers345 March 21, 2017 at 5:26 pm
Are you really unaware that Lamb wrote not just papers, but whole books?
https://www.amazon.com/Climate-History-Modern-World-Hubert/dp/0415127351
Stephen Wilde March 21, 2017 at 1:41 pm
Not just South America, but Antarctica:
https://www.cambridge.org/core/journals/quaternary-research/article/div-classtitleunstable-climate-oscillations-during-the-late-holocene-in-the-eastern-bransfield-basin-antarctic-peninsuladiv/E8A5E0F3C50547698AAB93C7FBD4BA80
“The late Holocene records clearly identify Neoglacial events of the Little Ice Age (LIA) and Medieval Warm Period (MWP).”
And Oceania:
Allen, Robert J. (1985). The Australasian Summer Monsoon, Teleconnections, and Flooding in the Lake Eyre Basin. Royal Geographical Society of Australasia, S.A. Branch.
http://www.nature.com/nature/journal/v279/n5711/abs/279315a0.html
http://onlinelibrary.wiley.com/doi/10.1029/2001GL014580/abstract?systemMessage=Wiley+Online+Library+will+be+unavailable+on+Saturday+25th+March+from+07%3A00+GMT+%2F+03%3A00+EDT+%2F+15%3A00+SGT+for+4+hours+for+essential+maintenance.++Apologies+for+the+inconvenience.
Only climate change d@niers d@ny the global nature of the MWP and LIA, plus prior warm and cold secular fluctuations.
Chimp wrote:
“Lamb’s conclusions have been confirmed by data from all over the globe in the past fifty years, as you’ve been repeatedly shown.”
again, please cite which papers or books of Lamb found a global MWP or LIA.
show me where I can find data.
show me the data that goes into this famous drawn-by-hand graph.
Chimp wrote:
“I’ve provided you links to dozens of the hundreds of genuine scientific papers showing beyond any reasonable doubt that past warm and cool cycles such as we’re now enjoying are perfectly natural”
Not global events, you haven’t.
For an expert on paleoclimatology, you don’t seem to understand that it’s not enough to just toss around graphs and papers for disparate regions and disparate time periods.
The temperature has to be *reconstructed*, mathematically, using the proxy data, locations, time periods, and accounting for any gaps in the data. This reconstruction was why the Mann, Bradley and Hughes paper was so notable, and now famous — they did that mathematical reconstruction. Others have done it differently using different mathematical techniques, such as RegEM, or Tingley and Huyber’s matrix methods.
Lamb did nothing of the sort. His most famous graph was drawn by hand!
Lamb had very scant proxy data. Today there is enormously more, and better data, and statistical techniques have been developed to properly include them.
Lamb was a pioneer, but recent work has given a much clearer, and global, perspective.
Crackers,
Lamb relied on a variety of data. Read his books.
For the MWP, among other data, he depended for instance on Manley’s reconstruction of the CET for the Middle Ages. Most of Lamb’s data were for the North Atlantic region, which may contribute to the false impression that the warm period was limited to that area. Mostly that myth however is fed by CACA cultists d@nying reality.
Lamb lacked plentiful data for other regions, but did draw tentative conclusions based upon the little information he had for other parts of the NH and for the Southern Hemisphere.
But as I’ve showed repeatedly, data from every continent and every ocean in the past 50 years have shown conclusively that not only the MWP and LIA were global phenomena, but that the previous warm and cold intervals of the Holocene and prior interglacials were as well.
Chimp wrote:
“Ad hominem is the last refuge of the desperate and evidence-less.”
Ironic, considering you the doing ad hom attacks above.
crackers345 March 21, 2017 at 9:06 pm
I never claimed to be an expert. I have studied the topic for 50 years, however, and kept current.
I have indeed provided you links showing that the MWP and LIA were global. Just the one link to the 2013 post on this blog contains enough papers to convince anyone interested in reality rather than ideology.
You clearly have not even bothered to look at the links showing the MWP and LIA in the Southern Hemisphere, Asia and North America as well as Europe, in the Pacific, Arctic, Indian and Southern Oceans as well as the Atlantic.
Plainly you don’t want to learn and can’t handle the truth.
Chimp wrote:
“Links to my own work would add little to this massive accumulation of overwhelming evidence”
Sure, let’s see your published work. I’m interested.
Heh, c345 touts Mann, Bradley and Hughes. This one is out there.
==============
Chimp, now that I know you dismiss any data you don’t like as “fake” but easily accept any data you do like, I’m going to close my side of the conversation — there’s just no fun in that kind of environment.
Thanks for the replies. You can have the last word.
Heh, Nature gets the last word, and the straight shaft of the alarming hockey stick is unnatural. Too bad, so sad, you coulda done better and shoulda.
====================
RW commented, in response to lsvalgaard:
“Are there not periods of earth’s history during which co2 concentration and global temp estimates decouple entirely?”
Are there? Show us such periods.
PS: CO2 isn’t the only influence on deep climate. But it is always present as a GHG.
Have a look at Leif’s slide 6 here:
http://www.leif.org/research/w6yx-Talk.pdf
The ups and downs of zenith angle and sunspot cycle control during the period 1784 to 1836 track well with warming and cooling spells in the historical weather records.
In particular 1784 to about 1794 was a warm period and the period around 1812 saw some memorably cold European winters.
Furthermore, according to ships logs, all the warmer spells had less wavy more zonal jet stream tracks whereas all the cooler spells had more wavy more meridional jet strream tracks.
The waviness of the tracks is associated with the level of total global cloudiness and thus the proportion of solar energy able to enter the oceans.
At Leif’s request (19/ 9:32pm) I repeat my comment of 5:22pm on the 17th here.

“When comparing minima and maxima it is necessary to know where earth is relative to the trends in the major 60 and 1000 year cycles. The latest peak in the millennial temperature cycle was at about 2003/4 in the RSS data.
For future trends see
For continuity you also need the post which followed
“See Blue trend in RSS time series above
“The RSS cooling trend in Fig. 4 and the Hadcrut4gl cooling in Fig. 5 were truncated at 2015.3 and 2014.2, respectively, because it makes no sense to start or end the analysis of a time series in the middle of major ENSO events which create ephemeral deviations from the longer term trends. By the end of August 2016, the strong El Nino temperature anomaly had declined rapidly. The cooling trend is likely to be fully restored by the end of 2019.”
From http://climatesense-norpag.blogspot.com/2017/02/the-coming-cooling-usefully-accurate_17.html
“From Figures 3 and 4 the period of the latest Millennial cycle is from 990 to 2004 – 1,014 years. This is remarkably consistent with the 1,024-year periodicity seen in the solar activity wavelet analysis in Fig. 4 from Steinhilber et al 2012 (16).Fairbridge and Sanders 1987 (17) p 452 provide the commensurability relationships of planetary and lap periodicities as a basis for future analysis of the sun-climate connection. Their reported Uranus Saturn Jupiter Lap time periodicity of 953 years is pertinent. here. Scafetta 2013 (18) compares the GCMs with a semi-empirical harmonic climate model based chiefly on astronomical oscillations. The model is constructed from six astronomically deduced harmonics with periods of 9.1, 10.4, 20, 60, 115 and 983 years. Scafetta’s abstract also states: “In particular, from 2000 to 2013.5 a Global Surface Temperature plateau is observed while the GCMs predicted a warming rate of about 2 C/century. In contrast, the hypothesis that the climate is regulated by specific natural oscillations more accurately fits the GST records at multiple time scales”
Sorry should say – At Leif’s request (19/ 9:32pm) I repeat my comment of 5:22pm on the 19th here.
Leif says
“different times of polar field reversals is a general feature of the cycle”
It is not a ‘double reversal’, but simply reversal at different times in the two hemispheres, which is a normal occurrence.
Henry says
lets get back to this graph
this is important to know for anyone studying the sun and solar cycles/
and unfortunately dr Svalgaard won’t teach you this.
Note that something odd happened around 1971 and again in 2014. It almost looks like two small mini solar cycles. We can also see that same thing also happening in 1991. yet, in 1980 and 1990 the positive and negative magnetic field strengths [MFS] just seem to cross each other over without bother….
Do you all see this?
When I first started looking at solar cycles I came across some papers from Hale and Nicholson. They proposed that one solar cycle is exactly two successive Schwabe cycles, counting the positive + the negative of MFS in succession.
In other words, we have one Hale cycle from 1970 until 1991 and the next one is from 1991 until 2014.
[forget about SSN just now]
If you take this into account during your investigations looking at those MFS cycles instead of SSN and you start grouping your observational data accordingly, you will get to see some interesting results.

Like for instance, rainfall patterns
Anyone can say that I was perhaps just lucky. So I repeated my results for the UK [CET] and found exactly the same pattern. In Wellington I saw that the relationship is also there but is a parabola rather than a hyperbole.

If you all do this in your own backyard [find a weather station with rainfall data going back to 1927] you can easily predict the weather pattern in your own area.
In South Africa, I predict that rainfall will drop, in NZ it will increase in the next few decades.
its the sea temperature why the earths temp hasn’t started to fall yet. There will be a lag before it starts to fall.
I believe this is the fourth consecutive sunspot free day and we are two to five years from the solar cycle minimum.
As noted, in my above comment. The sunspot physical properties changed as solar cycle 24 proceeded consistent with Livingston and Penn’s finding that the magnetic field strength of newly formed sunspots is decaying linearly.
Eugene Parker calculated that the magnetic flux tubes that rise up to the surface of the sun to form sunspots on the surface of the sun require a minimum field strength of around 20,000 Gauss when they are released to avoid being torn apart by convection forces.
As the magnetic field strength of the flux tubes declined, large long lasting sunspots were replaced with tiny short lived sunspots which are called pores.
The next step in the process is no sunspots which is what we are now observing.
The past Maunder minimum like periods in the solar proxy record lasted from 100 to 150 years.
The solar large scale magnetic field is produced from the residue of the sunspots on the surface of the sun. If sunspots are no longer produced for some very long period of time the solar large scale field will decline to some minimum.
This site provides a daily update of the sunspot and Ap data.
http://www.solen.info/solar/
There needs to be a couple of blog posts outlining the hypothesized mechanisms by which solar cycle changes modulate planetary cloud cover.
Solar wind bursts from coronal holes have a large effect on planetary cloud cover. The calculated effect is roughly 7 watts/meter^2 as compared to 3,7 watts/meter^2 for a doubling of atmospheric CO2.
As coronal holes can and do appear on the sun even during periods when there are few or no sunspots (for example there is currently a very large coronal hole on the surface of the sun) the analysis as to whether the planet will or will not cooling needs to include solar wind bursts from coronal holes in addition to the effect of the strengthening or weakening the solar heliosphere (solar heliosphere is the name for the pieces of magnetic flux and ions from the sun extends past the orbit of the Pluto) on number and velocity of the high speed cosmic particles (called GCR, galactic cosmic rays, for historical reasons) that strike the earth.
The high speed GCR particles create ions in the atmosphere which in turns effect cloud properties and lifetimes as well as rainfall amounts.
The coronal holes appear and disappear in cycles of roughly two to three years. There is observational evidence that indicates that current cycle of coronal holes is declining.
Here is a thought provoking graph from Humlum O. Climate4you graph. Tropical cloud cover and global air temperature, http://www.climate4you. com/ seen also Fig 11 at http://climatesense-norpag.blogspot.com/2017/02/the-coming-cooling-usefully-accurate_17.html

The break in slope at 2002+/- seen on the comment at 20/6:16 above represents the peak of the current millennial temperature cycle. It equates to the millennial solar activity peak ( neutron low) at 1991 in the neutron count – with 11/12 year delay. (sorry Leif you might have to scroll up for 2 seconds to find it)
First line might better read The break in slope seen at 2002+/- and also seen at 2003/4 on the comment at 20/6:16 above represents the peak ……..
William
it works like this
lower solar magnetic field strengths [SMFS] => more of the most energetic particles being able to escape => more ozone, peroxides, N-oxides being formed [had they measured for peroxides in the SH they would have discovered there never was a ozone hole…]
more ozone & others => more UV A + B deflected off from earth to space => less energy into the oceans => global cooling
As I said, my data sets show that global cooling has already started 20 years ago. The satellites could be out by a few tenths due to degradation of the probes – there is no probe material that currently can withstand the sun. What version are we now….???.
[Hence, a journey to Mars is a futile exercise of suicide unless you first create an atmosphere.]
Best, BOM, KNMI etc is guarded by the AGW believing crowd. Indeed, it is easy to fool the public when global cooling and warming fluctuates by only a few tenths of a degree,
What are we talking about? Why are we talking about it?….because we waste so much money on it……
whiten
if you want to prove that the net effect of more CO2 in the air
– an increase typical in the order of 0.01% [over the past 50 years] –
you must come with a paper showing to me a balance sheet of how much cooling is caused by the increase in CO2 [by deflection of certain radiation 1-2 and 4-5 um]
and how much warming is caused by the trapping of heat 14-15 um in earth’s atmosphere;
there is no such paper….
Leif knows all of this. This is OffT here, but if it comes OnT you can debate this point with me more in detail.
Chris Norman
hold on.
NZ will not be affected by global cooling [although up to now, until 2015, it was]
from 2015 there will be a change, for the next 2 decades,
meaning more cloudiness, more rain and,effectively, less cold
[due to the GH effect…]
Outside air temperatures at the precision of 0.1 °C are surreal from metrology viewpoint.
The magnitude looks more like an uncertainty a precision laboratory would report for the measurements within their own premises. But not for something ranging between 100 °C at any given time. Yet, this seems to be the foundation for the discussion over here.
For this reason past absolute air temperature readings would be interesting to see. Suggesting the years Akhenaten, Jesus Christ, Constantine the Great, Leo III the Isaurian, Rollo, L Da Vinci, A Celsius, J Joule and E Schrödinger were born.
A Smith
I agree with you that the globe is cooling. How did you figure that out?
Unfortunately I think there are not too many here that will agree with you…