Guest post by David Middleton
Models often get a bad rap among skeptics, largely because climate models have demonstrated an epic failure in predictive skill. However, models are extremely valuable scientific tools, particularly when used heuristically. Models are learning tools.
Generally speaking models fall into two general categories:
- Forward problems.
- Inverse problems.
Inverse problem
From Wikipedia, the free encyclopedia
An inverse problem in science is the process of calculating from a set of observations the causal factors that produced them: for example, calculating an image in computer tomography, source reconstructing in acoustics, or calculating the density of the Earth from measurements of its gravity field.
It is called an inverse problem because it starts with the results and then calculates the causes. This is the inverse of a forward problem, which starts with the causes and then calculates the results.
Inverse problems are some of the most important mathematical problems in science and mathematics because they tell us about parameters that we cannot directly observe. They have wide application in optics, radar, acoustics, communication theory, signal processing, medical imaging, computer vision, geophysics, oceanography, astronomy, remote sensing, natural language processing, machine learning, nondestructive testing, and many other fields.
[…]
In oil & gas exploration, we make extensive used of inverse models. We start with a result (seismic amplitude anomaly) and then try to calculate the causes (oil, gas, tabular salt, oyster beds, geopressure, tuff, marl, etc.). One of the most widely used tools is called a “fluid replacement model.” Using sonic and density logs from an existing well drilled through the objective section, we can mathematically substitute oil and gas for brine in wet sands and generate a synthetic seismic anomaly to compare with the real seismic anomaly. While these models are very useful, sometimes you will get a result that just doesn’t make sense. If a model defies realistic geology, it’s probably wrong. I wondered if we could do the same sort of thing to climate data.
Climate Sensitivity Inverse Model
In a fluid replacement model, we replace one fluid with another to see what the real data would look like with different fluid contents. In my climate model, I simulated what a climate reconstruction would look like without the industrial era rise in atmospheric CO2. I used two transient climate response cases 1) 1.35 °C and 2) 3.5 °C per doubling of atmospheric CO2.

This yielded two equations for ΔT:
- ΔT = 1.9476*ln(CO2) – 10.954 for TCR = 1.35 °C
- ΔT = 5.0494*ln(CO2) – 28.398 for TCR = 3.50 °C
Using CO2 data from Law Dome (MacFarling Meure et al., 2006) and a Northern Hemisphere climate reconstruction (Ljungqvist 2010), calculated the CO2-driven temperature component and then subtracted it from the reconstructed temperatures.

The removal of a 1.35 °C TCR yields reasonable result. The removal of a 3.50 °C TCR yields a temperature much colder than the nadir of the Little Ice Age. This seems massively unlikely. (When I applied this to Greenland ice core temperatures (Alley, 2000 and Kobashi et al., 2010) using a 2X polar amplification, the model yielded temperatures equivalent to the Bølling-Allerød glacial interstadial.)
Zooming in on the “Anthropocene,” it appears that a high TCR (alarmist) world would already be buried under a mile of ice, if not for anthropogenic augmentation of the so-called greenhouse effect.

Conclusions
If my methodology is valid, it seems highly probable that the climate is relatively insensitive to atmospheric CO2. This would seem to validate recent observation-based climate sensitivity estimates, which indicate rather low TCR and ECS values.
Notes
- I use the phrase “so-called greenhouse effect” because it doesn’t really work like a greenhouse… Not because I deny its existence.
- If I’ve made any glaring errors, please point them out.
- For the purpose of this exercise, I am assuming that the Law Dome ice core has adequate resolution to yield an accurate depiction of pre-industrial atmospheric CO2.
References
[1] Ljungqvist, F.C. 2010.
A new reconstruction of temperature variability in the extra-tropical
Northern Hemisphere during the last two millennia.
Geografiska Annaler: Physical Geography, Vol. 92 A(3), pp. 339-351,
September 2010. DOI: 10.1111/j.1468-0459.2010.00399.x
[2] MacFarling Meure, C., D. Etheridge, C. Trudinger, P. Steele,
R. Langenfelds, T. van Ommen, A. Smith, and J. Elkins. 2006.
The Law Dome CO2, CH4 and N2O Ice Core Records Extended to 2000 years BP.
Geophysical Research Letters, Vol. 33, No. 14, L14810 10.1029/2006GL026152.
[3] Science News
[4] Featured Image
Sorry, not good enough. I can’t see any predictions of doom coming from this model, so it must be a dud.
David: You won’t be the first geophysicist I’ve taken issue with, nor will you be the last, but please accept that it’s always done in good humour.
That’s your comment on your figure 2. Sorry, I beg to differ, I don’t think it’s reasonable at all.
Looking at this from where I’m sitting, it appears that figure 2 demonstrates that IF AND ONLY IF CO2 was the ONLY driver of temperature change, then a TCR of 1.35°C explains most if not all of the 0.5°C warming from 1800 to 2000 (+0.25°C/century)
Well fine, that makes you a certified lukewarmer. Congratulations, you’ve earned an official T shirt.
What then explains the 0.4°C warming from 800 to 960 (+0.25°C/century)? Or the 0.4°C warming from 1700 to about 1750 (+0.8°C/century – I’ll accept that this is a blip in the proxy reconstruction) And what explains the 0.5°C cooling from 170 to 320 (-0.33°C/century)? Or the 0.9°C cooling from 960 to 1700 (-0.12°C/century)? And why was that elusive factor or group of factors (sun? oceans? hmm…..) not operative at all after 1800?
By drawing the conclusion that you do, you’ve essentially locked yourself into a logical improbability “THIS variation was caused by CO2 but THAT variation was caused by something else”. It’s basically the same logical stance taken by alarmists, but with a dose of mathematical rigour to make it a bit less absurd.
I won’t be joining the “CO2 has no effect on climate” crowd. There is the physics (which I’m not very good at BTW) that suggests CO2 can, to some degree, return a portion of outgoing IR back to the surface. But there are unknown (or very poorly known) interactions and feedbacks with H2O, which hugely complicates things because of albedo-changing clouds and the way its phase changes move heat from the surface to the troposphere or stratosphere. And on and on; it’s all been hashed over many times in these pages. I think it quite likely that the NET effect of CO2 on climate is very small, after all of its interactions are accounted for.
I agree that being a lukewarmer makes us appear a bit more respectable, a bit less (rabid………?), but to be a lukewarmer, you have to make assumptions like the one I’ve attributed to you, that are hard to justify when you look at paleo-temp data.
SR, your comment contains a logic flaw. Please see extended comment on model attribution above thread. Then get back with some irrefutable rejoinder, if you can. Details were in the 12.56 pm response. Do try harder. Not going to repeat them again, cause gets tiresome after so many posts on the same irrefutable facts. Check them out before responding, please.
As I have stated. The purpose of this exercise was just to remove an assumed CO2 effect; not to calibrate all of the forcing mechanisms.
I called the 1.35 C case “reasonable” because it didn’t yield a crazy result. It resulted in a continuation of the mid-20th century cooling. I don’t think this is necessarily correct; just reasonable. We know that the late 20th century warming began with a shift in the long-term phase of the PDO. This shift wasn’t driven by CO2; so 1.35 C is probably still way too high.
The 3.5 C case is clearly batschist crazy. It yields a rapid temperature drop which crashes through the lower 95% confidence band, colder than the nadir of the LIA, to glacial interstadial territory.
maybe irrelevant aside: this demonstrates the problem with inductive logic (finding putative causes from effects). in essence we guess at a model, and see if it produces the result that matches reality.
Sherlock Holmes never deduced anything at all. His logic was all inductive.
to summarise: to solve an inductive problem we propose a solution and deduce the phenomena from it, and if they fit the data we say the model is good and accurate.
Of course that doesn’t prove it is true. Our models say that the sun will rise tomorrow, because it always has. Essentially.
As the man falling past the thirteenth floor said when asked how he was doing:
“OK so far!”
Earth Science, by its nature, is very inductive. Most of our direct observations are of results, from which we interpret causes.
There is a problem on this site : you keep publishing graphs ending in 1995 or 2000, when it is not “the present”, meaning sixty-seven years ago. Today is February 7,2017. Time passes by, you know…
The graphs were of a climate reconstruction and ice core-derived CO2 estimations. These things, by definition, don’t extend to the present day and the x-axes are in calendar years, not years before present (1950 AD).
Right. Another simple model for a complex system.
Just when I think I’ve figured out how to get my follow-up reply to somebody to appear somewhere in the order of the replies given to that person, it ends up appearing BEFORE the comment that it is supposed to follow. This happened with my attempted follow-up reply to seaice above, which makes the flow of the dialogue screwed up.
I guess this blog is just not a dialogue kind of blog, which means it surely pays to quote the exact words being responded to and the handle of the person to whom the reply is being addressed.
Lesson learned.
It is frustrating at times.
When you say that heat energy in the atmosphere is converted to IR, are you talking about thermal kT energy? Because, that is certainly not cosistent with heat capacity ratios of gases at room temperature. Most gases, including CO2, would need to be heated to very high temperatures before any thermal energy could excite those molecules to higher vibrational states.
In your conclusion you say : “which indicate rather low TCR and ECS values”
I suggest you remove the term “ECS” from this statement.
There’s nothing in your entire paper that speaks to ECR or indicates anything about it.
Equilibrium Climate Sensitivity is directly related to Transient Climate Response.
If TCR is low, so is ECS…
Agree it’s related and in same direction, but what quantitative relationship are you assuming when you say “rather low”?
IPPC claim for TCR is 1 – 2.5. For ECS it’s 1.5 – 4.5.
If TCR of 1.35 looks reasonable based on measured data, that’s consistent with IPPC claim
If there’s linear relationship between the two, then an ECS of 2.5 is implied.
Is this what you mean by “rather low”? Much higher than some of the studies suggest (Curry, Forster, Otto, etc.)
It would be interesting to do the math for the IPPC max TCR of 2.5.
It looks like it would end up at -.8 on your graph.
So if IPPC max were right, we would be about halfway towards an ice age by now.
Anyway thanks for an interesting and thought provoking paper.
The ECS on the IPCC graph is 3.5 C, the TCR is approximately 2 C.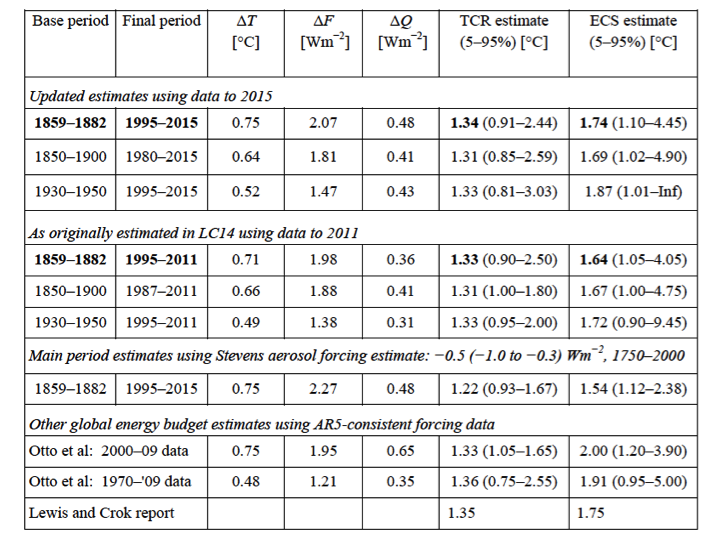
Lewis & Crok had an ECS of 1.75 C and a TCR of 1.35 C.
LC14 had 1.33 and 1.72 for 1995-2011.
Otto had 1.33 and 2.0 for 2000-09.
I plotted the four values and got ECS = (2.5212*(TCR)) – 1.5455 with R² = 0.9738. It looks like a very linear relationship between TCR and ECS.
… geophysics, astronomy, remote sensing,… you left out the biggest detective work of all: geology. Having mapped and interpreted Precambrian geology (3B+ybp to ~0.5Bybp), regional and ore deposit emplacement, occasionally Paleozoic, Mesozoic sedimentation and vulcanology, and for a time Quaternary (northward draining former Missouri R. and Lake Agassiz clays, strand lines and deltas ). This is the granddaddy of forensic reasoning.
Yes it is.
David Middleton,
Your model for predicting temperature response to CO2 is inadequate for the task you are trying to carry out. The heat balance equation yields a solution of a linear relationship between Temp and lnCO2 ONLY when the CO2 forcing is increasing linearly with time. (Some authors have argued that the relationship should still be approximately linear in a situation of a monotonic increase in CO2.) You absolutely cannot apply your linear relationship to a situation of increasing and decreasing CO2 levels. It is equivalent to your throwing out the acoustic equations and carrying out your fluid substitution exercise under the assumption that amplitude varies linearly with offset.
Given that in the literature of global warming climatology, “model” is polysemic (has multiple meanings), this article suffers from its failure to inform us of what is meant by the term “model.” Models are of two types. A model of Type 1 supplies no information to a regulatory agency about the outcomes of events thus being useless for the purpose of regulating Earth’s climate system.. A model of Type 2 supplies information thus being potentially useful for this purpose.
Models featuring the alleged “climate sensitivity” are of Type 1. That they are of the useless Type 1 is not widely grasped among bloggers.