From BROWN UNIVERSITY
Earth’s orbital variations and sea ice synch glacial periods

PROVIDENCE, R.I. [Brown University] — Earth is currently in what climatologists call an interglacial period, a warm pulse between long, cold ice ages when glaciers dominate our planet’s higher latitudes. For the past million years, these glacial-interglacial cycles have repeated roughly on a 100,000-year cycle. Now a team of Brown University researchers has a new explanation for that timing and why the cycle was different before a million years ago.
Using a set of computer simulations, the researchers show that two periodic variations in Earth’s orbit combine on a 100,000-year cycle to cause an expansion of sea ice in the Southern Hemisphere. Compared to open ocean waters, that ice reflects more of the sun’s rays back into space, substantially reducing the amount of solar energy the planet absorbs. As a result, global temperature cools.
“The 100,000-year pace of glacial-interglacial periods has been difficult to explain,” said Jung-Eun Lee, an assistant professor in Brown’s Department of Earth, Environmental and Planetary Studies and the study’s lead author. “What we were able to show is the importance of sea ice in the Southern Hemisphere along with orbital forcings in setting the pace for the glacial-interglacial cycle.”
The research is published in the journal Geophysical Research Letters.
Orbit and climate
In the 1930s, Serbian scientist Milutin Milankovitch identified three different recurring changes in Earth’s orbital pattern. Each of these Milankovitch Cycles can influence the amount of sunlight the planet receives, which in turn can influence climate. The changes cycle through every 100,000, 41,000 and 21,000 years.
The problem is that the 100,000-year cycle alone is the weakest of the three in the degree to which it affects solar radiation. So why that cycle would be the one that sets the pace of glacial cycle is a mystery. But this new study shows the mechanism through which the 100,000-year cycle and the 21,000-year cycle work together to drive Earth’s glacial cycle.
The 21,000-year cycle deals with precession — the change in orientation of Earth’s tilted rotational axis, which creates Earth’s changing seasons. When the Northern Hemisphere is tilted toward the sun, it gets more sunlight and experiences summer. At the same time, the Southern Hemisphere is tilted away, so it gets less sunlight and experiences winter. But the direction that the axis points slowly changes — or precesses — with respect to Earth’s orbit. As a result, the position in the orbit where the seasons change migrates slightly from year to year. Earth’s orbit is elliptical, which means the distance between the planet and the sun changes depending on where we are in the orbital ellipse. So precession basically means that the seasons can occur when the planet is closest or farthest from the sun, or somewhere in between, which alters the seasons’ intensity.
In other words, precession causes a period during the 21,000-year cycle when Northern Hemisphere summer happens around the time when the Earth is closest to the sun, which would make those summers slightly warmer. Six months later, when the Southern Hemisphere has its summer, the Earth would be at its furthest point from the sun, making the Southern Hemisphere summers a little cooler. Every 10,500 years, the scenario is the opposite.
In terms of average global temperature, one might not expect precession to matter much. Whichever hemisphere is closer to the sun in its summer, the other hemisphere will be farther away during its summer, so the effects would just wash themselves out. However, this study shows that there can indeed be an effect on global temperature if there’s a difference in the way the two hemispheres absorb solar energy — which there is.
That difference has to do with each hemisphere’s capacity to grow sea ice. Because of the arrangement of the continents, there’s much more room for sea ice to grow in the Southern Hemisphere. The oceans of the Northern Hemisphere are interrupted by continents, which limits the extent to which ice can grow. So when the precessional cycle causes a series of cooler summers in the Southern Hemisphere, sea ice can expand dramatically because there’s less summer melting.
Lee’s climate models rely on the simple idea that sea ice reflects a significant amount of solar radiation back into space that would normally be absorbed into the ocean. That reflection of radiation can lower global temperature.
“What we show is that even if the total incoming energy is the same throughout the whole precession cycle, the amount of energy the Earth actually absorbs does change with precession,” Lee said. “The large Southern Hemispheric sea ice that forms when summers are cooler reduces the energy absorbed.”
But that leaves the question of why the precession cycle, which repeats every 21,000 years, would cause a 100,000-year glacial cycle. The answer is that the 100,000-year orbital cycle modulates the effects of the precession cycle.
The 100,000-year cycle deals with the eccentricity of Earth’s orbit — meaning the extent to which it deviates from a circle. Over a period of 100,000 years, the orbital shape goes from almost circular to more elongated and back again. It’s only when eccentricity is high — meaning the orbit is more elliptical — that there’s a significant difference between the Earth’s furthest point from the sun and its closest. As a result, there’s only a large difference in the intensity of seasons due to precession when eccentricity is large.
“When eccentricity is small, precession doesn’t matter,” Lee said. “Precession only matters when eccentricity is large. That’s why we see a stronger 100,000-year pace than a 21,000-year pace.”
Lee’s models show that, aided by high eccentricity, cool Southern Hemisphere summers can decrease by as much as 17 percent the amount of summer solar radiation absorbed by the planet over the latitude where the difference in sea ice distribution is largest — enough to cause significant global cooling and potentially creating the right conditions for an ice age.
Aside from radiation reflection, there may be additional cooling feedbacks started by an increase in southern sea ice, Lee and her colleagues say. Much of the carbon dioxide — a key greenhouse gas — exhaled into the atmosphere from the oceans comes from the southern polar region. If that region is largely covered in ice, it may hold that carbon dioxide in like a cap on a soda bottle. In addition, energy normally flows from the ocean to warm the atmosphere in winter as well, but sea ice insulates and reduces this exchange. So having less carbon and less energy transferred between the atmosphere and the ocean add to the cooling effect.
Explaining a shift
The findings may also help explain a puzzling shift in the Earth’s glacial cycle. For the past million years or so, the 100,000-year glacial cycle has been the most prominent. But before a million years ago, paleoclimate data suggest that pace of the glacial cycle was closer to about 40,000 years. That suggests that the third Milankovitch Cycle, which repeats every 41,000 years, was dominant then.
While the precession cycle deals with which direction the Earth’s axis is pointing, the 41,000-year cycle deals with how much the axis is tilted. The tilt — or obliquity — changes from a minimum of about 22 degrees to a maximum of around 25 degrees. (It’s at 23 degrees at the moment.) When obliquity is higher, each of the poles gets more sunlight, which tends to warm the planet.
So why would the obliquity cycle be the most important one before a million years ago, but become less important more recently?
According to Lee’s models, it has to do with the fact that the planet has been generally cooler over the past million years than it was prior to that. The models show that, when the Earth was generally warmer than today, precession-related sea ice expansion in the Southern Hemisphere is less likely to occur. That allows the obliquity cycle to dominate the global temperature signature. After a million years ago, when Earth became a bit cooler on average, the obliquity signal starts to take a back seat to the precession/eccentricity signal.
Lee and her colleagues believe their models present a strong new explanation for the history of Earth’s glacial cycle — explaining both the more recent pace and the puzzling transition a million years ago.
As for the future of the glacial cycle, that remains unclear, Lee says. It’s difficult at this point to predict how human contributions to Earth’s greenhouse gas concentrations might alter the future of Earth’s ice ages.
###
Good to see Jung-Eun managed to squeeze in the section on CO2 to ensure a future funding stream.
It’s so sad that I was expecting it at the end. You get a well thought out paper, presented well, then there has to be a random scare guess in at the end about CO2.
Apparently he has a mortgage.
I don’t accept their theory, everyone knows that the closure of the Central American Seaway is the root cause of our malaise and to end this misery we’ll have to build a few more Panama Canals and salt up the Pacific.
She has a mortgage. But you would never tell.
R
The E.U. would object to opening up Panama because that would mess up their Gulf Stream climate. Anyway, it wouldn’t do much good if you’re going to leave the Drake Passage open.
Yes, the bottling up of the Atlantic/Pacific oceans so they meet only at Antarctica (a very very slender opening!) is a huge reason we have Ice Ages. The true mystery is, why these all, everyone of them, end suddenly and why they are all so short.
EMS,
The Antarctic ice sheets formed at the Eocene/Oligocene Epoch boundary when deep ocean channels opened between Antarctica and South America and Australia, c. 34 Ma. The sheets waxed and waned during the Miocene, during which the long term trend was a cooling and drying earth.
Northern Hemisphere ice sheets formed when the Isthmus of Panama fully closed the Interamerican Seaway, c. three million years ago, at the end of the Pliocene.
So our current ice age or ice house results from plate tectonics, as too have at least some if not all prior ones. But the ice fluctuations, such as glacial and interglacial phases, within ice houses are largely driven by celestial mechanics, plus some terrestrial phenomena.
Give the girl a chance.
The gratuitous mention of CO2 at the end is surely forgiveable, given the universal interest in the subject right now.
I’d be interested to know what the model setup is that relates precession, insolation and
sea ice extent. Can anybody who understands (I don’t) explain it? Is the algorithm constructed in response to the understood glaciation timetable, or is it derived independently? If the former, it looks rather similar to the speculations about albedo changes due to northern hemisphere land ice sheets, and might be consistent with that.
There can be no question that ‘interference patterns’ arising from the interactions between the various orbital and axial variability results in the ebb and flow of interglacial periods (which are the exception to the rule of being in an ice age). I didn’t even think this was new information as it’s the unavoidable consequence of superposition in the energy domain (i.e. 1 Joule + 1 Joule = 2 Joules), moreover; Milankovitch did reference hemispheric asymmetry as a contributing factor which really only matters relative to precession.
It seems to me that most of Canada, the US East coast, Europe and Russia buried under many km of ice is a lot more catastrophic than a few cm of sea level rise or a few tenths of a degree of warming. And it’s not like this inevitable fate is unexpected or unprecedented …
I’ll wager that CO2 was added to the paper to get it through peer review after several warmist inner-circle reviewers rejected the paper without it. It weakens what is a very suggestive argument on albido by orbital mechanics being the main driver of glaciation and a good explanation of why the regime change happened to change which orbital drivers were in the driver’s seat. – Of course, not being the editor or a peer reviewer on the paper, this is all a guess
John: I disagree that the paper was “well thought out”.. See my criticism at 6:12 PM today.
OK Let’s assume, for the sake of discussion, that human contributions are zero. What then do her models predict? I am sure she knows the answer.
Excellent Michael.CO2 is irrelevant. The allegation regarding CO2 is nonsense because ECS ~= zero.
The real question is when will the new Ice Age begin? Does the paper say or not? If not, piffle.
No prediction suggests no confidence in one’s hypothesis.
Prediction is also entirely safe in this case, because nobody here will be alive to check it (I hope – if the next Ice Age starts that soon, we have a big problem – get out the water bombers and fill them with carbon black – it’s time to adjust global albedo.).
Best, Allan
Allen,
ECS is not zero, but it is small and somewhere between 1.0 W/m^2 and 1.6 W/m^2 of incremental surface emissions (about 0.2C to 0.3C at the current average temperature) per W/m^2 of incremental solar input (forcing).
The basic problem with ECS is expressing it as a temperature change per change in input power, which is a non linear metric designed specifically to obfuscate. It’s more properly expressed as W/m^2 of power leaving the surface per W/m^2 entering it.
Indeed, this is a question that begs to be asked: when is the next ice age due to start, assuming no human interference? If their model is correct, it should be able to make that prediction easily. Such a prediction would be very useful. As I understand it, this current interglacial period is already longer than the previous one. (?) If their prediction would be that the next ice age would start “soon” (i.e., within the next 500 years), then that would dampen a lot of the anxiety about global warming. People would think global warming is a good thing, keeping the ice ages away.
I believe if there was no global warming controversy they would have naturally included a prediction in their paper. Not including it makes me think they didn’t think the prediction would go over well with the establishment.
The Holocene, at 11,400 years, has so far been shorter than the Eemian, usually given as 16,000 years.
co2isnotevil
To clarify, “~” means approximately, and an ECS of 0.2 or 0,3C ~= zero.
OK?
Yes, 0.2-0.3 is closer to zero than it is to the 0.8 claimed, but then again, the 0.8 claimed is so far out of bounds, it’s meaningless.
Actually, what I want to see are the currently relied upon models run with static CO2 – i.e., assume zero increase in CO2 – what do the models say would have happened since, say, 1950 – is it realistic? Is it desirable? Does anyone know if anyone has done this with one or more of the GCMs?
“…the 0.8 claimed is so far out of bounds, it’s meaningless.”
So how do you really feel about the 3C, the 6C and 9C that were claimed by the warmists in the past?
🙂
‘So how do you really feel about the 3C”
The 3C number is the 0.8C per W/m^2 since 3.7*0.8 is about 3C. Anything more than about 1.1C for doubling Co2 is completely bogus.
Another issue I have with the 3C number is that they have tried to cast sensitivity as being specific to doubling CO2, which is complete BS since what they really mean is that doubling CO2 is EQUIVALENT to 3.7 W/m^2 of incremental, post albedo, solar input. What they call the ‘sensitivity factor’ is the proper metric which specifies the warming (or cooling) per 1 W/m^2 increase (or decrease) in actual forcing, where only the Sun is properly considered a forcing influence. It’s all just part of the obfuscation meant to emphasize CO2 at the expense of science.
Her statement is an entirely reasonable statement on the subject that has dominated discussion of climate change for the last thirty years. She’s saying, “we don’t know”. That doesn’t get her any brownie points from the warmists, and apparently only gets her snarky snide comments from the anti-warmists.
This is just science people – not politics. That’s what we all ought to applaud at all times.
Spot on!
No…I agree with Michael. I am also sure she knows the answer to what her model is predicting. There is only one reason to withhold that information…it would upset the powers that be!
If her model shows more warming, she would just come out and say it, for it would further enhance the threat from man-made global warming and she would be a hero of the left. Her career would be set and she could go on a speaking tour around the world with healthy compensation.
So it is safe to assume that her model indicates global cooling ahead and in the fairly near future. If it was 5,000 years from now, the AGW paradigm would be safe. If it shows cooling in the next few hundred years, it would make the warming paradigm a mute point, which would upset a large number of scientists, advocates and environmental groups.
I think it is safe to say that that she won’t say because her model shows global cooling is on the horizon.
Duane, you may be able to deceive yourself, but don’t try it on us.
Except for simply the scientific understanding, giving CO2 any role here is completely spurious.
CO2 emissions by man have been rising logarithmically over the last 50+ years while atmospheric CO2 has been increasing essentially linearly. If we are have no effect on atmospheric CO2, then we are having no effect on global temperatures. Done and Period!
The same is true for the other “radiative” (nicknamed “greenhouse gases” for political reasons. In addition, the other radiative gases are in much too low concentrations to have any detectable effects on anything.
I also do not accept her theory. It offers no explanation as to why there is a rapid 10 degreee rise in temperature over just a few thousand years, yet the decline back into an ice age takes tens of thousands.
“As for the future of the glacial cycle, that remains unclear, Lee says. It’s difficult at this point to predict how human contributions to Earth’s greenhouse gas concentrations might alter the future of Earth’s ice ages.”
Oh come on! Take a stab at it. NOAA, NASA & HADCRUT have no problem putting the frighteners on. sarc off.
heres hoping it does
But, 6 months from now, the bullies may be gone, and light can shine again. The communist/fascist hat-tip to them should be history then. Fingers crossed.
Finally, something other than gas. They still have way to trek though. The Pliocene-Early Pleistocene pattern reflects the 40 KY pattern, but it also shows a very steady cooling trend.
An interesting point is made by Patrick Moore about the decline of CO2 through the glacial cycles. Every ~ 100,000 years each new glaciation brings on LOWER levels of CO2. It’s a trend. The trend of declining CO2 goes back millions of years to before this glacial period. Its cause: CO2 hungry plants combined with a steady lessening of CO2 producing volcanic activity on the cooling (interior) earth. During the last glaciation we reached an all time low of ~ 180ppm. Juniper fossils from the La Brea tar pit and other evidence shows that that level of CO2 caused severe stress to plants: http://www.pnas.org/content/102/3/690.full?sid=5e3bdf35-c2a6-4fe7-b336-eea3917571f2
Moore makes the shocking point that the trend of declining CO2 is likely to continue and we’re quickly headed for CO2 reaching apocalyptically low levels where all plants and most animals die. Yet … Human CO2 emissions could actually forestall Armageddon by millions of years.
Here’s Moore’s video where he discusses the coming low CO2 apocalypse:
So true Eric.
For the sake of the planet and all that will live on it n the future, we absolutely MUST get over this moronic ANTI-CO2 agenda.
200ppm is dangerously low, and even the current 400ppm is barely sufficient.
CO2 and H2O are the basis of ALL LIFE ON EARTH…
.. and the sooner people come to realise this BASIC FACT the sooner the planet can progress as it should.
Raising CO2 levels to 700ppm or preferably 1000ppm MUST become an major priority.
But before that can happen, the Global Warming scam/agenda must be dead and buried, with a great big stake through its heart, like the EVIL vampire that it is.
Bravo.
Remember that EVERYTHING follows the “Goldilocks Principle”; “too much”, “too little”, and “just right”. I don’t pretend to know exactly where CO2 levels are in this respect, but I would wager that we’re closer to “just right” than we are to “too little”.
Ken,
Science does know what level of CO2 is just right. That would be the level in commercial greenhouses, ie 900 to 1300 ppm, at which concentrations C3 plants (including all trees and most crops) flourish. The world would green even further than it already has, thanks to more beneficial plant food in the air. If that also happened to make earth a little warmer, that too would be a good thing, as early AGW advocates Arrhenius and Callendar believed.
It’s amusing to speculate that in future man may finally master fusion and use the vast energy resource to break down limestone for the locked up CO2 in order to replenish our atmosphere. Perhaps mankind’s first purposeful act of Terra-forming.
Ken, where do you get the idea that .04% is “just right”? are you afraid the proliferation of flora at .1% will will photosynthesise away the atmospheric CO2 too fast, or what?
Ken, in the past when CO2 levels ranged from 5000ppm to 7000ppm, then the amount of CO2 was way, way too much?
Ken’s ‘Goldilocks Principle’ has an excellent pedigree in the biological sciences, and poses a few philosophical questions as well (the ‘anthropic principle’ has long fascinated me). Perhaps it is better to look at it the other way round. Optimum CO2 is very likely to be the present level – because it is the best level for the plants that exist today. If CO2 levels were more than halved, we wouldn’t necessarily have fewer plants, nor more stressed plants. Just different plants, living in their own goldilocks world.
Ill do a couple of laps arounf the block in the car this weekend, to do my bit.
mothcatcher
January 27, 2017 at 8:46 am
Four hundred ppm is far from the best level for plants which exist today. Two or three times higher would be ideal for C3 plants, the most significant to humans.
The important angiosperms (flowering plants) evolved under much higher CO2 levels, for example. They had probably been around for a long time earlier, but became suddenly abundant in the Cretaceous, when earth was much warmer (maybe four degrees C hotter) and CO2 was four or five times higher than now.
Quickly as in tens to hundreds of million years. Besides it could be postponed by plants adaptation to lower CO2 levels (like C4 plants).
Your alarmism is way over-hyped. Mammalian species last an average of perhaps 2 million years. It is not that we are not going to be around, our species is not going to be around to die for lack of CO2, har har.
>>Besides it could be postponed by plants adaptation
>>to lower CO2 levels (like C4 plants).
But C4 plants are not well adapted to cold condition, which is why extra-tropical trees and most of the grasses are still all C3. So low CO2 still causes great problems to agriculture and nature, even at the 180 ppm level.
R
“Mammalian species last an average of perhaps 2 million years. It is not that we are not going to be around, our species is not going to be around to die for lack of CO2, har har.”
Humans aren’t just another “mammalian species”. Even with our relatively fledgling genetic capabilities, we’re at the point where we can eliminate unwanted mutations. I’m sure there’ll be genetic drift as humans spread across the galaxy, but in principle there’s reason to think that some humans even a billion years in the future will be pretty well unchanged from humans of today. I expect machine augmentation will be a much more significant trend.
In short, homo sapiens is exceptional.
Javier
So you reckon plants are going to evolve a way to thrive at 100 ppm CO2?
That’ll happen around the time we humans evolve the ability to fly around like Iron-man.
Your reflexive conformity to alarmist dogma might paint you as a moderate “skeptic” but here you’re plain wrong.
Ptolemy,
Plants capable of surviving at CO2 levels below 100 ppm already have evolved, the C4 and CAM plants.
The problem is that they tend to be tropical. Corn (maize) varieties can be grown as far north as Canada, but it’s an exception among C4 crops.
http://archive.unews.utah.edu/news_releases/a-grassy-trend-in-human-ancestors-diets/
“C3 plants include trees, bushes and shrubs, and their leaves and fruits; most vegetables; cool-season grasses and grains such as timothy, alfalfa, wheat, oats, barley and rice; soybeans; non-grassy herbs and forbs.
“C4 plants are warm-season or tropical grasses and sedges and their seeds, leaves or storage organs like roots and tubers. Well-known sedges include water chestnut, papyrus and sawgrass. C4 plants are common in African savannas and deserts. C4 grasses include Bermuda grass and sorghum. C4 grains include corn and millet.
CAM plants include tropical succulent plants such as cactus, salt bush and agave.”
Potatoes are also C3 plants.
The Pleistocene megafauna of the steppe-tundra relied heavily on forbs, which must have been stressed at 180 ppm CO2.
Botanists believe C4 adaptation has evolved independently about 40 times in the last few million years. It is the only way to explain why it appears in so many distinct genre and families. The pressure to evolve C4 must be enormous. If this pressure continues in the next glacial periods, pretty soon (geologically), most plants will be C4 or some other CO2 efficient mechanism.
Ironman flies in an nonphysical way for thousands of km without any apparent need for fuel deposits, using tiny rockets. We are not going to fly that way any time soon.
“We are not going to fly that way any time soon.”
Killjoy.
C4 plants may well evolve to cope with colder temperatures. They do not do so today because under those conditions they can’t cope with competition from better-adapted C3 plants. Or maybe a third pathway wil open, given the long timescales involved.
Moth,
IMO a more likely way around the problem of falling CO2 levels will be genetically to modify C3 plants with C4 genes, allowing colder zone crops to deal with less plant food in the air.
http://bmcsystbiol.biomedcentral.com/articles/10.1186/1752-0509-6-S2-S9
Maybe it will also be possible genetically to engineer tropical plants to deal with colder temperatures and varying sunlight.
Either you don’t believe in evolution or you don’t understand how evolution mechanisms act. Evolution doesn’t stop for as long as there is differential reproduction of individuals. We are evolving now. Our brains are becoming smaller for the past 10,000 years. Our digestive systems are changing. Evolution never stops. Even if our species does well, there wont be any humans in two million years. It will be a different species, or several, as different from us as we are from Homo habilis. Or we could very well go extinct as most hominin species have done.
Javier We’re talking about CO2 levels going below 150ppm where ALL plants would die. And a timetable of hundreds of thousands of years, not tens of millions.
Eric,
All plants won’t die under 150 ppm.
C4 and CAM plants keep working, however poorly, down to very low CO2 levels.
No Eric,
We are talking AVERAGE CO2 levels. Scientists had to go to remote places to measure CO2 levels because there is so much variability that plants today are exposed to much lower and much higher CO2 levels over the course of a single day. When CO2 levels were low during last glacial maximum, plants didn’t die, they grew more slowly. But we know ecosystems continued working fine at 180 ppm, because there was no mass extinction. It doesn’t even look like we lost a significant number of species. Your alarmism that at 150 ppm everything is going to die is not supported by evidence.
And the scale is millions of years if you care to look at the rate of change of CO2 in geological past according to evidence and Geocarb III.
It is in the human nature to look at things and develop alarmist unreasonable fears about the future. A cursory look at the long list of past unfounded fears should vaccinate us against that, but it doesn’t. Christianity was founded on the belief that the end of the world was coming soon. And frankly the Phanerozoic reduction in CO2, that is currently being partially reversed is probably the absolute least of our worries.
I reckon we need to heat the planet up. A warm planet is a happy planet.
+1
‘Yet … Human CO2 emissions could actually forestall Armageddon by millions of years.’
You see the good Lord put us here to release all that locked up carbon in the ground so it could combine with the oxygen to keep the Garden of Eden healthy. Whoda thunk it listening to all those Devil’s disciples eh? Praise the Lord and pass the keys to the new Heavenly V8 chariot.
STEPHEN H. SCHNEIDER HAD EXPLAINED IN 1971 WHY UP TO 10 TIMES ATMOSPHERIC CO2 WILL NOT CAUSE A RUNAWAY GREENHOUSE EFFECT:
. . It is found that even an increase by a factor of 8 in the amount of CO2, which is highly unlikely in the next several thousand years, will produce an increase in the surface temperature of less than 2°K. However, the effect on surface temperature of an increase in the aerosol content of the atmosphere is found to be quite significant. An increase by a factor of 4 in the equilibrium dust concentration in the global atmosphere, which cannot be ruled out as a possibility within the next century, could decrease the mean surface temperature by as much as 3.5°K. If sustained over a period of several years, such a temperature decrease could be sufficient to trigger an ice age!
* * *
Fig. 1 [omitted]. Change in tropospheric temperature as a function of the amount of CO2 in the atmosphere. The dashed curve is computed for constant surface absolute humidity, and the solid curve is for the case in which the surface relative humidity is maintained constant. Note that the rate of temperature increase diminishes with increasing CO2 in the atmosphere.
* * *
From our calculation, a doubling of CO2 produces a tropospheric temperature change of 0.8°K (12). However, as more CO2 is added to the atmosphere, the rate of temperature increase is proportionally less and less, and the increase eventually levels off. Even for an increase in CO2 by a factor of 10, the temperature increase does not exceed 2.5°K. There¬fore, the runaway greenhouse effect does not occur because the 15μm CO2 [solar radiation] band, which is the main source of absorption, “saturates,” and the addition or more CO2 does not substantially increase the infrared opacity of the atmosphere. But if the CO2 concentration in the atmosphere becomes so high that the total atmospheric pressure is affected (which will require a CO2 increase by a factor of 1000 or more), then the absorption bands will broaden and the opacity will in¬crease, and the temperature may start to rise so rapidly that the process could run away (13). However, this appears to be only a remote possibility for Earth, even on a geological time scale, as a large buildup of CO2 in the atmosphere will be severely restrained by its interaction with the oceans, the biosphere, and the crust (14).
(From “Atmospheric Carbon Dioxide and Aerosols: Effects of Large Increases on Global Climate,” by S.I. Rasool and S.H. Schneider [of the Goddard Institute of Space Studies], Science Magazine, vol. 173, 9 July 1971, pp. 138-141.
I’m on this train, unlocking CO2 and recycling it into the atmosphere, a green planet is a happy planet.
I agree Eric. I corresponded with Patrick many years ago on CO2 starvation, and posted on wattsup and elsewhere since about 2008 – here is one such post.
I have since learned more about C3, C4, and CAM plants, btu the problem is still much the same.
Best to all, Allan
http://wattsupwiththat.com/2009/01/30/co2-temperatures-and-ice-ages/#comment-79426
(Plant) Food for Thought (apologies – written too late at night)
Background:
http://www.planetnatural.com/site/xdpy/kb/implementing-co2.html
1. “As CO2 is a critical component of growth, plants in environments with inadequate CO2 levels – below ~200 ppm – will cease to grow or produce.” (2017 Note – I would now write ~150ppm not 200ppm)
http://en.wikipedia.org/wiki/Carbon_dioxide_in_the_Earth's_atmosphere
2. “The longest ice core record comes from East Antarctica, where ice has been sampled to an age of 800 kyr BP (Before Present). During this time, the atmospheric carbon dioxide concentration has varied by volume between 180 – 210 ppm during ice ages, increasing to 280 – 300 ppm during warmer interglacials…
… On longer timescales, various proxy measurements have been used to attempt to determine atmospheric carbon dioxide levels millions of years in the past. These include boron and carbon isotope ratios in certain types of marine sediments, and the number of stomata observed on fossil plant leaves. While these measurements give much less precise estimates of carbon dioxide concentration than ice cores, there is evidence for very high CO2 volume concentrations between 200 and 150 myr BP of over 3,000 ppm and between 600 and 400 myr BP of over 6,000 ppm.”
Questions and meanderings:
According to para.1 above:
During Ice ages, does almost all plant life die out as a result of some combination of lower temperatures and CO2 levels that fell below 200ppm (para. 2 above)? If not, why not?
Does this (possible) loss of plant life have anything to do with rebounding of atmospheric CO2 levels as the world exits the Ice Age (in combination with other factors such as ocean exsolution)? Could this contribute to the observed asymmetry?
When all life on Earth comes to an end, will it be because CO2 permanently falls below 200ppm as it is permanently sequestered in carbonate rocks, hydrocarbons, coals, etc.?
Since life on Earth is likely to end due to a lack of CO2, should we be paying energy companies to burn fossil fuels to increase atmospheric CO2, instead of fining them due to the false belief that they cause global warming?
Could T.S. Eliot have been thinking about CO2 starvation when he wrote:
“This is the way the world ends
Not with a bang but a whimper.”
Regards, Allan 🙂
Eric,
Thanks for posting, I watched the entire video this morning and it was enlightening.
Of course the question that should be asked, is why if the main cycle is around 20,000 years long, we don’t have ice-ages every 20,000 years. And the answer is very simple: orbital cycles are merely a trigger for some other mechanism. In other words, the main period is not set by the orbital cycle, but instead the small changes due to an orbital cycle just “take us over the edge”.
(See Caterpillar effect for my own take on it).
That sounds like a valid point Scottish Sceptic.
One small problem re insolation during variable distances from the sun on earth’s elliptical orbit, the actual difference is too small to measure (NH winter, sun is closest) , although it “should” be significant. Willis noted this in one of his articles. Something else is happening in the atmosphere or the ocean surface response to attenuating the effective heating expected.
Water vapor regulation to dew point.
Good point Scotty. And the answer is in my post below:
https://wattsupwiththat.com/2017/01/27/100000-year-ice-age-cycle-linked-to-orbital-periods-and-sea-ice/comment-page-1/#comment-2409387
R
No – the answer is in the article above. It is the combination of precession and the maximum of eccentricity which creates the conditions for maximal southern sea ice growth. Please read the whole article – not jsut the intro then dive off into your theory-de-jour.
This article confirms that classic Milankovich is quite adequate to explain glacial cycles (with the paradigm of a periodically forced nonlinear oscillator) and the menagerie of alternatives – that you always get on these threads – are just muddled thinking.
Those cycles always existed and didn’t cause Ice Ages up until the earth’s ocean circulatory system was greatly reduced when North and South America joined up.
EMS,
Yes, Milankovitch cycles have always existed. NH ice sheets formed when the Americas were joined, altering oceanic circulation. SH ice sheets however had already long existed, again due to oceanic circulation.
It’s common to consider that the current ice age began in the Pleistocene, because of NH glaciations, but it really started in the Oligocene, 34 Ma, with Antarctic glaciation.
No – the answer is in the article above. It is the combination of precession and the maximum of eccentricity which creates the conditions for maximal southern sea ice growth. Please read the whole article – not jsut the intro then dive off into your theory-de-jour.
_________________________________________
Err, my ‘de-jour theory’ is an entire peer-review paper. And the article above is wrong, because it still cannot explain the missing precessional cycles. If interglacials are modulated by precession, then ALL the strong precessional-insolation cycles should produce an interglacial, and they do not. Ergo, my friend, the paper cited here is so incomplete it is totally wrong.
R
Gloateus, EMS
You tectonists seek to explain Antarctic glaciation by OPENING of a seaway and Arctic glaciation by CLOSING.
Antarctica was glaciated very nicely on the Carbo/Permian when the continents looked like this:
Meridional ocean heat movement is what must be restricted, not zonal flow. The Bearing Strait is more important than the Isthmus of Panama.
Gymno,
Why is it a problem that Oligocene Antarctic glaciation was caused by the formation of deep channels in the Southern Ocean and the Pleistocene NH glaciations by the formation of the Isthmus of Panama?
The fact is that those glaciations followed those events, and there are good geophysical, atmospheric and oceanographic reasons why the tectonic events would have had those effects.
The Carboniferous glaciation also took place when there was land over the South Pole. In that case, ice sheets spread from there to lower latitudes. Antarctica didn’t need to be isolated from other continents. Antarctica already had glaciers in the Eocene, but they didn’t form ice sheets until after the formation of the Southern Ocean.
Same goes for the Ordovician-Silurian glaciation.
And, speaking of the Ordovician glaciation, its Milankovitch cycles are well-recorded and obliquity ruled then, too. From “Stratigraphy” last year:
http://www.micropress.org/microaccess/stratigraphy/issue-323/article-1974
Milankovitch cycles in the Juniata Formation, Late Ordovician, Central Appalachian Basin, USA
Linda A. Hinnov and Richard J. Diecchio
ABSTRACT: The Juniata Formation is a thick succession of prevalently red, cyclically bedded arenites, wackes, and mudrocks found in the Upper Ordovician of the Central Appalachian Basin, USA. In outcrops close to the study area, the Juniata cycles predominantly have the characteristics of regressive tidal flat deposits. Long and continuous well logs of the subsurface Juniata provide an unparalleled opportunity to investigate Milankovitch controls on the cyclic deposition. In the Preston 119 well, northern West Virginia, a 2700-ft long gamma-ray well log provides a high-resolution proxy of terrigenous siliciclastic flux to the northern Central Appalachian Basin shoreline, from the early Maysvillian (Reedsville Shale) to the Ordovician/Silurian transition (Tuscarora Sandstone). The gamma-ray cycles provide strong evidence for sea level oscillations forced by Milankovitch cycleswith a dominant obliquity component. The strong obliquity signal is reminiscent of the obliquity forcing of Oligocene climate and sea level following the glaciation of Antarctica. The Late Ordovician world analogously experienced glaciation of Gondwana, which straddled the South Pole; this may have involved ice sheet dynamics that generated obliquity-paced sea level oscillations that affected Late Ordovician shorelines worldwide. This Milankovitch-forced glacio-eustatic record from eastern North America joins other suspected Milankovitch-forced successions reported from the Late Ordovician of northern Africa, northwestern Australia, Scandinavia, and northeastern and eastern-central North America.
Correction to my above 2009 post address:
https://wattsupwiththat.com/2009/01/30/co2-temperatures-and-ice-ages/#comment-79524
Also, “but”, not “btu” 🙂
I’m with CO2isnoEvil that the ice core records are the best data available on the long term climate. As yet, there is nothing to show that the current warm period is out of line with anything in the past.
The important features I see in the Law Dome C record are:
1) just about every warming period happened very abruptly in geological terms- it took as little as 1-2000 years for the temperature to climb as much as 15degC.
2) In most cases the temperature immediately began to drop in fits and starts, sometime very large fits of cold followed by re-warming to some extent.
3) The latest warming shows up at ~15,000 years. Like a couple of other previous peaks, it has not started a steady drop as yet.
4) All the low temperatures were within 5degC or so. The last cold period just before the current warm period spent an extended period right down near the bottom of the chart for 20-25,000 years at ~-8degC anomaly.
5) The latest warming period is by far not a record. 3 of the 4 temperature rises that broke the 0degC anomaly spent roughly 10-20,000 years above 0.
6) The fourth peak back spent multiple thousand years around 280-300ppm.
7) The only ‘anomaly’ in the graph is the current era 326ppm of CO2 in the recent past. Not having read a detailed account of how this number was obtained and that it is in the recent part of the core it may have been contaminated by diffusion before turning to solid ice.
My congratulations to all the scientists that obtained and analyzed this ice core in exemplary scientific fashion.
The answer is even simpler than that. The main cycle is not the 20,000 cycle. It has never been. Precession doesn’t drive the glacial cycle.
“The main cycle is not the 20,000 cycle. It has never been.”
Correct. The most visible cycle is from the variability in the tilt of the Earth’s axis which is about a 40K cycle, which was the period of glaciations prior to about 500K years ago. How deep an ice age gets depends on the relative phases of the other orbital effects. It just happens that the 40K effect has been roughly aligning with the 100K effect during the last 500K years, but the alignment has been slipping away and is why this interglacial is several degrees cooler and significantly longer than the last one.
CO2,
Except that the Holocene hasn’t yet lasted longer than the Eemian, though it well might. Much longer if the eccentricity advocates are right.
But it has been cooler than the Eemian, despite lack of a Neanderthal industrial age.
co2isnotevil,
I agree, but
The Holocene is on track to last the average duration of an interglacial, as the Eemian lasted.
In my opinion the Holocene wasn’t warmer because summer 65°N insolation has been about 20 W/sq m lower than Eemian, which is a lot, and because Holocene deglaciation was sabotaged by the Younger Dryas.
http://i.imgur.com/eMBfTte.png
Here is the domeC raw data for temp and CO2.
http://www.palisad.com/co2/ic/d_temp+co2.gif
This next plot smooths domeC data to 22K years to remove the perihelion and other shorted term signals and plots it with orbital eccentricity and axial tilt where the correlation with axial tilt is unmistakable.
http://www.palisad.com/co2/ic/orbit.png
Javier,
IMO the Dryases might have been more pronounced than similar fluctuations during prior terminations because there was more ice after the long Wuerm/Weichselian/Wisconsin glaciation, especially with its pronounced glacial maximum. This meant larger meltwater fluxes when ice dams retreated or broke, disrupting ocean circulation more.
Gloateus,
the Dryases might have been more pronounced than similar fluctuations during prior terminations because there was more ice after the long Wuerm/Weichselian/Wisconsin glaciation, especially with its pronounced glacial maximum. This meant larger meltwater fluxes
It is certainly a possibility. However one would expect a faster sea level rise prior to or coincident with the YD if large meltwater pulses (MWP) were involved. That was not the case. YD showed a reduction in sea level rise rate (figure D below from Lambeck 2014), and MWP 1A took place several thousand years before, and MWP 1B afterwards.
http://www.pnas.org/content/111/43/15296/F4.large.jpg
It is likely that several factors contributed to create the conditions for the YD. We know that there was a low of the 2400-yr Bray Solar cycle at ~ 12800 BP, as the cosmogenic isotopes record reveals. That would be the first red arrowhead in the figure.
http://i.imgur.com/niNSwIr.png
However the effect of a 2400-yr solar low is not so long. Due to IRD deposition it looks like YD is related to Heinrich events, but we do not know what causes Heinrich events. The duration is adequate for a Heinrich event, and it ends in a D-O oscillation at 11,700 BP that it is at the right periodicity point for its 1470-yr beating.
The YD doesn’t register much in sea level rise, and in LR04 benthic stack, and it is much less conspicuous in Antarctic records, Its importance is very much influenced by its very strong presence in Greenland records that don’t extend past the Eemian. If analog YD-like events have taken place at other deglaciations we might not know. The resolution of our records goes down a lot when they get older than 150,000 years.
IMO sea level didn’t rise despite the meltwater because the colder climate caused ice growth soon after the pulse.
There are some good explanations for Heinrich events which would also apply to the Dyrases.
If the meltwater came in part from floating ice shelves, the effect on sea level would also not be noticed despite the influx of a lot of cold fresh water into the oceans.
That is a better argument for why we wouldn’t see it.
Do you have any info on that? I am interested. The three theories that I know (from Hemming 2004), binge-purge, meltwater pulse, or ice shelf collapse do not look very capable of explaining the prior cooling and glacier growth that accompanies the early phase of Heinrich events.
Javier,
Info, not so much. Opinions, yes.
Mine is akin to the suggestion of Alley, et al, 2006. It has always seemed to me that expansion of the ice sheets alone can account for the iceberg armadas. During cold, stadial intervals, the sheets just get as big as the can without large edge chunks calving into the sea.
Alley, R.B., Dupont, T.K., Parizek, B.R., Anandadrishnan, S., Lawson, D.E., Larson, G.J. and Evenson, E.B. 2006. Outburst flooding and the initiation of ice-stream surges in response to climatic cooling: a hypothesis. Geomorphology 75: 76-89.
Another hypothesis, after Flückiger, et al, 2006, has to do with oceanic processes rather than the land ice itself.
Flückiger, J., Knutti, R. and White, J.W.C. 2006. Oceanic processes as a potential trigger and amplifying mechanism for Heinrich events. Paleoceanography 21: PA2014.
Summaries:
https://www.ncdc.noaa.gov/paleo/abrupt/data3.html
From 2011:
https://www.ncbi.nlm.nih.gov/pmc/articles/PMC3250121/
Again, this is a layman’s question, but if we’re talking about an orbital cycle – basically a much larger cycle being a major influence on long-term climate trends – rather than small changes you suggest resulting from the Earth’s own orbit, what about the effect of even larger orbits, such as the solar system’s position in the larger galaxy, and that sort of thing?
If you’re a flea on a dog, the dog has a (fairly) stable internal climate, but the dog itself might run through the snow, or jump in a stream, or lay down in front of the fireplace – the flea will experience a wide range of effects, which actually has little to do with the dog’s own changing metabolism.
Nir Shaviv´s, et al, cosmoclimatologic hypothesis posits that the solar system´s journey around the galactic barycenter produces periodic ice ages.
It is an interesting hypothesis, but I think it predates Nir Shaviv by a little.
Apparently it originates in Fred Hoyle’s work of 1939:
The effect of interstellar matter on climatic variation
https://www.cambridge.org/core/journals/mathematical-proceedings-of-the-cambridge-philosophical-society/article/div-classtitlethe-effect-of-interstellar-matter-on-climatic-variationdiv/0EA53316502FBA0B9D8FD21A62D7FF68#
And it was already old news in the early 70’s when several groups defended it, with W.H. McCrea as one of its main proponents:
Ice ages and the Galaxy
http://www.nature.com/nature/journal/v255/n5510/abs/255607a0.html
We think we have just discovered everything, and considering that we know how to read and write we should be more aware of what our predecessors achieved.
Griff and tony will arrive in 3..2..1..
THE ARCTIC WILL SEE THE LOWEST LEVEL OF ICE COVERAGE IN HISTORY!!!!!
(Griff asked me to fill in for him – NOT!!!)
Yah and in terms of Arctic ice coverage history is the last 40 years. The planet warms and cools cyclically correlating with solar cycle changes.
Fortunately/Unfortunately the solar cycle has been interrupted. The cooling will start when coronal holes on the sun abate.
The coronal holes create repeating solar wind bursts. The solar wind bursts create a space charge differential in the ionosphere which in turn causes there to be potential different between the poles and the equatorial region. The potential difference causes a current flow which changes the cloud amounts and cloud properties in both regions which in turn causes warming at both locations. The solar wind burst mechanism is called electroscavenging.
Enric Palle calculated in a 2008 paper that based on observed changes in cloud cover that the warming caused by cloud changes in the 40 to 60 latitude regions was 7 watts/m^2 as compared to 3.5 watts/m^2 for the incorrect assumed warming for a doubling of atmospheric CO2.
After months and months of talk about the warm Pacific blob there is now a cold Pacific blob which of course is not mentioned in the liberal press.
http://www.ospo.noaa.gov/data/sst/anomaly/2017/anomnight.1.26.2017.gif
And a fine job you’re doing. Keep up the good work. 🙂
‘After months and months of talk about the warm Pacific blob there is now a cold Pacific blob which of course is not mentioned in the liberal press.’
And soon SH summer is over without recharging its ocean batteries to full capacity .
It has certainly been cold around New Zealand.
These guys are getting truly eccentric !
Its almost like its some sort o mental dementia. !
A long and slow depletion of Earth atmosphere could also be a cause of Earth getting gradual colder last 30 million years?
Since evidence (citation needed) indicates that earth ( and Mars) started out 4.5 Byrs ago at 200 – 250 atm this makes at lot sense.
You made me curious, so I looked for citation and only found this:
http://teachertech.rice.edu/Participants/louviere/history.html
but also found this, indicating that atmosphere dropped to 2.5 atm during the next 2 Byrs. Thanks for the spark.
http://faculty.washington.edu/dcatling/Som2012_Raindrop_Imprints_incl_Suppl.pdf
Although that would not explain previous, even worse ice ages during the past 2.5 billion years.
But does this paper say anything about the current state of the poles? I’m wondering if this cycle they found also explains sea-ice levels, considering we should be somewhere near the end or bottom of the cycle?
Here’s a free paper you might find interesting.
http://www.sciencedirect.com/science/article/pii/S0277379113002953
I’ve only skimmed the abstract but it deals with west Antarctic ice sheet cycles, and I didn’t see a curtsy to carbon.
Why do they have to destroy their work with that stupid CO² rider at the end. It’s not a bad stab and there is something to a model that could predict the underlying effect of the M Cycles. There should be some fairly simple mathematics behind this work that they could use to explain their conclusions.
Hopefully this will be the last of such poor papers on the subject
‘Why do they have to destroy their work with that stupid CO² rider at the end.’
Well you’ve gotta throw in a bit of settled science when you’re out there busily discovering new stuff. That’s the way science works nowadays.
You are correct: it that makes the whole article more questionable. Cogent science doesn’t benefit from the CO2 argument.
Not sure I’m buying this. Every temperature reconstruction I’ve seen shows an abrupt transition from a glacial period into an interglacial period occurring at approximately 100K years, then a brief stay at warm temperatures before a long slow decline into glaciation. Glaciation is the norm, not the exception. This paper seems to have it backwards. They would need an explanation for why temperatures rise suddenly every 100,000 years, stay there for a few thousand years, and drops back down into glacial periods for the rest of the 100K year cycle. ,
Absolutely. Not only are warm cycles short they are very sudden. And the warmest part of the warm cycles aren’t at the middle, they are at the beginning and the warm surges get less and less warm as things cool down after around 10,000 years or so.
I’ve always had this as an explanation, it’s my thoughts, so hey.
This is Co2. My thinking is with a freezing point about 70F colder than water, if the planet lost it’s water vapor (ie it froze) you’d have the lower temp ghg’s in the atm.
With co2, say at the end of the interglacial all the vegetation sucks all the co2 out of the atm, and with a touch of a cold spell. you get a lot of polar ice, and less water vapor, cascades into a frozen earth, and the oceans cap a lot of the co2 in the oceans and under ice. Now, this last a long time, the little water just isn’t enough to kick the water cycle off. slowly, over time volcanism converts trapped carbon into a higher and higher level of co2, at some point co2 starts to warm the oceans/ice and it finally kicks the water cycle off, and it wakes up again.
Co2 props up water, but once water takes over, it takes over.
That’s why humanity is doing brilliant work by returning CO2 where it belongs, in the atmosphere. A green planet will eventually like a cancer kill the body it feeds on. Luckily this planet has volcanic activity because without it we would probably look like Mars.
Well, yes…
We know Milankovitch cycles affect arctic sea ice: the low in the Eemian was entirely down to the then cycle…
but now we have record low sea ice extent/thickness/volume and a change in weather patterns and in the winter too, not just at minimum.
and there isn’t any Milankovitch cycle influence and this is lower than the last sea ice cycle in the 20s through 40s and it is not recovering and it is trending down.
so what do we say is the cause of the current state and trend of the arctic sea ice?
climate change caused by human CO2.
There is no other causation in operation, is there?
It is called normal weather Griff. Nothing out of the ordinary.
Calling changes of this magnitude in a short period of time normal weather is not a valid explanation.
What changes of any magnitude the temperature has only risen 0.9 degrees C since 1880. Like man where’s my shorts. I’m sweating to death. 🙂 Get a grip people
But that’s the whole point, it isn’t normal weather.
The arctic has and has had all winter an enormously anomalous temperature… and a series of huge storms. Svalbard just saw its first year averaging above 0 C temps (reords from 1912). Alaska had its third year with a new temp record high.
What’s a short period of time and what’s the normal weather Chris? Forgive me if it’s a dumb question but I’m a bit slow at getting my head around these time spans and cycles just at present, so I need someone with the smarts to spell it out for me.
Griff, I’m not sure if you read the article, but they mostly mention the southern hemisphere sea ice as being the main player. Until this year, southern hemisphere sea ice was running at record highs. Let’s see what it does the next few years.
Also, there hasn’t been anywhere near as much warming in the southern hemisphere, particularly near the pole.
John, for a couple of years it ran at record highs -and there was an explanation for that in a shift in wind patterns/currents (which can be traced back to…). This year its below the long term trend by a large amount.
and you don’t offer an explanation or comment on the very real effects we do see in the arctic. The two poles are very different environments…
observa – 30 years is usually considered as sufficient to call it a climate trend rather than weather. We’ve had 37 of the sea ice satellite record (and a decade where ice has not recovered to its pre-2007 level)
“Normal weather” …. what a meaningless concept (no offense intended, Matt)!
How can anyone claim to know what “abnormal weather” looks like? Assuming such a chimera actually existed, it seems to me, you would need impeccable, real-time global data going back to the beginning of the current interglacial to determine this.
We don’t have that data and never can have it. We can’t even determine if the data we have from the past 100 years is reliable. (Apparently not, since it has to be “adjusted.”)
“Normal” weather therefore cannot be defined. That’s the beauty part of Climate Change(TM): it is only nominally data-dependent. In fact, it is barely data-constrained at all.
Normalcy is the hobgoblin of little minds.
“But that’s the whole point, it isn’t normal weather.”
So what is ‘normal weather’, genius?
“30 years is usually considered as sufficient to call it a climate trend rather than weather. ”
Only because that was the number of years that showed a warming trend when they chose it.
Griff, you know it was for more than a couple of years. It was almost a decade. Also, it hasn’t shown signs of any long term decrease in the satellite record. The loss of 2016 was a single event and it didn’t impact how the ice usually shrank (or make it worse) the remainder of the season. Now, I admit freely, if that keeps on happening and it becomes a new trend, it is concerning, but if it is a blip and southern sea ice keeps on as it was, you would need to admit that is is at least a distinct possibility that southern hemisphere sea ice (which was keeping the anomaly globally steady or in positive) is a much bigger player than the northern hemisphere . Therefore, it would be pure speculation to be putting things out there like “Well, we won’t have an ice age again, because of CO2. Look at the arctic”
So calling normal weather normal, is not acceptable to your religion?
“”But that’s the whole point, it isn’t normal weather.””
You’re absolutely right….
What we would call cold is the set point for this planet…
…warm is not normal
Cold and windy summer an ‘absolute reversal’ of last year
http://www.nzherald.co.nz/nz/news/article.cfm?c_id=1&objectid=11787096
New Zealand hit by ‘weather bomb’ bringing summer snow and flooding
https://www.theguardian.com/world/2017/jan/23/new-zealand-weather-bomb-summer-snow-flooding
If you suck cold air out of Antarctica in summer It can only be replaced by warm air from the north.
I have no argument whatever that we have warmed the planet with CO2. But I am still a very strong CAGW skeptic.
“I have no argument whatever that we have warmed the planet with CO2. But I am still a very strong CAGW skeptic.”
Wow, Evan, saying that here will usually have you figuratively tarred and feathered for such impertinence. However, it is a valid and sensible point, you must have at least a healthy share of Welsh genes and ancestry!
Did the Jones give it away?
Evan Jones, I completely disagree. CO2 is NOT a driver of temperature, over any time frame that you chose, the change in temperature has ALWAYS happened in advance of the change in atmospheric CO2 concentrations.
Saying that changes in atmospheric CO2 concentrations drives temperature is analogous to saying:
“The tail wags the dog.”
or my favorite;
“Lung cancer causes smoking.”
Furthermore, only in a lab environment can it be demonstrated that CO2 can even be minutely considered a “greenhouse” gas.
How do you explain 7,000 ppm CO2 during the Cambrian with global temperatures that were very conducive to plant and animal life.
How do you explain a glacial event (ice age) near the end of the Cambrian (450 million years ago) with atmospheric CO2 concentrations TEN TIMES current (4,000 ppm vs. 400 ppm).
How do you explain a glacial event at the end of the Jurassic (144 million years ago) with atmospheric CO2 concentrations FIVE TIMES current (2,000 ppm vs. 400 ppm).
CO2 does not drive temperature. It physically cannot, the First Law of Thermodynamics very clearly demonstrates this.
Gareth, why do you find it necessary to lie about what others have been saying?
Is your own position really that weak that you have to create strawmen in order to convince yourself that your life is worth living?
This is a competition in throwing darts: Turn your dart board to the side that shows radial segments numbered randomly from 1 to 20 and start throwing!
Your SWAG system to determine how much humans have warmed the planet with CO2 is now in place!
(And if you accidentally hit a high number, say 18-20, you can publish and get funding from the CAGW trough).
I’m not kidding folks: the argument isn’t about whether humans have contributed to warming, the argument is HOW MUCH.
Is it 0.003%? 0.03%? 0.3%? 3.0%? 6.0% 12.0%? (The first three numbers aren’t even on the dart board, sorry–but if you’re a lousy shot and miss the dart board completely, that guess may be the actual amount.)
Get your dart board and start tossing away.
RockyRoad, there is no correlation whatsoever that demonstrates that CO2 changes the atmospheric temperature.
NONE.
And even at peak CO2, at 7,000 ppm, if you consider that to be a BIG number, then what about the other 993,000 ppm, isn’t that a REALLY BIG number?
So please tell me how, at a measly 400 ppm, that this TRACE molecule in our atmosphere (and that is all that CO2 has EVER been) can somehow magically, mysteriously, dominate the other 999,600 ppm.
Truly a miracle molecule, but not for THAT reason. The miracle is that all plant life can extract that one molecule out of 2,500 for plant life/growth. That is the miracle, not how it can physically impose its will on the other 2,499 molecules that exist along side it.
That’s my point, Darrel.
Did you read the description of my SWAG (Scientific Wild Ass Guess) dart board “calculator”?
Duly noted and thank you for the response.
There are times (and some on this site would say lots of times) where I am not the sharpest knife in the drawer. D’oh!
There is no other causation in operation, is there?
Oh Dear.
How Sad.
Never Mind.
Griff, a complete believer in Climate change based on feedback, is apparently unaware of how causality in time delayed negative feedback governed systems actually works.
He can’t even get to the simple case that e.g. blowing over the mouthpiece of a flute ’causes’ sounds.
These wild fluctuations in the air pressure at the flute holes have to be ’caused’ by something eh griff?
It couldn’t be that massive amounts of energy moving from the equator towards the poles where they get radiated away into space, moving past mountains and ocean basins and shelves and coasts and the like, don’t do so smoothly and linearly in the way someone who has never even got past O level mathematics can understand, but are subject to eddies, turbulence, and all sorts of ‘noisy’ variations in flow…
I probably blame Tony Blair and Socialism for making people with less than half a brain – but brimming with ’emotional intelligence’ – think that they can actually understand mathematics that leaves top PhD graduates in applied maths stumped.
Perhaps we need to add a days lesson in ‘self causation’ to the average snowflake syllabus.
Sometimes Griff, its enough to say that the trickle of verbal diarrhoea emerging from someone’s mouth isn’t caused by anything other than that is simply the way they are made.
@ur momisugly Leo Smith
“I probably blame Tony Blair and Socialism for making people with less than half a brain – but brimming with ’emotional intelligence’ – think that they can actually understand mathematics that leaves top PhD graduates in applied maths stumped”.
That’s a pretty breathtaking statement to make there Leo in light of the fact that the vast majority of climate scientists ( yes, with Doctorates etc) actually support standard climate science, while the opposing charge is led by far fewer people with scientific credentials as well as people like Monckton who lets face it, is not the sharpest knife in the draw. By the way, if you had any understanding of UK politics you would be aware that Blair was not a socialist in any real measure, he just had some socialist ideas such as universal healthcare and education. Willis would never class such people as socialists.
I don’t see any causation for the change (increased melting, continuing decline) referenced in what you wrote.
Its not variation, its a clear trend down. And a change from the past.
when something changes and heads determinedly in a new direction, there’s a reason for it, a cause.
Once again, the only way Gareth can win an argument is by telling massive lies.
A trend of 30 years is meaningless, not in a world with known climate cycles that range from 70 to several hundred years.
You are seeing what your handlers tell you see. As always.
Griff,
You couldn’t forecast the amplitude of a Sine wave. Your linear extrapolations are worse than useless.
I always wonder who blows in Griff’s ear to make the words come out of his mouth.
Griff,
You are understandably mistaken about what is going on, because you lack a long term perspective.
Climate variability is subdued during interglacials and it is much higher during glacial periods. As the world cools down, climate variability increases. We know of similar warming periods at the end of other interglacials. A warming period is expected after every significant cold period, so that is what we got.
We have helped warm the world with our emissions, but we mistakenly think that all the warming is due to that, when a big part is still the natural reaction to the Little Ice Age.
http://i.imgur.com/gNxrjnO.png
We are lucky to be at the position marked by the asterisk. Conditions are likely to be nice for a few centuries. Glacial inception could take place in about 2000 years.
If you think that is not the case you just have to compare our interglacial with the average of seven previous interglacials.
http://i.imgur.com/1n9EY8W.png
Excellent Javier, +10
The long term trend should be we are heading slowly into the next glaciation… except we torpedoed that one and put it off a few thousand years.
you offer no explanation for the rapid and continuing downward trend in the last century, increasing in recent decades.
why this? why now?
>>As the world cools down, climate variability increases.
Yes, Javier, but you do not understand why. The answer is that the Achilles-heel of an ice-age world is albedo. If you can darken the ice it will melt very rapidly, as you know. So the answer to all these problems is not simply orbital cycles, it is dust and albedo – as I explain in my post below:
https://wattsupwiththat.com/2017/01/27/100000-year-ice-age-cycle-linked-to-orbital-periods-and-sea-ice/comment-page-1/#comment-2409387
R
Griff,
So some believe. But they are the type of people that always think that this time is different (just because they are there). It never is. The next glaciation will arrive on schedule.
You mean upward? I already did. It is part natural and part anthropogenic. Isn’t it obvious to everybody?
Again you lack long term perspective. For about 400 years since the bottom of the LIA it is the turn of warming. That is why, and why it is now. In about 200-300 years it will be the turn of cooling. If the cooling doesn’t arrive then, I will be surprised.
Succinct presentation, Javier!
But Griff will fail to understand it…. he will again focus on the short term.
There is none so blind as he who will not see!
Griff says, “and there isn’t any Milankovitch cycle influence and this is lower than the last sea ice cycle in the 20s through 40s”
Do you have the data? Can you post it?
This article refers to, summarises and then links to the collection of historical data which proves we have now a record low.
https://www.carbonbrief.org/guest-post-piecing-together-arctic-sea-ice-history-1850
I refer you also to part 3 of the historical sea ice series on Judith Curry’s blog, where you’ll find best estimate there of low in the 20s through 40s period given as lower than 2007 low extent.
So basically no variation until recently. uh-huh.
Griff, makes you wonder how they sailed the Arctic in the 19th century. 😉
Griff,your link has some nice pictures and information in it,but utterly fails to make the case from 1850 onward,since the data resolution is very low and coverage of the region spotty.
Your claim of a record low is absurd,since YOU have been shown MANY TIMES,by published science research,that the Arctic for a few THOUSAND years had little to no Summer ice.
Stop being a liar!
Argumentum ad Ignorantiam.
“climate change caused by human CO2” is not the default.
“There is no other causation in operation, is there?”
Lack of evidence for one cause is NOT evidence for another.
No human caused climate change is not the default…
but it is the only explanation that fits when you see the default setting – none of the known standard causes- doesn’t produce the results we now see.
No Griff, it isn’t the only explanation that fits. We’ve seen a millennial cycle for the past 3-4 thousand years and with a positive AMO sitting on top of it we have everything we need to explain the changes. Of course, given this solid explanation all we ever see is you ignoring it. Why is that?
I love it when Griff displays his ignorance.
First the troll declares that this isn’t Argumentum ad Ignorantiam, then he declares that it must be CO2 because no other explanation fits.
Griff, you have started off my day on a high note.
Far from record low sea ice. It has been lower than now for most of the Holocene and prior interglacials.
Arctic sea ice is down from 1979, but that was near or at the height for the past century. Antarctic has been gaining for most of the past 40 years.
and it is lower than the period of the 20s through 40s last century too.
This points to the research which shows that:
https://www.carbonbrief.org/guest-post-piecing-together-arctic-sea-ice-history-1850
“First, there is no point in the past 150 years where sea ice extent is as small as it has been in recent years. Second, the rate of sea ice retreat in recent years is also unprecedented in the historical record”
So say “researchers” whose jobs depend on perpetuating the ho@x. The government lies. Maybe you didn’t know that.
But even if true, it’s only because the LIA ended c. 1850. The sea ice supposedly lost from 1850 to 1940 wasn’t from man-made CO2.
If you imagine that CO2 is responsible for an alleged decline in Arctic sea ice, then please explain why Antarctic sea ice made record after record from 1979 to 2014, before returning to average in 2015, thanks to the El Nino that year.
As always, Griff proclaims that one or two log entries during the last century is sufficient to tell us the state of the entire arctic with the same precision as modern satellites do.
Poor boy, he’s delusional.
Griff,
Somehow those “researchers” missed the satellite records of the 1960s and ’70s, which showed Arctic sea ice as low as recently in 1973.
http://kaltesonne.de/wp-content/uploads/2013/07/screenhunter_170-jun-15-11-10-1.jpg
And, guess what? The number four El Nino year since 1950 was 1972:
http://www.stormfax.com/elnino.htm
Humanity has little to do with it, except maybe soot. Ice fluctuates in natural cycles, with the oceanic oscillations. Slight changes in air temperature, not so much.
http://notrickszone.com/2013/07/17/analysis-shows-that-arctic-sea-ice-melt-extent-mostly-occurs-in-natural-cycles/#sthash.VFs0LUuo.dpbs
There is no reason to conclude humans are the benefactors behind current low ice. It’s all down to Mother Nature.
Griff
The core of your scam is to argue that just because paleo proxies of the distant past have low resolution, this means that climate was constant back then. An absurd fiction – “we cant see the high frequency variation back then so there was no high frequency variation back then”. It’s depressing how many folks fall for it.
I see you still have problems spelling AMO, Griff.
Griff: facepalm.
And the Antarctic (home of 90% of the glacial ice mass on the planet) is growing, on average, by 82 billion tonnes/year.
And the Greenland ice mass is growing.
And the glacier on Mt. St. Helens, WA, is growing.
And glaciers expand and contract, ALL THE TIME!
Here is a fascinating link from one of the very few climate experts on the planet, however since you are so deeply immersed in only considering what is happening in a single location on the planet, I understand completely if your perception on this topic does not allow you the permission to read something that completely contradicts your “beliefs”:
http://www.technocracy.news/index.php/2015/10/30/former-president-of-greenpeace-scientifically-rips-climate-change-to-shreds/
Here is a slightly modified extract that is worthy of reading, irrespective of your level of “permission” Griff:
CO2 is plant fuel, and they only reason that we are here is due to the fact that white rot fungi evolved to produce the enzymes that can digest lignin and coincident with that, was the end of the coal making era approximately 270 million years ago. There was no guarantee that fungi or any other decomposer species would develop the complex of enzymes to digest lignin, and if this did not occur, CO2 concentrations would have continued to drop to 150 ppm, at which point the majority of plant generation would have stopped, and the earth could have very well been a sterile planet for all life.
Griff, I have yet to hear from you (not that I ever will but don’t fret, I will continue to destroy your singular focus on a small piece of the planet) with regards to why out wonderful planet was able to not only sustain life, but for it to flourish with historical CO2 concentrations that were 3 to 10 times higher than current, and you cannot comprehend that our atmosphere is so very complex, that focusing on a single trace molecule and on a single area of the planet is so insanely absurd …..
And to answer a question posed of you in a previous topic, I personally prefer the “real” equation to the “ideal” one, however in the case of our atmosphere, z will be very close to 1 over the entire P range, so “ideal” is sufficient ……
You are the epitome of a troll Griff.
No. Trolls are clever. They trick people into reacting. Griff posts are not clever.
We are not at record low sea ice levels. Not even close.
AMO positive phase.
Griff January 27, 2017 at 2:34 am
“but now we have record low sea ice extent/thickness/volume and a change in weather patterns and in the winter too, not just at minimum.”
No we don’t.
You keep citing graphs based on guesstimates of an Arctic which has few actual temperature instruments.
This link shows a failed attempt by the Russians to ship cargo.
http://siberiantimes.com/other/others/news/n0857-blow-to-northern-sea-route-as-voyages-of-two-icebreakers-are-broken-by-ice/
The link is from Ice Age Now.
Oh and Griff, I hope that you and your little sea ice graph had no influence in their decision to try the passage.
I hear that the “Wet Affairs” desk rolled directly into the new and improved KGB. (FSB&SVR)
michael
Griff, when you fixate on CO2, does the diseconomy of strangling its release ever trouble you, or do you deny the economic and political power it gives to the few while inflicting waste and hardship on the many? If you are asking about other possible causes of warming, perhaps even some that don’t persistently lag temperature in sufficiently long and detailed records, you should know better.
The AMO.
It is difficult to explain because it is a mathematical artifact of averaging complicated by the irregularities in the glacial cycle. When you actually go and measure the distance between interglacials, what comes out is a cycle driven by obliquity, not precession or eccentricity, at multiples of 41,000 years.
http://i.imgur.com/sjVlDo8.png
Interglacials are separated by 82,000 years since the Mid-Pleistocene transition. Previously they were separated by 41,000 years but the world got too cold and started skipping one interglacial. When eccentricity is very high the world goes briefly back to 41,000 years. Sometimes the conditions that have to align for producing an interglacial do not align properly and the interglacial comes a little early or late, affecting its length (MIS 11, MIS 7a), or doesn’t come at all (MIS 3) producing a glacial period of 123,000 years.
And it doesn’t. The correlation between temperatures and precession is lower than the correlation between temperatures and obliquity.
Precession matters all the time since the Mid-Pleistocene Transition, because obliquity requires its help to produce an interglacial. When eccentricity is high an interglacial is produced at every obliquity cycle thanks to the effect of precession being higher.
Yes, why? The answer is that obliquity has the same importance. Occam’s razor is honored. We do not need a different theory for interglacials in the Early and Late Pleistocene.
They are once again mistaking the effect (sea ice expansion) for the cause.
If interested in the Glacial Cycle, check my article at Climate Etc., available here as a pdf:
https://sabercathost.com/4Df5/Nature_unbound_1.pdf
That is hugely disingenuous, Javier,
To get the Eemean glacial period down to 82 ky you have linked it to MIS 7c, which is NOT considered to be an interglacial. Which is preceded by a small 20 ky gap which is clearly precessional. And the marker over MIS 9 is also clearly wrong, because the preceding glacial period was 95 ky long. Measure it on the following graph.
Anyway, your assertion that obliquity modulates interglacials doubly falls flat on its face because the interglacials clearly do not align with the obliquity cycle. Look at the obliquity cycles 255 ky ago and 170 ky ago, which were clearly passing by each other like ships in the night, and nothing to do with each other at all. Look also at the obliquity cycles 170 ky and 50 ky ago, which had almost no effect on temperature.
Graph of obliquity (blue) vs interglacial temperature (red).
So even if you want to champion obliquity as the primary cause of interglacials, you are stuck in the same position as Prof Jung Lee (author of this paper) and all the other precessionalists – because not every cycle causes an interglacial. And until you can explain those failed cycles, you have a non-theory that has fallen off its perch and is probably pining for the fjords.
The answer to this conundrum is, of course, dust. As I explain in my post below.
https://wattsupwiththat.com/2017/01/27/100000-year-ice-age-cycle-linked-to-orbital-periods-and-sea-ice/comment-page-1/#comment-2409387
Ralph
Ralph,
You share with the authors of this study mistaking the effect for the cause. We know that dust is produced by deep glacial conditions, so the correlation is explained.
Explaining why not every obliquity cycle produces an interglacial is very easy. Don’t forget that in the early Pleistocene every obliquity cycle produced an interglacial, when dust was not playing any role, as deep glacial conditions were not reached.
In the late Pleistocene several conditions must be aligned to overcome the cold inertia of the planet. If they don’t take place the obliquity does not produce an interglacial. I explained it very clearly in my article at Climate Etc.
https://judithcurry.com/2016/10/24/nature-unbound-i-the-glacial-cycle/
A summary of conditions is in this figure:
http://i.imgur.com/rZGm1iu.png
Figure 12. A simple model of interglacial determination based on obliquity, insolation, and temperatures. Top, A window of opportunity takes place every time obliquity increases, marked with a colored bar, red when an interglacial results and blue when not. Middle, Insolation is proposed to promote interglacial conditions when above the red dashed line at 520 Wm2, during the second half of the window (red circles), or directly result in an interglacial when above the green dashed line at 550 W/m2(green circles). Bottom, Low temperatures are proposed to promote interglacial conditions when below the blue dashed line at 4.55 ‰ δ18O during the first half of the obliquity window (red circles). Numbers on top are periods of increasing obliquity with red numbers indicating an interglacial produced by favorable conditions (red circles), blue numbers indicate an interglacial was not produced due to unfavorable conditions (blue circles), and green numbers indicate interglacials produced by very high insolation despite unfavorable temperatures (green circles). MIS 13 (window 13) cannot be explained by this model, thus the question mark.
Ralph,
In the abstract of your recent paper, you meant “a critical” minimum “of about 200 ppm”, not ‘minima’, which is plural:
We present here a simple and novel proposal for the modulation and rhythm of ice-ages and interglacials during the late Pleistocene. While the standard Milankovitch-precession theory fails to explain the long intervals between interglacials, these can be accounted for by a novel forcing and feedback system involving CO2, dust and albedo. During the glacial period, the high albedo of the northern ice sheets drives down global temperatures and CO2 concentrations, despite subsequent precessional forcing maxima. Over the following millennia more CO2 is sequestered in the oceans and atmospheric concentrations eventually reach a critical minima of about 200 ppm, which combined with arid conditions, causes a die-back of temperate and boreal forests and grasslands, especially at high altitude. The ensuing soil erosion generates dust storms, resulting in increased dust deposition and lower albedo on the northern ice sheets. As northern hemisphere insolation increases during the next Milankovitch cycle, the dust-laden ice-sheets absorb considerably more insolation and undergo rapid melting, which forces the climate into an interglacial period. The proposed mechanism is simple, robust, and comprehensive in its scope, and its key elements are well supported by empirical evidence.
http://www.sciencedirect.com/science/article/pii/S1674987116300305
>>you meant “a critical” minimum “of about 200 ppm”.
Err, yes, quite possibly. But do remember that there is more than one critical minimum. Confused? I am…
R
>>Figure 12. A simple model of interglacial determination
>>based on obliquity, insolation, and temperatures
Javier, your fig 12 is a bit of a nonsense. You are comparing obliquity with Milancovitch insolation – but obliquity is already included in Milankovitch insolation. So you are conflating the obliquity function twice.
You then seem to indicate that rising obliquity can only cause an interglacial when the temperature is cold, but you do not explain why. What is the difference? And you still fail to explain the interglacial warming 240 ky ago, which has no obliquity associated with it at all.
Of course the real reason for low temperatures initiating an interglacial, is that CO2 concentrations also came down. It was low CO2 and the resulting dust that initiated the interglacial, not obliquity.
R
Obliquity is not included in Milankovitch insolation, as this is insolation measured at 65°N at the summer solstice. Obliquity affects both poles symmetrically and increases the entire melting season energy, not just 21st of June peak energy.
This is an observation, not an explanation. But essentially every negative feedback factor becomes stronger when at an extreme temperature. They all cooperate towards a faster warming when the melting starts. Dust is just one of them.
MIS 7e and MIS11, the short interglacial and the long interglacial explain themselves when you look at their astronomical signature. MIS 11 started too early respect the obliquity cycle and MIS 7e too late, and that explains their unusual length. Before MIS 7e started it was barely cold enough at the right time according to the obliquity cycle, but the very high eccentricity 240 kyr ago gave enough push to precession for a late start. Since it still ended when obliquity came down after the usual lag, it became a short interglacial.
http://i.imgur.com/nkDDwxF.png
It is explained at the article at Climate Etc. and here:
https://sabercathost.com/4Df5/Nature_unbound_1.pdf
The first question that occurs is ‘Does this enable a prediction of when the next ice age is due to start ?’
Scientific theories are validated by their prediction, and this is one question we would really like to be able to answer. Another ice age is due sometime, and that’s one type of climate change that we really should worry about – if it’s coming anytime soon.
Depends on what do you understand for soon. Is it 2000 years soon to you? For theory validation most scientists are not keen on waiting 2000 years to be vindicated.
Why is there no graph showing where we are in the cycles, along with a projection of where we are going on a time scale?
Absolutely! Enquiring minds want to know!
We do not have record low sea ice. Since we know very little about the Southern Hemisphere, there may be some speculation or conjecture as to whether the MWP, or the Roman Warm Period or the Minoan Warm Period were truly global, or whether they were limited to the Northern Hemisphere.
But we know as fact that the MWP, and the Roman Warm Period and the Minoan Warm Period all happened, as far as the Northern Hemisphere was concerned, and we know as fact that during those periods, Arctic sea ice, Ice in and around Greenland, ice/glacification in and around Norway were much lower than today.
But also recently, ie., during the 20th century there was less ice in and around the 1940s.
http://notrickszone.com/wp-content/uploads/2016/12/Holocene-Cooling-Greenland-Southeast-Hasholt-16-1.jpg
And from Ogi et al’s recent paper on greenland temperatures:
http://notrickszone.com/wp-content/uploads/2016/12/Holocene-Cooling-Greenland-Ogi16-copy.jpg
And the recent reconstruction of North Atlantic Sea temperature:
http://notrickszone.com/wp-content/uploads/2016/12/Holocene-Cooling-Irminger-Sea-North-Atlantic-de-Jong-16.jpg
There have been many papers published these past couple of years that suggest that today is no warmer than it was around the 1940s in and around high latitudes in the Northern Hemisphere.
There is nothing unprecedented about today’s level of ice in and around the Arctic basin.
“We do not have record low sea ice…”
But we do for the period of recent human history and very probably for the period since the Eemian.
we have the satellite record and very good records for the period before it… for example all existing records from 1850 have recently been collected and analysed from thousands of sources and we can see that current extent is much lower than any period since 1850.
and the trend is down.
We have less sea ice than would be the case without human caused warming, humand caused warming is contributing to its continued decline.
and that matters, because declining sea ice impacts the climate further…
Griff,
There is zero evidence that human GHGs have had any effect whatsoever on sea ice extent. If they did, the Antarctic would have declined since 1979 along with the Arctic.
Ice is low this year because of the super El Niño, not people.
Sea ice since 1979 is not in any way unusual. It’s normal for a warming cycle coming out of a cooling cycle like the LIA.
As noted, sea ice has been lower for most of the Holocene and prior interglacials, to include the Eemian.
Besides which, less drift ice is a good thing, as for that matter is more CO2.
Griff, I try to make sense of what I read. When argument boils down to assertions of “It is,” “It isn’t,” we can make progress, because the issue (whichever it is) is well defined. Based on what you just wrote, do I understand that you reject the accuracy of the Hasholt 2016 graph cited by Mr. Verney?
OK, my second blunder this week. Because Mr. Verney introduced the Hasholt graph with the line:
But also recently, ie., during the 20th century there was less ice in and around the 1940s.
I mis-read it as a graph of ice extend. But it is clearly labelled as a graph of temperature. Sorry bout that…
Griff, a handful of log reports over several hundred years do not constitute “very good records”.
Sorry, I was not as clear as I could have been.


As far as I am aware, prior to the satellite era, there is no quality data on the extent of sea ice since there was no easy way to track it, and the existence of which disappears as ice melts and is covered up as ice reforms.
One is therefore left to infer the extent of ice from temperature records, and this is the approach adopted. There is an assumption that the extent of ice is largely a function of the prevailing temperature, but weather patterns, particularly wind, can play a significant role at least over short periods. Ocean currents play a role but warm ocean currents usually influence land coastal temperature records so to some extent land temperatures pick up on the changeability of ocean currents.
So what I set out was temperature records.
Of course what we do know is that the Northern hemisphere cooled significantly from the highs of the late 1930s/1940 , viz:
The global cooling scare was built upon the back of the large fall in Northern hemisphere temperatures (variously assessed to be between 0.5 to 0.8deg C) and the growing extent of sea ice in the Arctic which reached a peak in the early 1970s (1873/4).
Thereafter, of course, there has been a decline in Arctic sea ice but given the temperatures that we have today, in and around the Arctic basin, are broadly no warmer than they were back in the 1940s, and given that North Atlantic Sea temperatures are not as warm as they were in the 1940s, it is reasonable to infer that the extent of sea ice that prevails today is not significantly lower than that in the 1940s, and every reason to suspect that there may well have been less Arctic sea ice in the 1940s.
Of course we also know that the Skate and the Nautilus both surfaced at the North pole in the 1950s without dynamiting the ice..
http://notrickszone.com/wp-content/uploads/2012/09/skate_north_pole.jpg
And it is worth looking at the Seadragon and Skate in 1962, and the amount of open water:
Compare the above photograph to the photographs of the three subs surfacing in 1987 where there is a lot less open water.
These photographs were taken in different months, so a great deal of care needs to be taken ovr reading too much into matters
But as I say, conditions today, are not unprecedented even comparing with last century. One does not have to go back to the conditions of the say the MWP or the roman Warm period etc.
MarkW, that’s actually hundreds of log reports and observations and records from Denmark, Russia Norway, US cold war submarines etc etc etc … a complete collection of the available evidence, carefully sorted and evaluated, and it is valuable, accurate and full data.
You might note that is ALL the data we have. And nowhere in ALL the data is there a lower point than now: there are many, many, many higher points.
Juan
It looks like a regional graph from Greenland?
I don’t reject it, but if we had comparable graphs across the arctic and for the arctic as a whole?
We certainly have that for the satellite record and you can see the trend – e.g.:
http://nsidc.org/arcticseaicenews/charctic-interactive-sea-ice-graph/
Chimp.
No. Just no.
Arctic and antarctic are different ice environments. They don’t respond in the same way.
We don’t have the same conditions as produced the Eemian, but have the lowest ice since.
Griff,
No, no and no-no.
Present ice is very far from the lowest since the Eemian.
As stated, for most of the Holocene, summer ice has been much lower than now. For thousands of years.
How this fact escaped you, I don’t know. You must have intentionally ignored the reality revealed by all the evidence, which is abundant.
Yes, the Arctic and Antarctic are different environments, but the air above them has about the same number of CO2 molecules. Explain please why Antarctic sea ice has surged since 1979, if man-made CO2 be the alleged cause for Arctic sea ice decline (which of course it isn’t).
Griff,
I guess you missed this blog post:
https://wattsupwiththat.com/2014/03/24/new-study-shows-arctic-sea-ice-extent-6000-years-ago-was-much-less-than-today/
Not only was Arctic sea ice extent much lower during the Holocene Optimum, c. 8200 to 5000 years ago, but also during the Egyptian, Minoan, Roman and Medieval Warm Periods.
Also before the HO, during the breakdown of perennial sea ice cover:
http://www.sciencedirect.com/science/article/pii/S0277379113004162
“Arctic Ocean sea ice proxies generally suggest a reduction in sea ice during parts of the early and middle Holocene (∼6000–10,000 years BP) compared to present day conditions. This sea ice minimum has been attributed to the northern hemisphere Early Holocene Insolation Maximum (EHIM) associated with Earth’s orbital cycles. Here we investigate the transient effect of insolation variations during the final part of the last glaciation and the Holocene by means of continuous climate simulations with the coupled atmosphere–sea ice–ocean column model CCAM. We show that the increased insolation during EHIM has the potential to push the Arctic Ocean sea ice cover into a regime dominated by seasonal ice, i.e. ice free summers. The strong sea ice thickness response is caused by the positive sea ice albedo feedback. Studies of the GRIP ice cores and high latitude North Atlantic sediment cores show that the Bølling–Allerød period (c. 12,700–14,700 years BP) was a climatically unstable period in the northern high latitudes and we speculate that this instability may be linked to dual stability modes of the Arctic sea ice cover characterized by e.g. transitions between periods with and without perennial sea ice cover.”
What was unusual in the Holocene was the greater sea ice extent of the LIA, which you somehow imagine to have been “normal” for this interglacial.
Griffy, thousands would still be inadequate.
Griffy, we have captains logs going back to the Eemian?
Fascinating.
Griff,
Note in Charctic graph that, as predicted, low Arctic sea ice this year from El Niño is headed back into the normal zone.
You still have not provided a shred of evidence for your ludicrously false, baseless assertion that present Arctic sea ice is lowest since the Eemian.
Nor told us why Antarctic sea ice set record highs up to 2014, if CO2 is responsible for lower Arctic ice after the abnormally high year 1979.
Antarctic and Arctic ice were affected by the super El Niño but that effect is fading.
Besides which, lower ice is good, not bad. Same as higher CO2. Double or triple present CO2 would be better.
We’ll have to employ the alarmists spray painting the Antarctic sea-ice black. Are they up to it?
I can’t find an on-line version of the full article. We will have to see the math here.
It is actually a plausible mechanism but the southern sea ice would have to increase to encompass a huge area (much, much larger than today) and then melt-back very little in the summer.
Basically, the southern sea ice has to increase by an amount which would drop global temperatures by about 3.0C or so. That would be enough to interrupt the summer snow melt in the far northern latitudes and then glaciers build up etc.
My Albedo calculator says that winter southern sea ice would have to get to almost 45S and summer sea ice would have be at least no lower than 50S or so. I don’t think the southern Milankovitch Cycles produce this kind of southern sea ice. A blurry image of the ice extent in the preview function for the article does not show it getting that far.
And then we have to see if the southern Milankovitch Cycle downdips match the timing. We need to see all that.
Even at the LGM, let alone at NH ice sheet initiation, Antarctic winter max extent reached only 48 to 60 degrees S, depending upon sector. The lower latitude figure was for the Atlantic and western Indian Oceans, so ice may have engulfed Tierra del Fuego, which extends down to 55 S.
Also the Falkland Islands, for that matter, at 51 to 52 S and much of Patagonia.
Seems to me that if southern sea ice grow enough to measurably cool the whole planet, then northern sea ice and land based ice would also start to expand which would increase the amount of cooling.
We wouldn’t have to rely on southern sea ice all by itself to cause all of the cooling.
I changed my mind, this is not a plausible scenario.
The ice ages always begin when there is big downdip in higher northern summer solar insolation. The 4 big downdips here that kicked off the last 4 ice ages are equivalent to when solar insolation at 75N falls below 440 W/m2 on June 21 (summer solstice) which is more-or-less the level that is needed to melt the winter snow.
Your winter snow melts out when the solar insolation gets to this level in the spring whatever that date is. At 75N, the summer solstice has about 530 W/m2 so we are nowhere near the level it takes. Eureka Canada at 80N loses its snow in early June and it comes back in early September. That, again, is 3 months of no snow which is nowhere near the level of starting another ice age.
http://s16.postimg.org/63v3fs8xx/Last4_Ice_Ages_Milankovitch.png
Once the glaciers get set-in at 80N and 75N, they start to reflect more and more sunshine until the ice age is inevitable.
It takes 2 or 3 good upturns in the summer Sun of the Milankovitch cycles to break the back of the glaciers. It is a complete fluke that they are roughly 100,000 year long in the last 3 or 4 ice ages. The 100,000 eccentricity Cycle is not correlated to that 100,000 time-frame at all. There is Zero correlation.
What is the most weird thing about the ice ages is that glaciers have no business being all the way down to Chicago. I mean there is no way that should really happen. The summer Sun here is a good 400 W/m2 higher than is needed to melt the winter snow or a glacier, even in the deepest downturns of the Milankovitch. It is only because everything north of it has Albedo of 75% to 90% that it can be cold enough in Chicago in the summer to let the glaciers get there and stay there for any period of time. Even 65N NEVER has a low enough decline to let glaciers exist here, even on Greenland.
Northern solar insolation at 75N is where the make or break sunshine varies enough so that there are periods when the sea ice and the winter snow does not melt.
Your conjecture fails at MIS 19 that with very similar northern summer insolation levels to ours got its glaciation, as every interglacial.
http://i.imgur.com/sRGiVg6.png
It is obliquity with a lag of several thousand years due to thermal inertia what determines glacial inception. Regardless of northern summer insolation levels.
We have for example MIS 7c, 215,000 years ago. MIS 7c got its glacial inception with the surprising amount of 530 W/sq m of 65°N summer insolation, 200,000 years ago.
http://i.imgur.com/OTIB0pY.png
It really demonstrates that 65°N summer insolation is irrelevant for glacial inception. When obliquity says it is time to go glacial, it is time to go glacial. And once you go glacial you don’t come back regardless of insolation, obliquity, or whatever, until everything gets properly aligned after going through a very cold glacial maximum. With low eccentricity like now, once we go glacial it will be at least 70,000 years before the next interglacial.
65N versus 75N.
Like I said, 65N never gets below the threshold. The event starts at 75N where solar insolation can get low enough.
So at 65N at MIS19, solar insolation falls to 480 W/m2 and the winter snow doesn’t survive the summer but at 75N you can can expect it to be 40 W/m2 lower and the sea ice and the snow doesn’t melt out in the summer.
Today, 75N is up to 560 W/m2 or so. The key is that once the snow and sea ice melts out in early June, now the full force of the Sun gets to have its effect.
Eureka Canada at 80N has a world-class climate research station. The solar radiation tower shows the data. Solar gets to 530 w/m2 at its peak. By early June, the snow melts and the full force of the Sun hits at that time. So, this is the true “sweet-spot” for the ice ages. Once the SW Down falls a moderate amount and the SW UP never falls and the SW Down – UP never gets to high levels the ice age is starting. These are REAL measurements.
>>What is the most weird thing about the ice ages is that glaciers
>>have no business being all the way down to Chicago. I mean there
>>is no way that should really happen.
You are forgetting the power of albedo. When the albedo hits 0.95, your 400 W/m2 becomes 20 W/m2. So now you know why ice sheets continue to extend, despite subsequent up-turns in Milankovitch insolation.
What you now need is a way of preventing that high albedo, to create an interglacial. And the mechanism that does that is dust, as I have explained elsewhere on this thread.
Ralph
Here is another visual to show one why there is just a small strip at the far northern latitudes that are the make or break location.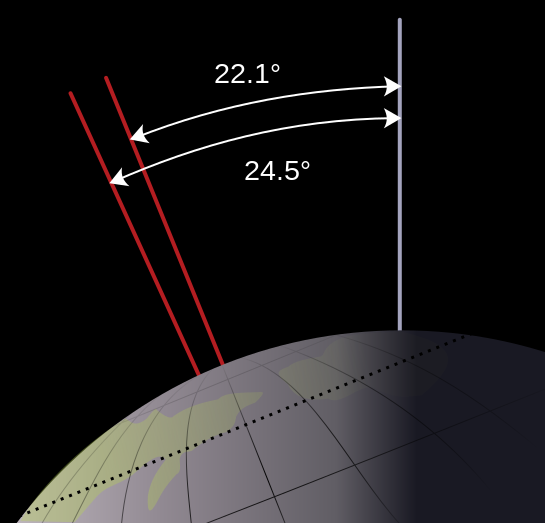
Look at the axial tilt changes. The more the tilt, the more the chance that the snow has to melt in the summer because the summer sun is just that little bit more overhead. (it is a good thing there is a tilt at all because without it, the ice and snow at the poles would never melt and the Earth would just be a white ice-ball.)
But look at the Earth surface where the two lines 22.1 degrees and 24.5 degrees are. The difference between where the two intercept the Earth surface is so small. 22.1 degrees ice-age on; 24.5 degrees ice-age off. The two points are only a several hundred kms apart.
The summer solar forcing in the summer varies between where you live and a community which is just a few hundred kms north of you. Like 3 hours drive. That is how tiny the differences are. It ONLY matters at the 75N-80N where these few hundreds kms difference of solar energy can be the make or break factor. (There’s more in the Milankovitch Cycles of course but this is the Major one – it was the key driver between 2.7 million years ago and 1.0 million years ago).
If all it took was tilt, then we’d be headed for the next glaciation within 10,300 years.
Obliquity is currently 23.44 degrees and decreasing at a rate of about 0.013° per century. (23.44 – 22.1 = 1.34 / .013 = 103 x 100 = 10,300.)
Of course ice sheet inception can occur before the lowest tilt angle, ie 22.1 degrees.
There is no threshold. Here you have the comparison at 75°N:
http://i.imgur.com/Dw9NHJB.png
So on that small difference you justify that MIS 19 got a glaciation but the Holocene won’t get it?
Everybody gets fixated on W/sq m, as if that was all. The climate however shows us that a lot of the effects do not depend on W/sq m. Precession determines the differential insolation on both hemispheres determining the position of the ITCZ, and the effect is huge enough to decide if the Sahara is a desert or a savanna. Obliquity determines the equator-polar gradient that decides on the poleward transport of meridional heat and humidity. That heat transport is not included in the calculations of W/sq m.
And we do know that when the obliquity cycle turns down and obliquity decreases, interglacials come to an end with a lag of about 6500 years. Anybody claiming an exception for the Holocene should first find an exception for this rule, and explain why it doesn’t apply to the Holocene.
Hmm, wrong on most counts I fear.
For a start there is NO 100 ky glacial-interglacial cycle. It is a 90 ky or a 115 ky cycle, which matches the precessional cycle very well. Here is a table of the last fice ice ages.
Precession cycles (kyr) … Cluster length (kyr) … Ice-age duration (kyr)
23, 21, 26, 22, 25 …………..117 ………………………..117
23, 22, 23, 24, 23 …………..115 ………………………..115
21, 21, 27, 22 ………………….91 …………………………90
16, 22, 15, 17, 22 …………….92 …………………………90
25, 20, 22, 17, 21 …………..105 …………………………99
So we can see that the ~100 ky eccentricity cycle is important, but not pivotal. Lee says: “When eccentricity is small, precession doesn’t matter”. But this is completely wrong.
Look at the following diagram (by Mike Palmer). The central blue plot is eccentricity, the top orange plot is precession-insolation (Milankovitch cycles). Note that the precession peaks 290 ky, 170 ky, 105 ky and 80 ky ago did NOT cause an interglacial, depite them being enhanced by high eccentricity. In fact, the cycle 170 ky ago that failed completely, was greater than the cycle 240 kya ago that did cause an interglacial.
http://s4.postimg.org/gf6jcemnx/temp_and_eccentricity_Page_1.jpg
High Milankovitch insolation is NOT the sole cause of interglacial initiation. So what is? The answer is dust. As you can see in the following graph, every interglacial is preceded by dust, which lowers the albedo of the northern ice sheets and allows the ice to melt, and the interglacial to proceed.
http://oi63.tinypic.com/30rmctl.jpg
.
Please see the following paper which explains everything. And yes CO2 is vital for interglacial warming – but only when it gets too low.
http://www.sciencedirect.com/science/article/pii/S1674987116300305
Ralph
So what causes dust? I speculate in a comment below. And what makes dust go away? It gets rained out. Think thermofluid dynamics in a very very very large pot of water with the heat source above combined with the plain old water cycle. Clouds during discharge, clear sky during recharge, dust because of low humidity while the oceans recharge.
Desertification causes dust. Loess deposits in China from this cover vast areas and are hundreds of meters thick. A lot of dust arises during glacial retreat exposing unvegetated ground covered in deposits of gravel sand and silt/clay that are products of the grinding of bedrock by kilometer+ moving ice sheets. I mapped crescent-shaped sand dunes in the bush of northern Manitoba sourced from the retreating ice sheet.
>>So what causes dust?
Just as Gary says, the lack of CO2 caused the appearance of CO2 deserts (instead of aridity deserts) in the Gobi region of China and Mongolia. This is why the NE Asia region never had any ice sheets, despite the cod weather there – it was always too dusty.
And the reason the dust stopped as soon as the interglacial started, is that Co2 concentrations started to rise and C3 grasses repopulated the Gobi (C4 plants cannot live on the Gobi).
And the reason the interglacial continued to warm, is that there was already 10,000 years of dust embedded in the ice sheets, and these continued to concentrate on the surface as the ice melted.
It is quite a comprehensive theory.
R
What causes dust? Wind. What does the wind also do? Turning the cold oceans upside down. The cold surfaces don’t evaporate water. Therefore it is dry and the windy circumstances blow the remaining dust on the icy areas.
But what caused wind? Notice that interglacials start after the lowest temperatures in the preceding Glacial. When the oceans are turned ‘upside down’, the coldest surface (!) circumstances will exist. The lack of vegetation (lack of CO2, cold, enhanced water shortages) can cause lower winter season temperatures on ‘land’ and colder nights on ‘land’. While the tropical seas remained warm and the land cooled down, the temperature gradient rose. As soon as the temperature gradient rises, wind speed rises. As wind speeds rises, cold upwelling will be enhanced, sea surface will cool, evaporation will be lowered, vegetation will diminish even more, dust will be abundant and wind also, dust will be transported to the ice and snow and the big melt can start. As soon as temperature goes up, the temperature gradient will diminish and upwelling will slow down, making it possible that the sea surface temperatures rise. Retreating snow and ice enhance the distance between snow and the equator, diminishing the temperature gradient and lowering the wind speed once more. The surface will be in a continued ‘heat gain’ modus, raise melt etc. etc.
>>What causes dust?
Bare ground. This was recently barren ground, just like 1930s ‘dust-bowl America’. Unlike deserts, where the fine material has long since been blown away, newly barren areas are full of microscopic particles just waiting to be taken aloft.
R
>>Wind. What does the wind also do?
But the data suggests otherwise.
From the analysis of dust grain-size, it has been established that conditions were windier upon the Gobi plateau (where the glacial dust came from). However, the data also suggests that wind strengths on the ice sheets did not change. Which is logical, as the peak wind change will be close to the ice sheet termini, in lower latitudes.
So although more dust was lifted by stronger winds, it was not carried far and most settled upon the Loess Plateau. So the main reason for increased dust on the ice sheets, was a much greater desert area – caused by the CO2 deserts.
R
Thanks for the link. That will be some good reading for me this weekend.
PS. Happy new year to all the folks celebrating it this weekend.
Ralf
Maslin and Ridgewell also consider the apparent 100,000 year pacing of recent interglacials to be in fact a complex result of precession cycles, not eccentricity, although they concede a possible “pacing” role to eccentricity:
https://www.researchgate.net/profile/Mark_Maslin/publication/259011520_Mid-Pleistocene_revolution_and_the_'eccentricity_myth'/links/02e7e5350417210173000000.pdf
again this is all understandable in the context of a weakly periodically forced nonlinear oscillator.
>>Maslin and Ridgewell consider … recent interglacials to be
>>a complex result of precession cycles
Yes, but Maslin was also trying to push the CO2 agenda, citing 240 ppm of CO2 is a ‘critical threshold’? (A tipping point.) This is an abridgement of my letter to Maslin, which greatly upset him.
Quote:
So where in the graph below is the transition from normal cooling to ’tipping point’ cooling? It is not there, is it. There is no tipping point in ice age cooling, and so your suggestion is wrong. … And your quote above, and implied in the Daily Mail article, is the complete opposite of what you acknowledge in your 2015 paper. At the beginning of your 2015 paper you quote the prevailing wisdom that … (ice ages progress due to ice-albedo) ……
So you have already found the true feedback agent, that operates long before 240ppm CO2. So why attempt to force CO2 into the argument, and leave albedo out of your discussion and conclusions? Where is the logic in that? Especially since the albedo feedback is orders of magnitude stronger than CO2, when calculated regionally and annually. Is it sImply because CO2 HAS to be there, according to the consensus? Is that the reason? If so, it is a poor one. Yet you must yourself have doubts, because your 2016 paper does not mention CO2 at all.
More importantly, you have still not addressed the MOST IMPORTANT aspect of the post-MPT glacial cycle – the missing interglacials. If CO2 were the primary climate feedback, then why does the all-powerful CO2 not assist and promote an interglacial at EVERY precessionary cycle in the NH. You cannot explain that deficiency, with the simplistic CO2 approach.
However, the one feedback mechanism that DOES increase before each interglacial, and not in-between, is dust. And dust is the primary ingredient in the albedo feedback mechanism. Ergo, my friend, it is dust and albedo that control interglacial modulation, not CO2.
Endquote:
I did not get a coherent reply that addressed the issues I raised, just a complaint that my letter was too forthright.
Ralph
ralfellis,
“I did not get a coherent reply that addressed the issues I raised, just a complaint that my letter was too forthright.”
And this response is surprising? It’s been my experience that the more definitively the alarmist POV is deconstructed, the more hostile and incoherent their responses become. Schlesinger and others have demonstrated this to me within the last few days. The pathological denial of any physics, data or hypothesis that disputes a high sensitivity is as anti-scientific as it can be, yet this logical flaw is endemic among those highly vested in the status quo. Schlesinger even suggested that I need psycho analysis for suggesting that if Mars had 1 ATM of O2/N2, the CO2 concentration would be over 6000 ppm in response to his claim that there’s not enough CO2 on Mars to make it warm.
BTW, Schlesinger (Cess and Hansen) are largely responsible for the incorrect application of Bode’s control theory to the climate system that provided the theoretical foundation for a high sensitivity and which led to the formation of the IPCC. I made him aware of the errors nearly a decade ago and will be happy to testify at his trial.
Ralf
Yes I thought the CO2 homily in that M&R paper was out of place in an otherwise useful study. It is sad to witness the moment when a scientist steps over the line from curiosity and inquiry into cynical politicing. Also depressing to see how badly scientists respond to criticism of their work even when it is delivered confidently and personally. I have seen this myself. (Your letter made a clear scientific point and was a fair comment.)
Perhaps the way science works is that any view or hypothesis that a scientist advances becomes an all-consuming circus of self promotion and fundraising that they become so heavily invested in that contradiction is seen as an existential threat.
I look at this paper and I cannot process all the variability. I am attracted to solar influence despite the persistent criticism that it doesn’t have any measurable effect. Well, it seems that there is something there.
The posting is stained with incredulity IMO, despite my interest in the subject, by the concluding statement wrt AGW matters. Other critics raise this issue as well.
…stay curious…
http://siberiantimes.com/other/others/news/n0857-blow-to-northern-sea-route-as-voyages-of-two-icebreakers-are-broken-by-ice/
“But now a spokesman for Rosmorport has announced the icebreakers will delay a return until probably May or early June. ‘The vessels will remain for the winter because of the very heavy severe ice conditions,’ he said.”
“Emergencies Ministry officials denied the situation was an emergency. ‘A winter stop is a good practice for preventing accidents related to complex ice situation,’ said a source”
Is that intended to show the ice is getting thicker/recovering/an ice age is on the way?
The reason they were out there at all is that climate change is opening up the N sea route for longer and the Russians are putting in the infrastructure to take advantage of that. They just commissioned an LNG icebreaker tanker for the N sea route… replaces pipeline use through europe. Note it isn’t intended to break the ice full time, its just that with permanently decreasing ice it can operate safely for longer on that route now.
they have been using this route since the 1930s!
do you think they can use the sea route for longer due to Nuclear powered ice breakers?
compared to sailing ships from the 19th century?
“They just commissioned an LNG icebreaker tanker for the N sea route…”
The Russians were going to offer up the N sea route in 1967 to world shipping, the offer was not made formal until 1987.
” A powerful new organization, Glavsevmorput (Chief Administration of the Northern Sea Route), was created in 1932. It had “money, skill, and enthusiasm,” as well as responsibility for all aspects of northern development including the sea route.
“IN 1987 the arctic became useable for the Russians all year round”
http://www.tandfonline.com/doi/abs/10.1080/13518040701533006?journalCode=fslv20
Northern Sea Route during World War II, 1939-45.
Griff, what is causing the warmth in the eastern Arctic is the fact that deeply cold air masses have descended far down the centers of the Asian and North American continents (Arctic Vortices) and this results in return warm air to replace it. See the NH color coded temperature distribution on the same sea ice page you are consulting. Also, we’ve had an El Nino year that has ended and will go through the cooling half now. Wait until the picture is complete. Note also, that Antarctic ice expansion and retreat occurs in 5yr cycles – see this on the sea ice page. We are just completing a low in the cycle.
Gloateus Maximus January 27, 2017 at 8:04 am
Thanks for the link, that is two, of lend lease shipping that have been shown to him. ( furnished him one a couple months ago.)
from ice age now. I left it at one of Griff’s earlier posts today.
So much for low sea ice.
http://siberiantimes.com/other/others/news/n0857-blow-to-northern-sea-route-as-voyages-of-two-icebreakers-are-broken-by-ice/
michael
Absorbed incoming solar radiation integrated annually is the same for the two hemispheres, independent of eccentricity. Therefore, if cooling is caused by radiation reflected by excess sea ice in the Southern hemisphere, it remains to be explained why the Northern hemisphere reflected more as well.
It’s referred to as snow
“Much of the carbon dioxide — a key greenhouse gas — exhaled into the atmosphere from the oceans comes from the southern polar region. If that region is largely covered in ice, it may hold that carbon dioxide in like a cap on a soda bottle.” CO2 is a minor greenhouse gas when compared to water vapor …
Since there are major currents in the oceans. Water that is under southern sea ice now, won’t be in a few years. I’m not seeing sea ice as being a capable of keeping CO2 locked up in water. Not long term.
As Kaiser points out, sea ice does prevent evaporation, which would keep water out of the air over the ice cap, and that would aid in heat loss.
Brown University could save money and time with using already developed models,
https://www.google.at/search?q=solar+planet+rotation+models&oq=solar+planet+rotation+models&aqs=chrome
more comprehensive and even tactile.
Conceded Milutin Milankovitch had more than such models – he was used to think for himself.