Cooling and warming the surface of the Earth without energy loss or energy gain: a natural mechanism
Guest Post by Wim Röst
Abstract
Upwelling is a massive force, well visible on world maps. Data provide evidence that the last century ‘Warming period(s)’ just may be caused by ‘less deep sea cooling’. Data also show that the ‘Pause’ is characterized by ‘more wind’ and therefore by ‘more upwelling’. That upwelling cooled the surface layer of the Oceans and ended the previous warming trend. Effects are visible both on a regional scale (i.e. the North Atlantic) and on the global scale. ‘Upwelling’ together with ‘mixing’ is a massive force. On a scale of decades the mechanism responds quickly to changes and it forms a very active force. The changes in wind speed are enhanced in their effects because ‘wind stress’ on the surface is a quadratic function of wind speed. Preliminary data suggest that the wind-upwelling-mixing mechanism might be a new and important stabilizing feedback mechanism as well. The here described warming/cooling mechanism acts without energy loss / energy gain for the Earth as a whole. The author suggests that because of it’s massive power, the mechanism also plays a main role in Abrupt Climate Changes as are known from the rapid transitions into and out of the Interglacials. Less wind causes accelerated warming of the sea surface and the atmosphere. ‘More wind’ causes a quick and strong cooling by the Deep Sea.
Introduction
In my last post, Warming by [less] Upwelling of Cold Ocean Water *, I explained that the ‘cooling potential’ of the deep sea is enormous. Calculations showed that – if activated – the subsea can and will decide over sea surface temperatures. A one year doubling of the regular ‘upwelling’ diminishes global sea surface temperatures with 0,18 ºC. I stated that ‘wind’ is determining cold upwelling (and ‘mixing’).
So far the theory. Let’s check the facts.
First question: can we see the effect of ‘upwelling’: is upwelling that huge that it is visible?
Answer: sure, the effect of upwelling is very well visible, even on world scale maps. Who looks in ‘horizontal lines’ often sees on the same latitude sea surface temperatures that are lower than elsewhere, especially on the West side of continents. Have a look at fig. 1.
Fig. 1: ** Sea Surface Temperatures (SST) 1985-2015.

We find main upwelling areas West of North Africa, West of South Africa, West of Peru and West of California. Prevailing Eastern winds, the Easterlies, are the cause of big upwelling areas. Less well known are upwelling/mixing areas resulting from Westerlies: the Sea of Okhotsk (East-Siberia) and the seas North and East of Newfoundland. For climate change those areas are important as well.
It is clearly visible: Upwelling is a massive power.
But that is not enough. When changing wind patterns are the cause of temperature differences as I argued in my last post, then we must be able to see those changing patterns between two periods.
Because the last ‘warming period’ is quite different from ‘the Pause’ I selected two different 15 year periods that both included a massive El Nino: 1986-2000 and 2001-2015 (data for 2016 were not available at the moment of plotting the maps).
In ClimateReanalyzer it is possible to subtract the average of the ‘Warming period’ from the average for ‘the Pause’: 2001-2015 minus 1986-2000. The parts of the ocean that cooled down during the Pause (compared to the warming period before) are shown in blue. Relative ‘warming’ during the Pause is shown in red. The sea temperature differences between both periods are well visible in most of the seas: Fig. 2.
Fig. 2:** Sea Surface Temperature (SST) Anomaly of ‘The Pause’ minus ‘Warming’ (2001-2015 minus 1986-2000).

During the Pause, most main upwelling area’s show ‘cooling’ (blue). Deep upwelling water was cooling the surface during the Pause more than it did during the Warming period before. Or, reversely, during the Warming period, less upwelling water was cooling the surface layer, resulting in ‘warming’.
Following the theory, the following question was: “Do sea surface temperatures show cooling because of a change in wind patterns? As I argued in the last post, wind drives upwelling. If so, the following map must show stronger winds at the cooling places of fig. 2.
For the same periods the difference in average wind speed was plotted. More wind (in red) means the wind enhanced over that region during the Pause.
The result is astonishing: fig. 3.
Fig. 3:** Wind speed during ‘The Pause’ minus wind speed during ‘Warming’ (2001-2015 minus 1986-2000). ‘Red’ = higher wind speed during the Pause, ‘blue = lower wind speed than in the preceding (warming) period.

Fig. 2 and fig. 3 are nearly the inverse of each other. Where wind speed was enhanced during the Pause, sea surface cooled. Where wind speed diminished, sea surface warmed.
In the Pacific Ocean we see that in the upwelling areas (West of California, West of Peru – blue in fig. 2) the wind was indeed stronger (‘red’ in fig. 3). This stronger wind enhanced the upwelling. And upwelling cooled the surface: blue in fig. 2.
But there is more. In my last post I also stated that ‘Warming’ could have been caused by less upwelling. If so, wind speed must have been diminished in seas that warmed.
Let us have a look at the North Atlantic, the region that warmed the most during the Pause (red in fig. 2). What was the role of wind in the North Atlantic during the Pause? The theory says it should have been diminished. If so, it would be shown as ‘blue’ in fig. 3.
And it is shown in blue. Less wind in the North Atlantic indeed coincided with ‘warming’. Less wind, less upwelling/mixing. And Sea Surfaces in the Atlantic were warming.
But that is not all. In my last post I also stated that ‘the whole period of Warming’ could have been caused by less upwelling.
If ‘Warming’ in general is also caused by less wind (resulting in less upwelling/mixing), than, in the Warming Period the average wind speed must have been lower in 1986-2000 than during 2001 – 2015. Let’s check.
Fig. 4 shows the development of average global wind speed for the whole period (unfortunately wind speed ´for oceans only´ was not available)
Fig. 4:** Development of global wind speed since 1979

(WR: The red line is added to the original graphic)
Less wind + less upwelling = Warming
Wind speed increased from 1979 onwards. During the entire period of warming wind speed on average was lower than during the Pause. Resulting in ‘warming’.
More wind + more upwelling = The Pause
During The Pause wind speed on the average was higher than during the Warming period. Resulting in ‘no warming’. As the theory says.
A ‘phase shift’ in 1997?
Because I was interested in the difference between the distinctive periods before and after 2000, I tried to look at the above graph in a different way: is there something visible like a ‘phase shift’ between the two periods?
Something like a phase shift seems to be the case from the start of the 1997 El Nino. I added the red line to the graph. Looking left and right of the red line, one discovers a different ‘average level’ for the two periods.
A negative feedback mechanism?
After the 1997 El Nino the average surface temperature of the seas was higher as well. See fig. 5
Fig. 5**: Development of Sea Surface Temperatures since 1979

(WR: Again a red line is added to the original graphic at the same moment in time as in fig. 4)
The development of Sea Surface Temperatures shows a pattern that is remarkably the same as the development of Wind Speed. Higher sea surface temperatures coincide with more wind.
As we already saw, more wind results in cooling because of upwelling/mixing. Therefore, the most logical conclusion here is that warming seas enhanced global wind speed and that global wind speed in turn started the cooling process.
This leads to the conclusion that a negative wind/upwelling feedback might be regulating surface temperatures: more warmth > more wind > more upwelling > cooling.
If future observations (and reanalysis results) confirm the pattern, an important new stabilizing feedback might have been discovered.
This feedback could play an important role in explaining the cyclic character of warming/cooling periods as well.
Wind stress is a quadratic function
The difference in wind speed between the two distinctive periods doesn’t seem to be that high in meters per second, but: “Because wind stress is a quadratic function of wind speed, gusty winds produce larger stresses than would steady winds of the same average speed.” *** In other words, a few extra storms will have a much bigger impact on upwelling and mixing of the sea surface than ‘average wind change’ would suggest. A little increase in wind speed results in a lot of extra upwelling and mixing. And a little decrease in wind speed results in much less upwelling and mixing.
Physical processes
Without wind, the sun would heat up the upper surface layer of the oceans, in the tropics more intensely than at the higher latitudes. Without wind, the upper layer will quickly show a stronger stratification in temperature.
As everyone who is visiting a cold lake in summertime can experience, the following happens. Without wind, in three to five sunny days the sun can heat up the toplayer significantly, producing one or two meters of much warmer water. Which, during the heat of summer, often is nice to swim in. Fig. 6.
Fig. 6: Stratification of a lake after warming by the sun – without wind

After the initial situation shown above, the following happens after the wind started to blow. Upwind the warm surface layer will be blown away and cold water will well up. Fig. 7.
Fig. 7: Cooling the surface by upwelling

Cooling without energy loss
Downwind, the wind will mix the upper layers. The warm water at the surface will be mixed with the cooler water below, resulting in an overall lower surface temperature and a thickening of the surface layer itself. By mixing, no energy is lost, however the top surface layer cooled. Wind cools the surface. Also by mixing. See Fig. 8.
Fig. 8: Cooling the top of the surface layer by ‘mixing’. An example.

Oceans are ‘very big lakes’ with their own characteristics. But there, the same wind / upwelling / mixing principles are at work.
Experiences of a submariner confirm that ‘mixing’ in the oceans in some cases can go as deep as 1000 meter. For some first hand observations, scroll down to: **** Submarine Experiences
Abrupt Climate Change
Due to Abrupt Climate Change(s) into an Interglacial, the global climate system changed rapidly. A different climate system with completely other characteristics for major areas established itself in a very short time. Gradual orbital chances can not explain the rapid temperature changes into the Interglacials. Some power must have warmed the surface at moments of a rapid shift into the Interglacial. In a following post I will elaborate on the idea that by a temporary switching off of the Earth Cooling Mechanism it was possible that the surface of the Earth was warmed by several degrees in a century. Or strongly cooled when the cooling mechanism was working in overdrive. It has always been the Sun that warms the Earth year after year, but the Sun can only warm the surface rapidly when the massive (and continuously working) Deep Sea Cooling is diminished substantially.
In a future post I will elaborate on the consequences of upwelling and mixing processes for climate. The consequences are huge. But, given the massive influence on surface temperatures as shown earlier in this post ((fig. 2 and fig. 3) and in the previous one, we can already draw some important conclusions.
Conclusions:
The here described mechanism shows that ‘warming’ or ‘cooling’ of the surface of the Earth is able to happen without ‘energy gain’ or ‘energy loss’ for the Earth as a whole.
Periods of warming or cooling might just be the result of natural variation within the atmosphere/ocean system itself.
‘Weather’ (here: ‘wind’) still controls sea surface temperatures as shown by fig. 2 and fig. 3. The Oceans dominate the Earth’ surface (with a share of 71%) and determine most of the Earth’ temperature. Winds and Oceans are the decisive factor. ‘Upwelling’ and ‘mixing’ are processes that strongly react on relatively small changes in atmospheric conditions. Slight increases in wind speed result in the mixing of a lot of ‘cold’ deep seawater into the surface layer.
In respect to warming/cooling there are three possibilities:
- No wind: no mixing and upwelling, strong warming of the surface layer.
- “Normal wind”: no change in temperature, just the right quantity of ‘cold from the depth’ and ‘sun energy from above’ to keep surface temperatures stable.
- More wind: more mixing and upwelling, cooling of the surface, cooling of the atmosphere.
My guess: both warming periods of the last century were [mainly] the result of diminished ‘wind’. ‘The Pause’ showed a wind level that was just ‘right’ to keep surface temperatures stable. More wind will result in cooling. And less wind in the future will result in another warming period.
One who can not predict ‘wind,’ can not predict climate change.
So far, nobody can predict future winds, not even two weeks ahead. And no one can predict the behaviour of the oceans either.
Wind and oceans do what they do.
With regards to commenting: please adhere to the rules known for this site: quote and react, not personal. Factual information in regard to this topic is welcome.
About the author: Wim Röst studied human geography in Utrecht, the Netherlands. The above is his personal view. He is not connected to firms or foundations nor is he funded by government(s)
Notes:
* https://wattsupwiththat.com/2016/12/26/warming-by-less-upwelling-of-cold-ocean-water/
** Source of fig. 1-3 and fig. 4 and 5:
http://cci-reanalyzer.org/reanalysis/monthly_maps/index.php
http://cci-reanalyzer.org/Reanalysis_monthly/tseries.php
*** Source: https://marine.rutgers.edu/dmcs/ms501/2004/Notes/Wilkin20041014.htm
**** SUBMARINE EXPERIENCES
I spent the 1980’s on prolonged nuclear submarine submerged deployments (>80 days submerged duration) throughout the North Atlantic Basin. For a variety of operational and tactical reasons, ocean water temperature was of extreme interest. We typically operated below 70 meter submerged depth. We were often in the same area at the same depth repeatedly during a deployment and also from year to year.
Summary:
1) Very large storms will stir up the water column and hence the temperature profile much deeper than 70m.
a) We witnessed one severe winter storm system in 1984 change the temperature profile for at least 1000 m depth.
b) This temperature disruption lasted for at least 60 days after the storm system had abated.
2) All of our temperature measurements were taken by direct readings.
a) Ship board precision sensors
b) Remote wired sensors deployed from the ship.
c) Calibrated accuracy was to +/- .05C (I have a lot of engineering experience with precision temperature measurement systems, accuracies, calibration, etc.)
3) In the absence of storm systems, the temperature profile would change repeatedly when in proximity to the Gulf Stream current in the North Atlantic. Proximity could mean within 200 to 300 km of the main Gulf Stream Current. We would see changes of 1 to 4C in a 30 to 45 day time frame. It depended upon the amount of eddie current and time of year off of the Gulf Stream Current. In summary this is a very powerful mixing agent.
4) In relatively still and deep ocean basins, the changes would not be so dramatic or dynamic. However from year to year (at the same time of the year) we would often see variations of 1 – 2C
The ocean is an incredibly dynamic, constantly changing three dimensional system
(name known by the author of this article)
Assume your audience has never heard of “upwelling” in the context in which you are explaining it.
Now answer the question: “WHAT substance is upwelling ?” It is not immediately apparent whether you are talking about atmospheric air or ocean water.
You have the words, “wind” and “upwelling” in the title, which, to those unfamiliar with the terminology, at first suggests that air is the subject. It would be more apparent if your title included “ocean water upwelling”, if this is what you want readers to immediately grasp. I, for example, first thought this was an article about air convection and “upwelling” air currents. My whole context was thrown, which made my experience of your article a little shaky upon first entry.
Hell. Even I knew he was talking about the water! Upwelling was the tip off.
Good for you. I guess that this term only applies to water in this field, and I’m an idiot for not knowing that.
Apologies for my idiocy.
Robert Kernodle ==> You are quite right to complain about the lack of definition of terms. It is one of the trickier parts of writing to be aware of what your readers might not know. There should have been a single line or even phrase indicating that “the passage of wind over the surface of the oceans pushes the warmer surface waters in the direction the wind is blowing, causing deeper, usually cooler, water to “upwell” to replace it, as shown in the diagram below” (let your imagination supply the diagram).
As an occasional author here, I am sometimes guilty in the same way.
Kip Hansen: “There should have been a single line or even phrase indicating that “the passage of wind over the surface of the oceans pushes the warmer surface waters in the direction the wind is blowing, causing deeper, usually cooler, water to “upwell” to replace it, as shown in the diagram below” (let your imagination supply the diagram).”
WR: See above:
“Introduction
In my last post, Warming by [less] Upwelling of Cold Ocean Water *, I explained that the ‘cooling potential’ of the deep sea is enormous.
Notes:
* https://wattsupwiththat.com/2016/12/26/warming-by-less-upwelling-of-cold-ocean-water/”
In the first post upwelling was explained. The first sentence gave a reference to that post. Later in this post enough about upwelling was explained.
But I will take notion for a next post.
Wim ==> I suspected that you might have explained it in the first post (which I don’t recall seeing, personally). I always take reader complaints as a chance to “do better next time” and often use a preamble to state if readers must read earlier essays in a series before the current one. I have written a couple of serial posts here and sometimes that all must be read in order or the reader will definitely be lost.
I would like to see an additional essay in this series which looks at the use of the Land and Ocean Surface temperature metrics as (LOTI and others) yardsticks for planetary atmospheric warming due to GHGs.
It is my thought that including ocean surface temperature in such a metric, averaged with land surface temperatures (air 2 m above the surface) is a non-physical thing to do — the combination measures nothing useful. They are not caused by the same forces.
Kip Hansen January 26, 2017 at 1:02 pm
Kip, thanks for your recommendations, I read them well! Thanks.
I remember one of your posts in which you asked more attention for ‘wind’. The role of wind indeed is underestimated. I hope that taking here one aspect of the wind (the role it plays for the vertical motion(s) in the ocean) will have pleased you. Perhaps this article will stimulate others too to look at the role of wind and at the connection between the fluids (air and water) in all their natural variations. As soon as we know all the natural variations, we can see which part of the ‘changes’ is made by man.
It will take a lot of time before we know all about those natural variation(s) and their interconnections. We don’t know much about wind and the same for the oceans. I was glad to read your request for more attention for wind and I hope my article will also stimulate research for both wind and ocean plus their ‘connection(s)’.
Wim ==> “Perhaps this article will stimulate others too to look at the role of wind and at the connection between the fluids (air and water) in all their natural variations. ” That is what used to be known as “climate studies” — fluid dynamics of ocean and atmosphere — the very reason NOAA is the “National Oceanic and Atmospheric Administration” — the combination produces the weather and the climate.
The research began back with Dave Fultz at Chicago and Robert Hide at Cambridge doing physical rotating “dishpan” experiments to understand the fluid dynamics of the atmosphere and ocean currents. In doing these experiments, they stumbled on the first hints of chaos in those dynamics. I mentioned some of this here and here.
Kip Hansen January 26, 2017 at 1:47 pm
“Wim ==> “Perhaps this article will stimulate others too to look at the role of wind and at the connection between the fluids (air and water) in all their natural variations. ” That is what used to be known as “climate studies” — fluid dynamics of ocean and atmosphere — the very reason NOAA is the “National Oceanic and Atmospheric Administration” — the combination produces the weather and the climate.”
Kip, I read that billions a year are spend for climate research. And we absolutely need to know all about the “fluid dynamics of ocean and atmosphere”. But I was rather astonished to discover that the cooling role of the deep sea and the variations in that cooling – as far as I could find out – never was connected to global climate change. While we are measuring changing global temperatures in hundreds of a degree, a massive force as “the Earth’ Water Cooling”, able to make changes in global temperatures in tenth of a degree in a year, never got the attention it deserved. It seems that everyone ‘is looking up’ while most happens at the connection between Atmosphere and Ocean and below the surface of the Ocean. That is where our attention should have been.
Of course there are more important climate factors than the factors here described, but these forces ‘Wind’ and ‘Deep Sea Cooling’ are that powerful that you really should expect that they would be in the centre of attention. They seem ‘to be missed’.
But in studying these factors, there is a risk. A risk that can be proven that Nature indeed can cause the variations in temperature that we are measuring. And that there are feedback mechanisms that will bring all ‘extra energy’ that is brought into the Atmospheric system into the deep ocean.
In my last post Bryan counted that it would take the Oceans 870 years to raise the temperature of the whole ocean one degree C/K when the Oceans would take up all the extra energy that is mentioned: “Now we are told that on average there is a 0.58w/m^2 gain over the recent past” See comment https://wattsupwiththat.com/2016/12/26/warming-by-less-upwelling-of-cold-ocean-water/#comment-2383370 Compare this 870 years of heat uptake to the cooling of 0,18 degree C in one year (!) when the upwelling one year should have been doubled. You should really expect far more attention for the cooling capacity and the cooling role of the Ocean. Which is really huge.
In a future post I will like to discuss aspects of ‘other climate systems’ that have existed. With probably quite other characteristics for wind and oceans. Characteristics that are the results of other circumstances and that at their turn result in other circumstances -.as it works in a dynamic ever changing chaotic system of fluids.
Kip, I will have a look at your links too, but later. Thanks!
convection for liquids?
I thought it was plain as day he was referring to the ocean waters. ‘Upwelling’ in the atmosphere is more associated with the water cycle, thermals and the like, i.e. much to do with weather. “Wind” is a common expression used in this context.
This was one of the best explanations of a natural, almost zero sum mechanism that would explain quite long period fluctuations in surface temperatures and also highlight the misleading effect of using such a metric in a simplistic way to fully characterise and measure whether there is actual energy accumulation by the planet aka ‘global warming’ or whether what some scientists think they are seeing is actually something else.
“This was one of the best explanations of a natural, almost zero sum mechanism that would explain quite long period fluctuations in surface temperatures and also highlight the misleading effect of using such a metric in a simplistic way to fully characterise and measure whether there is actual energy accumulation by the planet aka ‘global warming’ or whether what some scientists think they are seeing is actually something else.”
WR: Thank you M Seward. Trying to find out what is REALLY happening and reading as much as possible about it, I often thought: “It ain’t necessarily so”. To discover that the internal variation between two systems, (“Atmosphere” and “Ocean”) could be able to explain all measured differences in temperatures without energy gain or loss for the Earth as a whole was a very fundamental discovery. Wind and ocean are reacting on each other (and probably on a lot of other things not discussed here) and only their internal dynamics already can explain most – if not all – of the temperature changes we are measuring. It takes time to realize what this means.
I concur . I think Bill Gray might well have too .
Given the total variation in temperature this whole nonscience is about , it’s easy to believe that a major portion of it is just 0 sum redistributions of energy .
Robert,
The grammar and vocabulary was a little stilted, suggesting to me that English is a second language for Wim. I think that we could cut him a little slack for that. Taking allowance for the fact that it didn’t read like something that I might write, I had no difficulty understanding his points, when take in context.
I applaud Wim for making a good attempt at conveying an important idea to an audience that doesn’t speak Dutch.
When are you going to write an article for us so that we can learn, by example, how it should be done?
Clyde: “Robert (….) When are you going to write an article for us so that we can learn, by example, how it should be done?”
Thank you Clyde. Yes, I would be interested in such an article. And in Robert’s translation in Dutch or in French, German or Portuguese, languages I can read and in which I can express myself a bit. Reading English is not a problem, actively expressing myself is a bit more difficult. But as I try to understand other languages, it helps as others try to understand my English. In the end, the message is more important than the exact words.
Trust me, I appreciate the article. I was just pointing out to someone who wants to communicate his thoughts how his efforts were going. The critique should not be evoking defensiveness, but rather insight into writing for ignoramuses in the field like moi. (^_^)
Robert, i once read your piece on ice cores. (you’re no ignoramus)…
There was no clickable link to that first post. Otherwise, I most certainly would have clicked on it — this was my first instinct, but no link, so no click, so no enlightenment to proceed, without first having to enter the title in a search, taking more time away from the reading, when a simple clickable link at the very start would have prevented any of my commentary. Thanks for the link now.
Robert, you probably were to quick. If you had followed the first * you would have found the link just below the text of the article as the first note. You can still find it there.
It’s a system. None of the current climate scientists are systems analysts, nor are they versed in engineering.
Quite so, hence my earlier ‘Hot Water Bottle Effect’ to describe the contribution of the oceans to the overall global greenhouse effect.
And as suggested the winds change first, hence the change in jet stream behaviour between zonal and meridional patterns as described here:
https://wattsupwiththat.com/2017/01/26/warming-and-the-pause-explained-by-wind-upwelling-and-mixing/
And others here will recall me saying for many years past that I first noticed the change in jet stream behaviour from the zonality of the warming spell to the meridionality of the pause back in 2000.
If we now see a further increase in meridionality then cooling will commence, if it has not already done so.
Whoops, wrong link, see here:
http://joannenova.com.au/2015/01/is-the-sun-driving-ozone-and-changing-the-climate/
All good, but The step step is.. What drives wind…well, its pressure. So what drives pressure changes…well, polar ozone can… And what drives that…etc. Etc. See https://reality348.wordpress.com. About 40 chapters worth of observational charts, etc.
Macha, the sun and the rotation of the earth drives the winds.
Each and every day, the earth rotates, so the terminator (dark./light) boundary sweeps across the surface of the earth causing differential warming. (light surface warmer than dark)
The winds must, on average, flow from west to east due to this differential warming.
Away from the equator, the suns heating effect is less, so less differential warming, so we get a northerly or southerly component depending upon our hemisphere.
So, in the northern hemisphere the general flow is from the south west, in the southern hemisphere it is from the north west.
Sea/ground boundaries and mountains etc will give large eddies which will give local persistent contrary winds.
Variable cloud cover, sea breezes also give daily variations.
Macha January 27, 2017 at 12:47 am “So what drives pressure changes…”
WR: “Air” changes in its qualities as ‘level’ changes, as ‘latitude’ changes, as ‘season’ (orbit) changes, as day and night changes, as ‘cloud’ changes. You can find many qualities of air that doesn’t mix well. Lying on your back in the grass on a nice day and looking to the clouds you can often see that the low clouds above are going in another direction than the wind at the surface. The higher clouds might flow rectangular to the lower clouds. In “Nullschool” you can click on many ‘layers of air”. https://earth.nullschool.net/#current/wind/isobaric/10hPa/orthographic=-330.45,49.00,450/loc=-96.198,41.189 Click ‘Earth’, Overlay ‘wind’, use mode ‘air’, make your choice for ‘height’ and click on the different hPa’s. Every ‘layer’ is different. “So what drives pressure changes……?”.
In the Oceans the behaviour of fluids is as complicated. It looks a bit about what happens above the surface, in the air. We don’t know that much about what happens down in the oceans.
And It is not too easy to understand what happens ‘high above’ either, for example in the stratosphere. I wander what is going on in the stratosphere at the poles. As UAH measurements show (click on the links for the data) a lot of things are happening there. What about the connection through the Atmosphere between North and South Pole? What about the Polar See-Saw effect? https://en.wikipedia.org/wiki/Polar_see-saw How much do we understand?
The idea that ‘Science is settled’ is far from reality. At least 97% of Scientists will agree. Who looks down at the Ocean understands.
Yes, but the basic thrust is that water piles up to the west (at least where it matters the most for temps, at the equator). Therefor, the dominate winds are easterly from hadley cell trades and temperature dependant walker cell trades…
The warm up to the current interglacial took about 5000 years. “Abrupt Climate Changes as are known from the rapid transitions into and out of the Interglacials” is misleading.
Dan Pangburn: “Abrupt Climate Changes as are known from the rapid transitions into and out of the Interglacials” is misleading.
WR: Just an example:
https://phys.org/news/2014-09-discrepancy-greenland-temperatures-ice-age.html#nRlv
Research resolves discrepancy in Greenland temperatures during end of last ice age
“In addition to the gradual warming of five degrees (C) over a 6,000-year period beginning 18,000 years ago the study investigated two periods of abrupt warming and one period of abrupt cooling documented in the new ice cores.”
I’m not really questioning your basic theory here, Wim, but how do you know this is upwelling and not surface cooling caused by enhanced evaporation from the increased wind speed?
“how do you know this is upwelling and not surface cooling caused by enhanced evaporation from the increased wind speed?”
WR: Good question. We will have to measure and compare both. Of course evaporation plays an important role as well and Willis on this site clearly explained which role. But when you look at fig. 1 and see the enormous upwelling areas West of the continents (mostly green, rather close to the equator for what we would expect) than you can imagine how huge the cooling capacity of that million cubic kilometer is.
Imagine that you cover the whole surface area of the United States (something like 10 million square kilometer) with that one million cubic kilometer icecold water that is coming up somewhere every year. That is a layer of a hundred meter on every inch of the United States, an ice cold water layer that has to be heated to ‘surface temperature’ every year again. This reflects the ‘cooling potential’. We have to compare that cooling potential with the effect of evaporation. Which will be important as well.
And in fact we need to know exactly the whole system with all its interactions.
Wim- If you are referring to Fig1, it is just sea surface temp. It does not indicate directly that it is upwelling. Or are you referring to something else?
john harmsworth January 26, 2017 at 3:24 pm ” it is just sea surface temp. It does not indicate directly that it is upwelling.”
WR: Agree. Fig.1 is about sea surface temperature and you can think about ‘currents’ influencing the sea surface temperatures. They will play a role but not the dominant one. When you search for a map with ‘currents’ and you lay that over the map of fig. 1, you can for example see for the North Atlantic Gyre that it is not a circling current that is creating the temperature patterns of fig. 1. It is not temperature circles that you see: it is the pattern of cooling at upwelling places.
Plausible. More arctic ice insulates the water from wind and evaporation which reduces sinking cold water which decreases circulation. Strong negative feedback.
There is also the increased salinity with arctic ice as brine drains from sea ice.
Then there is evaporative cooling from lack of arctic ice. Lake effect ring a bell, Pavlov?
Tom Nelson @tan123 Sep 29
Phil Jones, ’09: “Bottom line: the no upward trend has to continue for a total of 15 yrs before we get worried” #IPCC https://twitter.com/tan123/status/384258425284071424
But the pause has gone on now for near 20 years. Phil Jones also wrote in 2008: “I’d like the world to warm up quicker.”
So Jones wants the world to warm faster, and would “worry” if the pause continued. Wouldn’t it be a relief if the world appeared NOT to be heading to catastrophic warming?? But these Chicken Littles don’t think that way. They’re just so invested in the AGW scare and in the draconian leftist policies they hanker for .. that everyday they get up and wish for signs that we actually were heading for Armageddon.
But we’re not heading for Armageddon. Sorry.
Sorry I see that the old link to the Phil Jones email where he said “I’d like the world to warm up quicker” doesn’t work anymore. ! So I fished out Tom Nelson’s coverage of that email here: http://tomnelson.blogspot.com/2012/02/email-3408-jan-2008-phil-jones-like.html
The waters off Svalbard are off-the-charts hot right now with temperature anomalies of up to 10 degrees C to both the west and the south-east.
Trenberth’s ‘missing heat’ or magma?
https://earth.nullschool.net/#current/ocean/surface/currents/overlay=sea_surface_temp_anomaly/orthographic=-16.16,78.13,1225/loc=6.276,77.774
SC: “The waters off Svalbard are off-the-charts hot right now with temperature anomalies of up to 10 degrees C to both the west and the south-east.”
WR: I have been looking at that for months and discovered at internet that they are also observed a two years ago. Look for June 8, 2015 at http://arctic-news.blogspot.nl/2015/06/gulf-stream-brings-ever-warmer-water-into-arctic-ocean.html
I already wrote an email to a professor working in that region who passed the request for more information to a colleague.
If it is no bug in Nullschool (which seems not, I asked already) it looks like two underwater volcanoes. If so, I would be interested if they are also the causes for the Warm Water Pulses signalled for the sub surface Arctic waters in the nineties and the 2000’s: http://journals.ametsoc.org/doi/pdf/10.1175/2010BAMS2921.1 Those warm water pulses could have influenced Arctic melting: water melts many times faster than air of the same temperature.
geothermal input to upwelling may be important. Note ocean at tip of South America is highly geologically active. In a dishpan you might get a “coanda” effect re-inforcing the Humboldt current.
Nice Work Wim. From the hundreds of articles I’ve read (on WUWT) regarding Earth’s climate systems and change drivers, the upwelling, or not, of the oceans has emerged, to me, as a very plausible cause for short-term, and regularly occurring climate changes globally. In other words, the oceans are the main “drivers” of global climate changes ( obviously not CO2). I look forward to reading more of your research on this subject. Hopefully many more thinkers and scientists will join in and look into this theory in depth (pardon the pun):)))
I am not sure of your definition for “short term”, but the oceans have over-turning times measured in millenia, which relegates their temperature response to millenia as well. Since this is much longer than the longest record of instrumental temperature I would call that long term climate change.
K. Kilty,
As shown by the rapid onset, dissolution and short-term effects of El Ninos, which are produced by ocean action,( up-welling or lack of up-welling, as expertly described by Bob Tisdale’s very complete reports based on real-time temperature data), the oceans have both short-term and long-term effects on climate, depending on the degree of and frequency of up-welling, which is in turn tied into wind activity, which is tied-into sun activity and many other known and mostly unknown, factors.
Surely the term of the effect is determined by the temperature, volume and location of the water changeover. As such, changes can be short term, long term, minor or catastrophic. Not Anthropogenic, though. So it’s a new thing to add to the catastrophe list! CNGP!
Hollybirtwistle,
Upwelling also plays an important role in changing the surface pH, which is something that usually doesn’t get mentioned when there is a lot of hand waving about the threat to littoral zone shell fish.
Am I wrong? I think that the fluid ‘air’, is caused to move, becoming ‘wind’, only by variations in its temperature and, to the extent that it has ‘mass’, the earth’s rotation. Absent the sun’s heating, and the earth’s rotation, would there be ANY wind (or ocean current)? (Forgot, have to get rid of the moon too.)
Air pressure differences. Highs and lows. Particularly inside to outside of hurricanes and T. storms, as well as pressure variances caused by lightning.
Only thing I can say…good and interesting blog post, which for the sake of the truth I could not go down to the end of it….but never the less….. in my understanding and opinion is horribly wrong….it still relies in short term internal variability…. the famous Phil and Treb still be LOLing at it..:)
Guys please stop trying a be a LOLing stock with your faulty approach…..“
cheers
Can you enlighten us with some detailed objections? Or are you just stuck on the teachings of the Church of Warming?
And the takeaway point is- One who can not predict ‘wind,’ can not predict climate change. Just one more item (maybe the most important?) the models fail to account for.
But ocean heat content, and total Earth system heat content, continue to rise: https://skepticalscience.com/graphics.php?g=46
Maybe… This is tantalount to pretend the ocean temp are known with better than 0.005 K precision.
Do you really believe this ?
Only a fool would believe this level of accuracy. That’s what they’re counting on when they spin their b.s. and emphasize nonsense like this. This is the very definition of that new term, “altenative truth”!
More ignorants than fools. They have no clues about basic physical facts, magnitude and accuracy are unknown to them.
They don’t believe in such a level of accuracy, they just don’t know it would be required to make their belief a fact
ocean heat content is just not known yet. Argo is so young and still insufficient a program.
W Rost’s postscript was also interesting, where he discusses the mixing of waters at depth. How can the alarmists claim such accuracy of measurement with that much intermixing taking place?
They extrapolate energy from sea level rise change, which they guess the sources of.
“But ocean heat content, and total Earth system heat content, continue to rise:”
WR: Indeed, the ocean heat content is absorbing most of the Earth’ extra heat content but that doesn’t impress me that much. It seems that it takes 870 years to have the ocean temperatures rise with 1 degree because of the energy uptake. For the calculation: see the link under my comment Wim Röst January 26, 2017 at 2:40 pm.
The ocean heat uptake is minimal if compared to the cooling capacity of the ocean. And we nearly don’t know anything at all about ‘that big ocean cooling’. Really incredible.
So true. Oceans cool convectively and heat by radiation. The CAGW acolytes worship data collected by their hallowed thermometers which fail to measure latent heat from vaporizing water.
paqyfleyc and john harmsworth
I encourage you to first study and understand the issues around precision temperature measurement!
See: Strouse, Gregory F. “NIST Realization of the Gallium Triple Point.” Proc. TEMPMEKO 1999 1 (1999): 147-152.
“The gallium triple point (302.9166 K) instead of the gallium melting point (302.9146 K) is used at NIST in the
realization of the International Temperature Scale of 1990 (ITS-90). F . . .
The assigned expanded uncertainty (k = 2) for the twelve cells is 0.04 mK. ”
I.e., temperature sensors can be calibrated to +/- 0.000 04 K at 302.9146 K
Then examine how sensors are calibrated, drift etc. in the ARGO systems. e.g.
Stability of Temperature and Conductivity Sensors of Argo Profiling Floats, Eitarou Oka, and Kentaro Ando, 2003
http://w3.jamstec.go.jp/J-ARGO/results/2003oka.pdf
Meaningless drivel! The accuracy of the instrumentatation is completely beside the point. The number of data points neccessary to give proper representation of the total volume of the ocean in terms of average temperature to any degree of accuracy such as this beggars belief. After you calculate the number of angels dancing on the head of a pin, you can work on this. And then you can try to turn that into total heat content. Give us a break! Most of you Warmunists are like Mikey Mann, you cant count to ten on your fingers without getting 11.005! Grow up!
except they didn’t use temperature measurements from argo especially pre-argo for the graph in question. So, do you stand by your claim of 0.00004K accuracy?
David L. Hagen you miss the point.
The point is, the coverage of ocean : ~4000 argo floats for ~4.10^8 km² / ~1.35 10^9 km3. That’s an average float for 100,000 km² / 340 000 km3
Even a perfect thermometer cannot give you a better that +/-1K themperature of just a swimming pool. Now, what about a 300 km square pool 3 km deep ?
paqyfelyc & harmworth
You must look at each component in the system. Instrumentation is one key part of the system and that shows measurement capability. As you point out, sampling is also important. So is averaging large numbers of points.
Rather then denigrating, castigating, falsely labeling those you do not know, try addressing the science and ALL the uncertainty issues involved rather then trivially dismissing everything!
David L. Hagen
The very first step to knowledge is to say “i don”t know”. Those who pretend to already know impede learning. They deserve denigrating and castigating (although I don’t do that much).
Argo is a wonderful step forward, that i surely not dismiss nor mock. But it’s still far from enough. It’s not so expensive, and i guess it could had been stepped up a magnitude for the price of a few bird-chopper. too bad it wasn’t.
paqyfelyc Check first. 7 wind turbines/year for the cost of Argo temperature. Argo Cost $25,000,000/year. $200/temperature profile. “* How much does the project cost and who pays?
Each float costs about $15,000 USD and this cost about doubles when the cost of handling the data and running the project is taken into account. The array has roughly 3000 floats and to maintain the array, 800 floats will need to be deployed each year. Thus the approximate cost of the project is 800 x $30,000 = $24m per year. That makes the cost of each profile around $200. 28 countries have contributed floats to the array with the USA providing about half the floats.” “The temperatures in the Argo profiles are accurate to ± 0.002°C and pressures are accurate to ± 2.4dbar. ” http://www.argo.ucsd.edu/FAQ.html
Wind turbine costs
Commercial Wind Turbines
“The costs for a utility scale wind turbine range from about $1.3 million to $2.2 million per MW of nameplate capacity installed. Most of the commercial-scale turbines installed today are 2 MW in size and cost roughly $3-$4 million installed. ” http://www.windustry.org/how_much_do_wind_turbines_cost
Too bad CAGW theory is that the land surface temps will rise significantly not that the oceans temps will rise 0.01 degree. Your graph shows no acceleration in land temps the basis for CAGW. Not to mention I don’t ever recall there being land bouys that go up and down in the land to measure the heat content or ice. Furthermore, to get the heat content of the atmosphere one needs to know all the variables since temperature is not equal to energy. The relationship is not even linear.
That is the fatal flaw in the CAGW theory, equating temperature to energy, and also the flaw in this paper.
Case in point el-nino can change the global temperature by centuries average in one year. El-nino is just a change in wind pattern moving air from once place to another. What other changes are occurring that may account for the temperature changes that aren’t as drastic.
This article may highlight one, but it by no means accounts for all of them.
fine, but hardly enough. This need some calculation of involved power.
How many water gets upwelled, what temp is it etc.
We don’t know that much about upwelling and mixing. What we know is an estimation that by downwelling at the poles in one year a million cubic kilometer goes down. And that million cubic kilometer has a temperature between – 1C and +5C. And when one million cubic kilometer goes down, it somewhere has ‘to come up’.
Besides that there is a lot of ‘mixing’, a term that is mostly used for movement of layers above the thermocline. The thermocline is the rather sharp boundary between the rather thin surface layer and the mass of very cold deep ocean water (see the first article about upwelling). But in between that surface layer temperature differences might be some 20 degrees between the different layers and ‘mixing’ will change surface temperatures a lot. Or NO mixing will NOT change the surface – and then we get warming.
I agree, we need to know all about it.
I mean, i am pretty sure the mechanism exist, and has some effect. But how much “some”? ~100 W, 1 W, or 0.01 W?
Makes a hell of a difference
paqufelyc “I mean, i am pretty sure the mechanism exist, and has some effect. But how much “some”? ~100 W, 1 W, or 0.01 W?”
WR: I suppose we will be surprised. And I am sure one or more people on this site will do some calculations about the forces involved.
Very nice work Wim! It should be published. The question that popped into my head is, what causes the average wind speed to vary over periods of decades and even centuries? Is it just random fluctuation. Your work seems to show that global warming does cause hurricanes. But hurricanes cause global cooling!
I read an article recently that wind speeds are reduced around the planet compared to historical records. This would certainly correspond with my recollection of almost 60 years lived on the Northern Plains. It was a lot windier in my youth.
“what causes the average wind speed to vary over periods of decades and even centuries?”
WR: a very interesting question but one without a simple answer. In it’s most simple form, daily wind varies because of pressure differences and pressure differences mainly are caused by temperature and water vapour content differences. But, over decades, centuries, millennia and even millions of years things like global temperature gradients, ocean deep water temperatures, ocean surface temperatures, variations from place to place, the quantity of ‘warm surface layer water’, the extent of the warm surface layer water, orbit changes, season effects (because of orbit changes), ocean surface (which is smaller during glacials), topography of the oceans and continents, forms and positions of the continents, changing currents, ice and snow coverage, distribution of fresh and salt and very salt water, vegetation etc. etc. will play a role.
So, I only pointed at some important things I saw. But there is much more, often only partly understood. But, a very interesting question, leading to a nice puzzle.
As above..check topic on pressure here…https://reality348.wordpress.com.
Finding a nice thermocline or halocline is possibly a matter of life and death. link
Ping! Hear, Hear!
1000 m or 1000 feet ? ” direct readings ”
Titanium hull ? ( OLD submariner ….IC1 (SS)
Oh, Duh…read more. “remote wired sensors”
Care to share more info ? I know that a super typhoon mixes water waay below 600 feet ….
Thanks.
Checked: 1000 meter
From the coolest article I’ve read today! Before this one, of course!: Each night for example in ocean pastures far out to sea the phytoplankton on the surface is beset upon by zooplankton that rise out of the dark abyss to graze in the relative safety of the dark of night. This nightly migration is widely known as ‘the greatest migration on earth‘ as it contains herds of different zooplankton far more diverse and in infinitely larger biomass than the migrations of the great herds of wildlife on the African savannahs.
Clearly the nightly migration is governed by darkness as it is curtailed when the moon is full and there are few clouds and maximized during the darkest of nights. By dawns early light the multitudes are sinking and swimming back down to the darkness and safety with bellies full and bulging with phytoplankton. During the day those fattened ‘zooplanktor cows’ rest on the deep thermocline the boundary layer of dense water that separates the productive and daily mixing upper ocean from the deep layer where mixing takes place but on a time scale of centuries not hours.
http://russgeorge.net/2017/01/26/ai-plankton-bots-swarm-and-swim-to-help-save-blue-planet/
This guy turned a projected salmon run return of 50 million fish into the largest return ever recorded, 300 million fish. At least from what I’ve read, he did!
Read on its own, seems plausible, as does the Milankovitch cycles, as does Svensmark’s hypothesis, as does Willis’s thermostat theory, and yes, even CO2 considerations probably have a place. If only some genius could put all of them together and help us understand why the climate changes.
There are no grants for geniuses. They tend to be too “agnostic”. Besides, the trough is pretty crowded.
genius already proved that this is a “hard problem”, that is, not understandable.
That is, climate can change without any cause at all. And, causes may have any counterintuitive effects: more energy could reduce temp, for instance.
This is archetypal chaos, after all.
‘That is, climate can change without any cause at all’
mmm. Would like you to expand on that.
Chaos.
DNF 1963.
@katio
http://eaps4.mit.edu/research/Lorenz/Chaos_spontaneous_greenhouse_1991.pdf (that’s, in a less cryptic form, what ptolemy2 refered to)
https://wattsupwiththat.com/2016/09/04/chaos-climate-part-3-chaos-models/
@paqyfelyc. Many thanks for this introduction to Chaos Theory.
katio1505 “If only some genius could put all of them together and help us understand why the climate changes.”
WR: It helps as we realize that climate always changed. As weather, as seasons, as orbit alsways changed. And that we are living in a rather stable, nice and warm period. But perhaps we need to ‘balance’ our fear for ‘warm’ with a bit of fear for ‘the cold’. Not that ‘fear’ is a must, but ‘balanced thinking’, taking everything into account is a must. It helps also that in the future ‘man’ probably has endless opportunities to change what we want – compared to what we can now. Increasing our knowledge about reality is the first thing that we must do now.
Thanks pt2. That clears that up!
Interesting piece of work. Thank you
My inclination is that fundamentally differing sea temperature cells and air pressure drive air flow. This does not mean that wind cannot influence mixing and the fluid dynamics. Once differing pressure and temperature accelerates wind velocity this wind could act as a positive feedback.
Is is easy to falsify a theory. You just have to find one weak point.
I think like that:
1. Some tenth’s of meters wind speed don’t make so much difference in upwelling.
2. The real big upwelling thing is El Nino / La Nina in the Pacific Ocean which makes one third of the earth’s circumference. El Nino digs out the hottest water in the oceans from some hundred meters depth. Nothing compares to this. La Nina and ENSO Neutral dig out cold water comming from the Antarctic via Humboldt Stream.
So there seems just not enough place for an additional process.
Well I see the problem that your own data contradicts your hypothesis:
If the wind has been increasing and the wind is responsible for upwelling and cooling, then temperatures should have been going down not up. It seems to me that if the data is true, we have now both more wind and higher temperatures which contradicts your hypothesis.
But I don’t think you can trust that wind data the least. There’s quite a lot of bibliography on winds decreasing in many places during the last three decades.
Javier: “If the wind has been increasing and the wind is responsible for upwelling and cooling, then temperatures should have been going down not up.”
WR: When you look at the rising mean, you would expect a cooling temperature effect in time. Which is there: compare the Pause with the period of Warming before. When you look at the average left of the red line (on the average a lower wind speed in a warming period) and then right of the red line (a higher wind speed in a period with no [substantial] warming), than that is in line with the theory. On fig. 2 and fig. 3 you can find many areas that exactly show this pattern: more wind, cooling, less wind, warming.
Of course the question remains: why is wind speed rising during the Pause? Future data (and/or more data from the past) must show. Is a rise in sea surface temperature a reason for a higher average wind speed? If so, than that’s is a negative feedback mechanism: cooling will be the result. The system stabilizes itself in this way.
“Is a rise in sea surface temperature a reason for a higher average wind speed?”
Isn’t the answer to your question “of course”. (i kind of thought that was well known) The temperature of the upwelling waters stays essentially the same, while the SSTs are what changes. That creates a change in pressure differential which drives wind speeds. This spells trouble for agw theory in that the more we warm the faster the heat will be transported into the depths…
Javier, i think that the higher wind speeds are caused by warming temperatures, which in turn then drives the ocean overturning that causes the pause. (so the more we warm, the faster heat sinks into the ocean)…
Wim. On the wind speed time series, it looks like global winds were often slow prior to El Niños, which are associated with slowing trade winds. El Niños cause higher global temps because water that was buried deed in the West Pacific Warm Pool, sloshes back across the Pacific so the heat that was buried below the surface is exposed to the atmosphere. El Niños are upwelling events that warm the plant. But the warming is brief. Over the longer term, El Niños liberate heat from the ocean/atmosphere system. Heat that was trapped in the deep warm pool, floods into the atmosphere were it can then radiate to deep space.
The spikes in wind speed correspond to El Niños, suggesting that warmer sea surface does cause higher wind speeds. You responded to Javier with, “When you look at the rising mean, you would expect a cooling temperature effect in time.” In other words, wind speeds have been increasing so the warming from the early 1980s to the late 1900s should be slowing down, hence the pause.
That seems possible but its hard to reconcile the fact that it was cooler in the 1980s when winds were slower and warmer in the 2000’s when winds were higher. I guess you’re saying the effect is gradual and, since winds speeds have been gradually increasing, we should expect temperatures to first stall then start falling—if winds keep increasing (?).
If your theory is correct, you have linked wind speed to ocean mixing to global temperature. But why have average winds been steadily increasing for 30 years? I’ve been looking at a similar problems. There is some evidence that global temperature are linked to the Atlantic Multidecadal Oscillation, perhaps because it governs flow of heat to the poles. But what governs the AMO?
Perhaps it’s enough to say that natural fluctuations in global heat exchange between the oceans and the atmosphere can cause large fluctuations in global temperature and, since the ocean/atmo system it is interlinked and turbulent on large and small scales, it a chaotic system that is not easily understood or modeled.
It may be that it is impossible to accurately model changes of a few degrees in global temperature. In fact, sitting in a room with the windows open on typical afternoon it would probably be impossible to model temperature and predict changes of a degree on even a one-meter by one-meter three dimensional grid.
This is not so bad though. If we could know the future, there would be little incentive to live in the present.
Thomas, i know you were hoping for a reply from wim and are none too happy about getting a hood in a leather jacket in his stead (but here goes anyway)…
Not so sure about how el ninos cause warming as you are saying. The waters that roll back are (apparently) no warmer than the SSTs that they are rolling back into as they were once just sea surface waters themselves. What i think happens is that when the waters roll back the upwelling in the eastern pacific ceases and therefor there is a breakdown in not only the thermocline, but virtical mixing as well. Since the water is stagnant, as wim points out, there is warming. Waters beneath the upper most layer actually are cooler than average. i’m going to leave you a link to dr spencer’s take on why it is that el ninos cause warming after my comment here. (it’s a pretty good read)…
i think wind speeds have been increasing over time because SSTs have been rising over time. Water that upwells from the deep stays essentially the same temperature. It’s the SSTs that change. This would cause the walker cell trade winds (easterlies) to speed up due to a change in pressure differential. Once we reach peak warming (the pause), trades no longer speed up, so i’m not so sure that we should expect eventual cooling from this particular mechanism. It should be mentioned also, that a change in cloud cover is associated with the pause, so it could be difficult to untangle cause and effect here. (But we try… ☺)
http://www.drroyspencer.com/2016/01/what-causes-el-nino-warmth/
In response to Thomas and Afonzarelli:
The link to the post of Roy Spencer is an interesting one. Some phrases:
Roy Spencer: “In a sense, the deep ocean provides an air conditioner for the climate system, and during El Nino the air conditioner isn’t working as hard to cool the atmosphere. During La Nina, it’s working harder than normal, leading to global-average coolness
(…)
But we demonstrated that as El Nino develops there is an increase in radiative energy input into the global-average climate system which precedes peak El Nino warmth by about 9 months. This is mostly likely due to a small decrease in low cloud cover associated with the changing atmospheric circulation patterns during El Nino (La Nina would have increased cloud cover).
(….)
…. are not sufficient to explain the net warming effects of El Nino. That instead requires (in my view) a global-average decrease in the mixing of warm surface waters and cold deep waters, as I have outlined above.”
WR: I fully agree with Roy’s: “the deep ocean provides an air conditioner for the climate system”. Wind puts the air conditioner on and off.
Bob Tisdale was writing interesting things about the role of ‘cloud cover’ in relation to El Nino / La Nina. Somewhere he states that the cold tropical seas of La Nina in fact are the cause of an energy gain (!) by the Earth. The cold sea surfaces causes cold air to descend and flow away over the surface, as is usual in high pressure area’s. High pressure areas (as we use to find in dry and relatively cold places) give sunny weather, which in the tropics (!) result in a high heat uptake by the ocean waters, resulting in a heat gain for the system as a whole. Warm seas (look at what Willis Eschenbach wrote about clouds and thunderstorms) result in the formation of clouds that by their reflectance ‘balance out’ and keep the system more or less stable.
It is important to look at WHERE the processes take place. A high pressure area in the tropics has a different effect for the Earth as a whole than a high pressure are on the poles or in between has. The same for low pressure areas. Think about the ‘Blue Blob’ that recently developed in the Northern Pacific (while la Nina seems to be weak). The Blue Blob started in autumn at a latitude where sun was whether disappearing or was remaining ‘low above the horizon’, resulting in a low energy uptake by the oceans during many months. And resulting in a big energy loss during long and more cloudless nights. Quite different from the effect of a high pressure area at the equator.
To understand what is happening, we always must go back to the basics. The basics here are, that even without any (!) heat uptake or heat loss by the Earth as a whole, the surface temperatures may change, whether showing ‘cooling’ or ‘warming’, just because of the role of cold water being mixed with the warm layers at the surface or ‘not being mixed with the warm layers at the surface: fig. 8 above. Or, as Roy says about the net warming effects of El Nino: “That instead requires (in my view) a global-average decrease in the mixing of warm surface waters and cold deep waters (…)”
Wim:
This looks like a case where your hypothesis is correct either way. If temperatures go down (which they didn’t) it is the increasing wind. If temperatures go up (which they did), they didn’t go up more because of the wind. Then it is not the wind who is driving temperatures, clearly, as they go in the opposite direction. Besides if your hypothesis was correct one would expect the rate of wind changes should match the rate of temperature changes, which they don’t. The rate of warming started to decrease in the late 90’s not in the 80’s
http://i.imgur.com/hiD7GoK.png
Thanks Javier. ‘Time lag’ and ‘regional circumstances’ play a role. To understand and test the theory it is best to first look at a regional scale and to look in second instance to the ‘spread out effects’ of cooler ocean waters. And the ‘spread out effect’ is a main input for changing wind patterns.
The relation between regional winds and regional ocean temperature effects is best seen on fig. 2 and fig. 3 and those figures confirm the cooling role of winds in combination with upwelling/mixing. Because upwelling and mixing are reacting at a local scale and wind performs patterns at a regional scale, any proof of the theory can be found especially on the regional scale.
The effects of upwelling and mixing will be wider than the region where upwelling / mixing occurs. Currents transport the from upwelling and mixing resulting colder waters to other places. Example: the present Blue Blob in the Northern Pacific.
For accumulated warm waters it is the same. Accumulated warm water near Indonesia spreads during an El Nino over last surfaces. The extended cold/warm areas influence wind patterns in second instance.
The influence of surface temperatures on ‘wind’ is more complex than the influence of ‘wind’ on sea surface temperatures: more wind enhances mixing and upwelling on for upwelling and mixing sensible places. The theory is about this last one, but I don’t close my eyes for the effects of colder waters on ‘wind’. But then we must take into account a certain ‘spread out effect’ of the cold (warm) surface waters.
About the warming period you say: “If temperatures go up (which they did), they didn’t go up more because of the wind.” I don’t know the wind speed during the cooling period before last warming, let’s say wind during 1950-1975. According to the theory wind speed should have been higher than during the warming quarter 1975-2000. It would be nice to see the data. It would be best to get the data for ‘ocean wind’.
If the theory survives, it will be interesting to see what the effects of the mechanisms are on the global scale. For example, strong regional cooling at upwelling places because of their spreading effect can bring down regional / global temperatures and enhance ice and snow. The extending ice and snow diminish the temperature gradient with the tropics ( the more in specific seasons – important as well!) and will enhance wind: an ‘Abrupt Climate Change’ pattern seems to develop. And what is interesting to know, is what the exact conditions will be that will lead to such a cooling enhancing pattern.
The least we can say for now is that upwelling/mixing probably plays an important role in cooling the surface of the Earth and that ‘wind’ is an important and uncontrollable factor.
Wim I do not think you are “showing” anything here. You claim in reply to a comment below by me that surface circulation does not dominate. To be honest you are just pulling this out of the air ( no pun ). You have no comparison of any sort , why do say one ‘dominates’?
Bob wrote this 4 or 5 years ago and I think was a great insight. However, I do not recall him ever saying it was the air warming the oceans. It is incoming solar which inputs heat energy into the climate system and it is primarily warming the oceans. The rest in internal redistribution.
La Nina is when OHC is increased, El Nino is when some of this is transferred to the atmosphere ( and eventually out to space ).
Your figs. 6 and 7 could equally be the equatorial section of Pacific in El Nino / La Nina states .
That last sentence is to illustrate the similarity to what you are saying and is not new. This is point I tried to rise in my earlier comment below. ( much lower ).
So, if this “wind, upwelling and mixing” has so massive an effect, as asserted in the article, how is that the 20-plus “best” global climate models used by the IPCC totally missed these effects . . . and thus missed predicting the recent 15-20 year-long global warming hiatus?
Are the computer global climate models so short on basic understanding of climate drivers and interactions???
So wait a minute! Does this mean that all of those wind turbines taking all of that energy out of the wind are actually contributing to global warming?
Well, if the theory is right, then you are right…..
☺
Even without the consideration of this article, Wind turbines convert kinetic energy from the wind to electricity and when the electricity is used the energy is converted to heat.
Wind turbines will heat the earth, just as solar panels heat the earth in the same way.
The question is whether it is more significant than other means of energy production and it it significant in the big picture.
“So wait a minute! Does this mean that all of those wind turbines taking all of that energy out of the wind are actually contributing to global warming?”
Of course, they are turning kinetic energy into heat !
That heat will likely lead to more advection and increasing winds , better than burning limited resources if we can properly exploit and irregular power source.
You go first , don’t use any fossil fuels, I will still use them because they are not as limited as you think and putting more CO 2 into the atmosphere is not as bad as many claim who want to redistribute wealth as their ultimate goal. We are improving our fossil fuel supply with technology every day, unlike trying to depend on 13th century technology.
Nice article.
One point I thought was very interesting and I wouldn’t have expected that.
“a) We witnessed one severe winter storm system in 1984 change the temperature profile for at least 1000 m depth.”
For winds moving ocean water, I always like the ENSO regions. For perspective, the region shown here is 20,000 kms wide! Its complex, it moves fast, eddies and counter currents build up all over the place.
Thanks Bill. Yes, “a) We witnessed one severe winter storm system in 1984 change the temperature profile for at least 1000 m depth.”: to be honest: I also was surprised. I suppose it must have been a very strong storm system that lasted many days in the same region. And perhaps some eddies helped. But even when it is exceptional, it shows how strong the power of – in this case – mixing is. And the effect of ‘no mixing also: no mixing means a stronger stratification of the Sea Surface Layer which results in warmer SST. Without extra energy.
I love looking at graphics and/or maps like the one you show here. Interesting in the Pacific near Middle America are the two green/blue belts that develop exactly there where you can see (on other maps) stronger winds enter the Pacific from the Carib: upwelling regions. Another type of upwelling are the blue swirls that develop around the equator. This seems to be due to Coriolis and Ekman forces: the surface water moves at 45 degrees from the equator while the wind is parallel to the equator. The upwelling which is the result, diminishes the depth of the surface layer, which is visible in graphics that show a North-South section of the surface layer. That surface layer is varying in depth and extent, varies in time as well and its characteristics have important consequences for climate. Enso is a decadal example, but on other timescales there are consequences as well. I am studying on this, might be a subject for a future post.
Another interesting area in the above animation is the area with the continental shelves of Australia and Indonesia/South East Asia. During the Glacials when sea levels were 120 meter or a bit more lower than they are now, water transport between the Pacific and the Indian (and so between the Indian and the Atlantic) must have been different: the shelves mostly became land. This Influenced SST, pressure differences, upwelling etc. Endlessly complex. It remains a challenge to catch some ‘main lines’.
Thanks for that comment Wim. I have been intrigued by this affect for years. There are articles correlating plankton/phytoplankton and good fishing in the eddies created by the “gap” winds coming across Central America. Your charts and others make it look like there is pretty good heat transfer from the Caribbean to the Pacific. That probably isn’t the reason but it is an interesting graphic that I don’t understand. Just the equatorial heating? Doesn’t look like it to me.
Good article.
Thank you Wayne. It is a very dynamic process as you can see in Bill Illis’ animation as well. Upwelling is directly reacting on winds that often have a seasonal and/or decadal character (ENSO). Upwelling is very different during other ‘climate constellations’ as during the glacials or in the Eocene and Pliocene. Today’s wind pattern you can see very well at https://earth.nullschool.net/#current/wind/surface/level/orthographic=-88.43,13.43,2958/loc=-149.524,-17.561 and today (Friday 27th) the wind pattern is such that the three ‘holes’ in Middle America are clearly visible. You would expect low sea surface temperatures but right now you will find exactly on those places ‘warm anomaly’s’, reflecting that the wind pattern in the last days have been different from the ‘normal patterns’ (which you can check on the animation above). For today’s SST anomaly’s: https://earth.nullschool.net/#current/ocean/primary/waves/overlay=sea_surface_temp_anomaly/orthographic=-88.53,13.41,2958/loc=-94.360,15.197
The effect on fishing is interesting and the subject of many publications. For those who are ‘new’ on this subject:
“Approximately 25% of the total global marine fish catches come from five upwellings that occupy only 5% of the total ocean area.”
“Upwelling regions therefore result in very high levels of primary production (the amount of carbon fixed by phytoplankton) in comparison to other areas of the ocean. They account for about 50% of global marine productivity.”
Source: https://en.wikipedia.org/wiki/Upwelling
It is funny to read articles about the effect of upwelling on fishery and to discover that some of them mention the ‘local /regional effects’ of upwelling for the climate, while nobody looked at the global effects of upwelling (and mixing). The feeling that ‘all is changing but on the average remains the same’ must have been common. The same for the modellers and the AGW scene. Missing ‘half of the story’: cooling. And missing the main point: that Earth’ surface temperatures can change a lot without energy loss or energy gain……. . Just by internal variations in the system.
Tiny changes in water qualities make big differences. The same for weather patterns in the atmosphere. The chaotic character of movements in water and air reveal the complexity of the processes involved. An always fascinating experiment is ‘a drop of milk (or tea or even a drop of salt water) in a glass of water’. The effect never is the same. It is the most easy experiment and one that gives a lot of insight in atmospheric and oceanic complexities.
The mantra of warmist scientists has always been, “We can’t think of anything else but CO2 to explain warming.” This greater wind riving greater oceanic mixing causing global cooling hypothesis is that something else. This is a very important theory.
I live on South West Australia and there has been something unusual going on out to the south west of us. The SST anomaly for the last 9 months has been between -2.5 to -1.5 consistently. There has been consistent bursts of very cold air from Antartica from the same general area during that period and we had the coldest winter for 40 years and summer so far has been incredibly mild. In that entire period we have had nightly minimums of about 2C less than the long term average. I guess this might be wind driven upwelling cooling the surface? Or is it simply wind driven cooling by enhanced evaporation? Is it simply that colder air from the Antarctic is reaching further north than usual? The ’cause and effect’ is not clear to me, but for sure there has been a significant change of some sort. The same, almost fixed, pattern of weather in the last 9 months has given the east coast their current intense heat wave and New Zealand is having unseasonal summer snow…
Wim Röst
My compliments on your post in laying out and developing a very important hypothesis on wind driven ocean and temperature changes.
As you noted, the wind stress varying with the cube of the wind speed is very important. Suggest especially graphing the energy in the wind, not just the speed.
Thoughts:
Can you show lead/lag between wind and ocean temperature changes? ie to distinguish causation from correlation.
Can the changes in temperature profile with depth (Fig. 8) be shown from the ARGO temperature data?
The wind driven ocean changes should also be evident in changes in the height distribution of the oceans, and thus in the gravity changes measured by the Grace satellites.
Best regards.
Thank you, David L. Hagen. The importance of wind stress varying with the cube of the wind speed can not be underestimated. Especially when ‘special circumstances’ develop which you can expect when the climate system of the Earth is making an important ‘switch’: wind will play an important role. And so oceans, both the surface layer and the deep ocean waters.
About your thoughts:
“Can you show lead/lag between wind and ocean temperature changes? ie to distinguish causation from correlation.” WR: no, unfortunately not. I can read maps and graphics very well but I am lacking the very technical skills that are requested to be able to answer this question. But perhaps other people can deliver nice graphics.
“Can the changes in temperature profile with depth (Fig. 8) be shown from the ARGO temperature data?” WR: Some mixing must be shown by ARGO data. They measure temperature and salinity up to 2000m (unfortunately mostly not until the bottom). But there are some problems. First is the small number of the ARGO buoys (on 360 million square kilometers of ocean) and second their moving character: they are floating around. But perhaps the most restricting is that up to now ‘upwelling’ and ‘mixing’ remained out of sight of global climate research. There must be data (as there must be accurate submarine data as well) but so far I did not see results in respect of specifically upwelling and mixing. I hope this theory will be tested with buoy data. For that, I would like to exchange windparks on sea for a real extensive network of fixed buoys that start measuring some ‘cycles’ of sea water movements all over the oceans. As we expect 60 or 70 year cycles that must be during more than a century. For being able to act on climate change in the future this would be the best we could do for now.
“The wind driven ocean changes should also be evident in changes in the height distribution of the oceans, and thus in the gravity changes measured by the Grace satellites.” WR: I am not a specialist on satellite technology as well. Horizontally those satellites will give an image of the temperature distribution over the oceans after corrections. But three dimensional mixing and upwelling??? I am afraid that they can not represent that good enough and that we anyhow need an extensive network of fixed buoys.
Wim Rust See graphs of “ocean bottom pressure” = height of ocean * density, by gravity changes from Grace satellites. See “visualization shows monthly changes in ocean bottom pressure data obtained by the GRACE satellites from November 2002 to January 2012.” Article https://svs.gsfc.nasa.gov/30503 e.g., One image: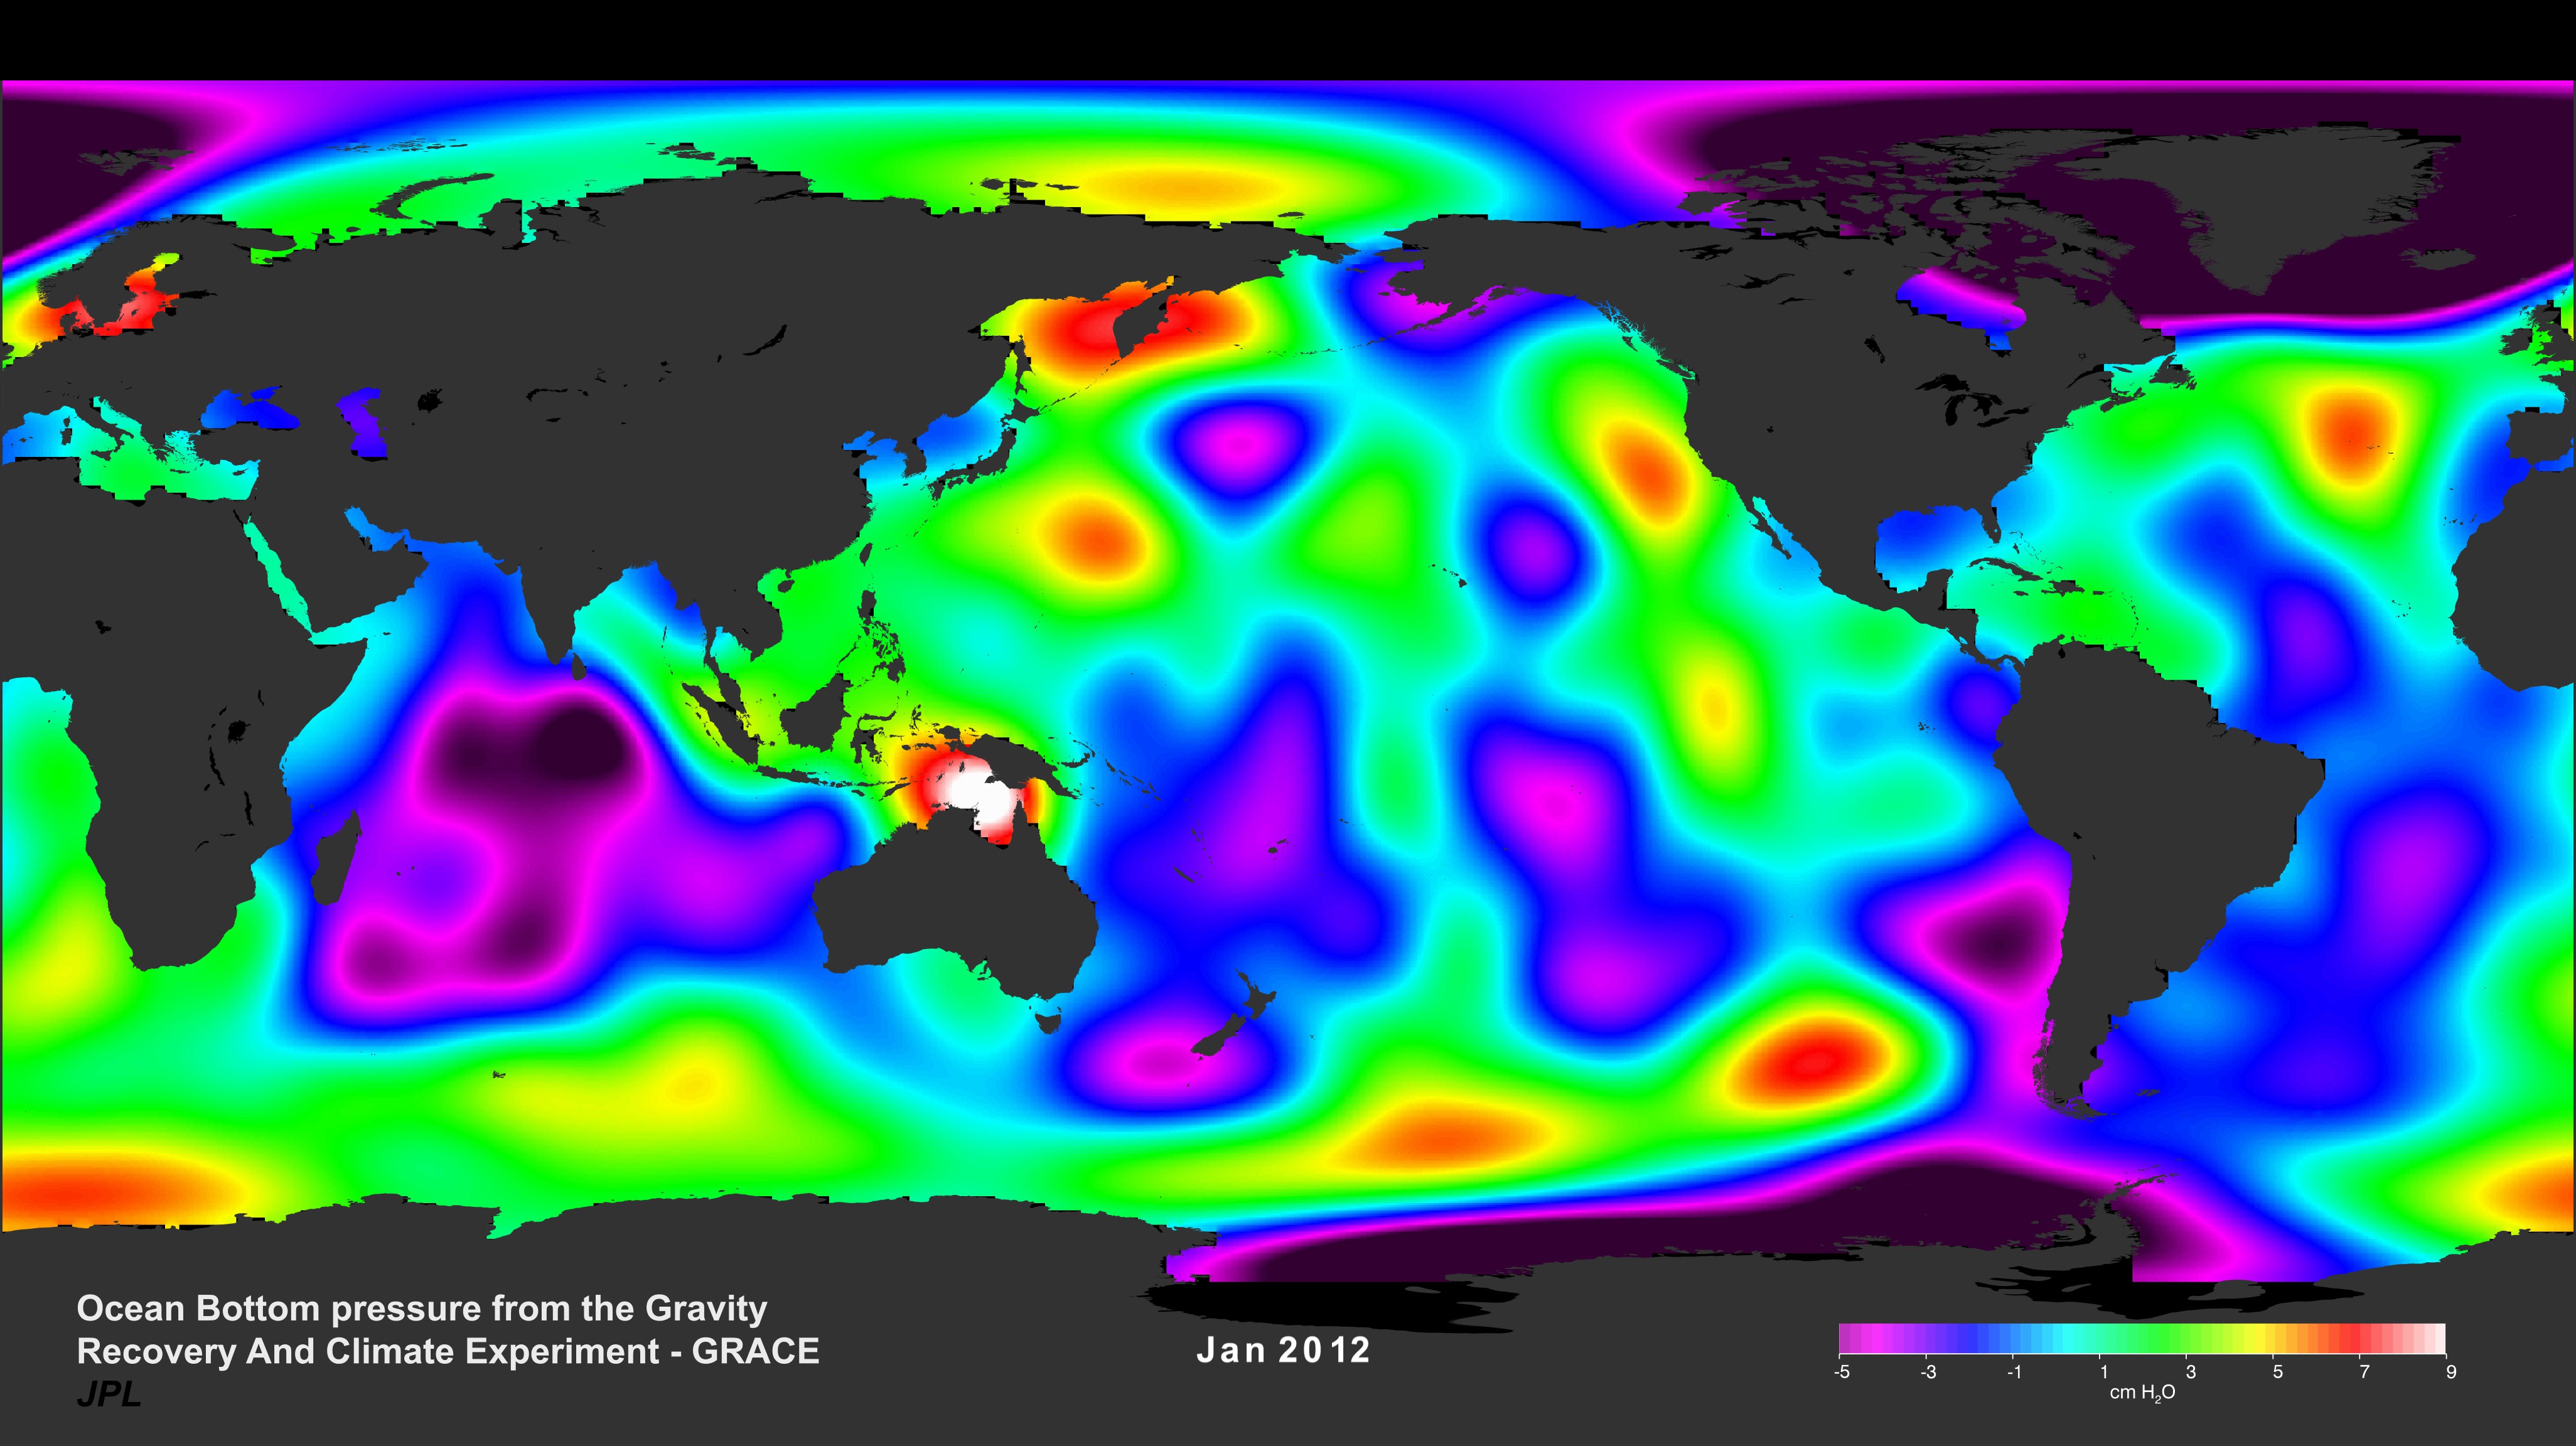 The data is there. This article may get you started by giving you the month by month graphs of heights across the oceans to compare with your other graphs above. Best regards.
David, I followed your link after ‘see’ and found “Ocean bottom pressure is the sum of the mass of the atmosphere and ocean in a “cylinder” above the seafloor”. To know something about the water column means that we have got to subtract the weight of the air column (at the moment of registration) from the total column. But, the weight of the air column is not known.
Excellent article Wim!
Many important insights and the foundation of a new paradigm of climate science.
I have always cringed at the use of the word “forcing” as if temperature change can’t happen without it. As if the climate system had no heat capacity.
Thanks Wim for some much needed climate sanity!
It’s a pleasure, Ptolemy2