Guest essay by Caleb Rossiter
Primum non nocere — above all, do no harm, says the medical maxim. In public policy, where every action has different effects on different people, the maxim becomes “above all, do no net harm.” That means that the benefits of a policy should outweigh its costs. For example, it’s all well and good for the government to start a jobs program, but we also have to estimate how many other jobs would never exist because raising taxes to pay for the program reduces private investment and consumption. What, we properly ask, will be the net effect of the program on employment?
Consider the Obama administration’s efforts to avoid fossil-fueled climate catastrophes. While well-intentioned, these efforts to reduce industrial emissions of carbon dioxide and other “greenhouse” gasses did a lot of net harm to the people of the formerly colonized countries in Africa, Asia, and Latin America. Indeed, Obama’s policies were reminiscent of colonialism’s attempt to make these regions producers of raw materials rather than industrial competitors. Obama’s climate alarmists discouraged poor countries from building power plants and modern transmission grids, and instead offered foreign aid to help them stay “off the grid” with small-scale wind and solar projects. The administration also drove up the price of food in poor countries by diverting crops to meet “green” fuels quotas, and stood by while the European Union punished these countries for exporting “carbon-intensive” products. The moral issue here is that the costs of the predicted climate catastrophes are hypothetical, meager, and in the distant future, while the health and economic benefits of fossil-fueled growth for poor countries are real, massive, and available right now.
In terms of health, people need reliable power in their homes, factories, and offices. If they cannot get it from electricity they will get it by burning wood, dung, and charcoal and firing up their personal diesel generators. In Africa, where only 25 percent of homes have reliable electricity and most factories and office suffer from frequent black-outs, the particulate matter emitted by these inefficient energy sources pose a constant crisis in respiratory disease. In terms of economic growth and the increase in life expectancy that it creates, we can simply note that since embracing fossil-fueled capitalism with a vengeance China has nearly eliminated its 20-year gap with the 80-year life expectancy of developed countries, while Africa lags at 59 years.
Here are five steps President Trump can take to stop us from doing harm, and maybe even start us doing some good, in the developing world’s quest for the better and longer life that reliable electric power can bring.
Generate Power: Instruct U.S. representatives at the World Bank and the regional development banks, as well as officials of the Agency for International Development (the State Department’s foreign aid office) to support rather than oppose, as we currently do, loans and grants for power plants that rely on coal, gas, or oil. By helping countries build modern, efficient plants outfitted with “scrubbers” we can dramatically cut emissions of sulfur dioxide and other particulates. Unlike carbon dioxide, which is a beneficial trace gas that increases crop yields as a fertilizer, these are real pollutants, and need to be controlled.
Support the Grid: The Obama administration’s Power Africa campaign is biased in favor of “off-grid” solutions such as small-scale, local wind and solar farms. This is colonialist to the core in a continent that is still “under-developing” by exporting raw materials to its former masters in return for imports of finished goods. Africa needs to have consistent power for factories and offices, or it will never be able to compete in the global economy. The only way to have consistent power is with a modern grid. Period. The grid can develop slowly, so that it can be maintained, but in the long run, as the success of China shows, you can’t get there without it.
Aid only sustainable infrastructure projects: Developing countries, and African ones in particular, are littered with abandoned “White Elephants” – high-technology factories, dams, processing plants, wells, and tractors provided by well-meaning foreign aid donors. They fell into disuse because recipient governments lacked the political will and the economic environment needed to sustain them.
Bringing technology in from a different country that is at a different stage of economic development is tricky in the best of circumstances. It is a waste of money and time if the recipient government is undemocratic, corrupt, or repressive. American diplomats and foreign aid officials need to be rewarded rather than punished, as they inevitably are in the foreign aid game, for properly assessing the likelihood of sustainability and cancelling projects. Most economic development comes when the local conditions permit it. Foreign aid can do little when dictatorship and corruption prevail, as they do in most African countries.
End biofuel requirements: “Biofuel starvation” is what Africans call it when companies from developed countries take over villages’ crop lands so they can make a profit meeting “green” fuel requirements. The Trump administration should drop our own ethanol minimums, and make it a principal point of trade and diplomacy talks with European countries to get them to drop theirs.
Oppose “carbon-content” rules: In their never-ending quest to find phony “carbon off-sets” that allow them to claim reductions in carbon dioxide without closing their own power plants, European countries have made a mess out of the simple act of importing goods from developing countries. Flowers from Kenya, for example, pay a carbon tax because they are transported on airplanes, which use more fossil-fuel per flower than a slower ship. As part of an international consortium on air travel, the United States can object to and reverse such rules, leading to more trade, and jobs, in developing countries. Congress enacted legislation in 2011 that blocked the consortium’s scheme to place a carbon tax on all air travel. As we protect our travel rights we should also look out for those of exporters in developing countries.
To achieve these changes, and to make them stick, Trump should make it clear that the paradigm of fossil-fueled climate catastrophe is being rejected. Under Obama nearly every department of government created empires of staff whose primary purpose appears to have been to spend taxpayer dollars demonizing greenhouse gasses. While it is possible simply to ignore, as many countries hypocritically have, the 2015 Paris Agreement and its voluntary “economy-wide absolute emission reduction targets” and the 1992 UN Framework Treaty and its reporting requirements, Trump should announce our withdrawal from them as a way to shock our domestic bureaucracy into doing less harm.
Presidents have the power to withdraw from agreements and treaties, as Carter did from our treaty with Taiwan in order to improve relations with China, Reagan did from the compulsory jurisdiction of the World Court to avoid losing a case about our war on Nicaragua, and George W. Bush did from the Anti-Ballistic Missile Treaty. The technical withdrawal will take a few years, because of the terms of those accords, but the announcement itself would put a stop to the gravy train of “climate finance” and climate reparations” that waste billions of dollars of foreign aid.
People often ask me why I am so calm in the face of claims of climate catastrophe. Well, for the past decade I have made it my professional business as a professor of statistics and mathematics to analyze the inner workings of the climate models that the United Nations climate propaganda arm, the IPCC, uses to claim that the majority of the half a degree increase in average global temperature from 1980 to 2010 was due to industrial emissions of greenhouse gasses. These models, which Obama believes make him the thermostat-in-chief, are wildly complex, yet childlike and almost still-born in the face of the workings of the chaotic atmosphere and the mysterious oceans they attempt to represent. Humorously, the same IPCC models assume that natural variation rather than industrial emissions caused a similar rise from 1910 to 1940, when these emissions were too low to have much theoretical effect.
But it is in the impact of the slight warming, whatever its cause, that Obama has become almost delusional and obsessed. For the past decade I have made it my students’ business to analyze the actual scientific studies on which the IPCC issues its frequent claims that climate catastrophes are happening now and will escalate after 100 years of similar warming. To their shock, my students found that in case after case the studies on storms, droughts, sea level, forest fires, malaria, and other imagined woes were only suggestive at worst. The effect of the single variable of temperature is extremely difficult to disentangle, using the few years of well-measured global data we have available, from the thousands of other known and unknown variables, trends, and happenstances that drive climate changes.
I have no doubt that greenhouse gasses will continue to cause some warming, though less than alarmists claim. And I have no doubt that the climate will continue to change, with or without industrial emissions. As it has in the past, humankind will deal with these changes – and much more effectively than in the past, thanks to modern technology and a more prosperous population. But after 35 years of intense study we have no reason to believe in President Obama’s predictions of planet-threatening consequences from more carbon dioxide. That is why I am so sure that claims of likely climate catastrophe are unfounded, and pale next to the benefits of cheap fossil fuels for poor countries.
Caleb Stewart Rossiter, Adjunct Professorial Lecturer, School of International Service and Department of Mathematics and Statistics, American University.
Glad there are some enlightened students out there. Thank you.
+1
COLE’S NOTES FOR TRUMP
http://wattsupwiththat.com/2015/06/13/presentation-of-evidence-suggesting-temperature-drives-atmospheric-co2-more-than-co2-drives-temperature/
Observations and Conclusions:
1. Temperature, among other factors, drives atmospheric CO2 much more than CO2 drives temperature. The rate of change dCO2/dt is closely correlated with temperature and thus atmospheric CO2 LAGS temperature by ~9 months in the modern data record
2. CO2 also lags temperature by ~~800 years in the ice core record, on a longer time scale.
3. Atmospheric CO2 lags temperature at all measured time scales.
4. CO2 is the feedstock for carbon-based life on Earth, and Earth’s atmosphere and oceans are clearly CO2-deficient. CO2 abatement and sequestration schemes are nonsense.
5. Based on the evidence, Earth’s climate is insensitive to increased atmospheric CO2 – there is no global warming crisis.
6. Recent global warming was natural and irregularly cyclical – the next climate phase following the ~20 year pause will probably be global cooling, starting by ~2020 or sooner.
7. Adaptation is clearly the best approach to deal with the moderate global warming and cooling experienced in recent centuries.
8. Cool and cold weather kills many more people than warm or hot weather, even in warm climates. There are about 100,000 Excess Winter Deaths every year in the USA and about 10,000 in Canada.
9. Green energy schemes have needlessly driven up energy costs, reduced electrical grid reliability and contributed to increased winter mortality, which especially targets the elderly and the poor.
10. Cheap, abundant, reliable energy is the lifeblood of modern society. When politicians fool with energy systems, real people suffer and die. That is the tragic legacy of false global warming alarmism.
Allan MacRae, Calgary, June 12, 2015
Very well said. Goes some way towards restoring our faith in academics – especially the mention of getting students to follow the warmists arguments and place them in the waste paper bin of history!
“greenhouse gasses will continue to cause some warming, though less than alarmists claim”
Given your fields of expertise Caleb what are the odds it isn’t less? 5%, 10%?
Tony, let’s hear your % first, thanks!
I don’t know, I hope he is right. But we may have ‘baked in’ a bit more than many would think.
I’m flattered CO that your more interested in my guess than that of a professor of math and statistics.
Reading comprehension, it’s what separates the trolls from honest posters.
Try it some time.
Almost certainly LESS, basically ZERO


Afterall, there is NO CO2 warming signal in the whole of the satellite temperature data.
The only way to look for a CO2 signal is to look outside the two major El Ninos
When you do that , you find that there is…..
No warming before the 1998 El Nino..
And No warming between the end of 1998 El Nino step in 2001 and the beginning of the 2015 El Nino
There is NO WARMING in either RSS or UAH apart for that 1998 El Nino step.
That means that there is NO CO2 WARMING SIGNAL
And so too if you look at the land based thermometer record for the Northern Hemisphere before it was so badly b@stardised over the course of the last 25 years.
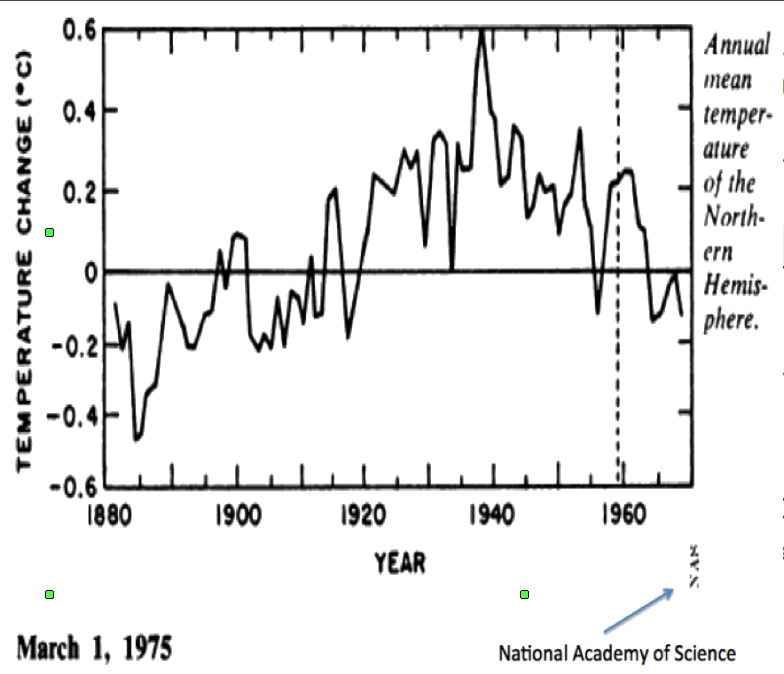
We have no reliable data on the Southern Hemisphere, it being so sparsely sampled, but as regards the Northern Hemisphere, there are multiple lines of evidence that suggest that it is today no warmer than it was during the 1940s, notwithstanding that since the 1940s some 95% of all manmade CO2 emissions have taken place. This suggests that CO2 has little, if any, impact on temperatures.
See for example the generally accepted 1970s view of temperatures as produced by NAS.
and
I have a copy of Science in which that plot was published.
Hansen, in the famous Hansen et al paper of 1981 (published in Science issue 213 August 1981) in figure 3 sets out a plot for the Northern Hemisphere that shows the 1940s being about 0.6degC warmer than 1970. At that time, he was quite content to accept that temperature profile for the Northern Hemisphere showed the 1940s to be some 0.6degC warmer than the early 1970s..
As can be seen from those plots, the Northern Hemisphere temperatures fell by more than 0.6deg C since the 1940s. The temperatures have probably bounced back since the mid 1970s by the same amount such that we are today about the same temperature as was sen in the 1940s.
This is of course consistent with US temperature measurements and Greenland temperature measurements (which only show 2010 warmer than the 1940s – 2015 being cooling in Greenland than 2010).
C’mon Andy what sort of chickensh** guestimate is that. Go on go for LESS than Zero. I dare ya,
punk.
If you take that NCAR graph, which looks like about 3 year points, go up a very generous 0.2ºC at from 1970 to 1979 and put 3 year averaged RSS land on the end, you get this.
(Its 3 charts in one, so ignore the numbers, the scales are matched as well as I could both horizontally and vertically)
The red line is the VERY FAKE GISS which would end up somewhere near the top of the big chart.
“Go on go for LESS than Zero. I dare ya,”
You really do come across as a base-level brain-washed idiot, tony.
There is no reason or mechanism for CO2 to have ANY affect on atmospheric temperatures in a convectively controlled atmosphere.
NONE.
Further to my comment posted above, it is well worth having a quick look at Figure 3 on page 960 of issue 213. Unfortunately, I cannot paste the image, but Hansen et al, when introducing the data plot, comment:
And then the remarkable, but interesting comment (also on page 960)
(my emphasis)
What Hansen is saying is three things:
First, as at 1980, globally 1940 is a little warmer than late 1970s/1980.
Second, as at 1980, the late 1970s/1980 Northern Hemisphere temperature is quite a bit cooler than the Northern Hemisphere temperature of the 1940s.
Third, people are mis-presenting the position when claiming that globally the world is cooling when this claim is based upon Northern Hemisphere data. Northern Hemisphere data is not global data, and is limited to describing only the position in the Northern Hemisphere.
Incidentally, if one looks at rural (non coastal) data, and tree ring data (from rural non coastal sites), a similar observation is told, namely that temperatures today are about the same as those observed in the late 1930s/early 1940s.
“There is NO WARMING in either RSS or UAH apart for that 1998 El Nino step.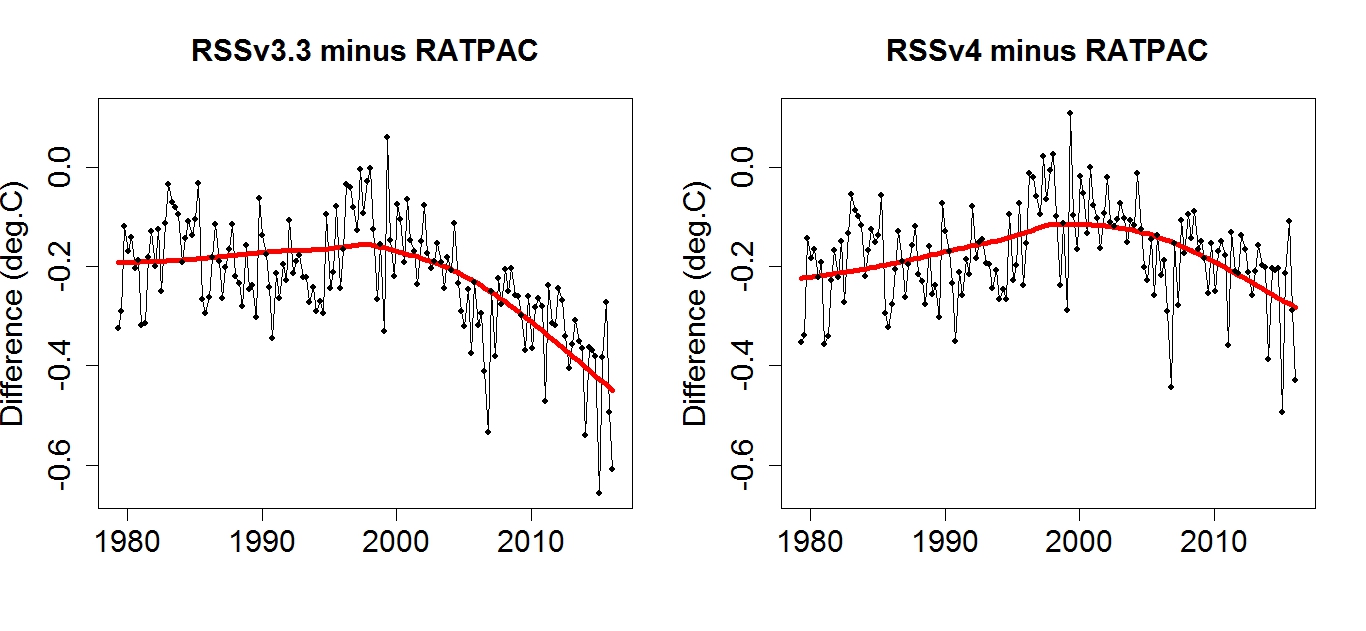
That means that there is NO CO2 WARMING SIGNAL”
Nice bit of obfuscation of the warming signal there AndyG55:
However if we plot both data series through the entire period (1980-2016).
We see that the trend before the 98 EN if extended to present would pass under the later trend and not cross until ~ 2020 in the case of UAH and sometime decades away in the case of RSS.
And the warming in both is ~ 0.4C.
http://www.woodfortrees.org/graph/rss/from:1980/to:1997/plot/rss/from:1997/to:2016/plot/rss/from:1980/to:1997/trend/plot/rss/from:1997/to:2016/trend
http://www.woodfortrees.org/graph/uah5/from:1980/to:1997/plot/uah6/from:1997/to:2016/plot/uah6/from:1980/to:1997/trend/plot/uah6/from:1997/to:2016/trend
Of course we know that both tropospheric satellite data series have a serious problem re the disconnect of the latest AMSU sensor aboard NOAA15 since ’98 when it changed from the MSU on NOAA14.
Shown here by their mismatch against RATPAC A sonde data……….
http://postmyimage.com/img2/792_UAHRatpacvalidation2.png
Additionally the RSS v3.3 TLT is now unsupported due drift issues and the relevant series is v4.0 TTT.
PS: I assume you used UAH v6(beta5) TLT and RSS v3.3 TLT?
tony, tony, tony.
What did I just finish telling you about reading comprehension.
“Almost certainly LESS, basically ZERO”
Is not the same as LESS than ZERO.
Sheesh, quit embarrassing yourself.
Toneb, I love how you assume that if there is warming it must be caused by CO2.
The warming prior from 1980 to around 1998 was most likely caused by the warm cycle of the PDO and AMO.
Not to mention the strong solar cycle during that period.
Now explain how temperatures could stay constant (possibly dropping by an statistically non-significant amount) for almost 20 years despite CO2 levels rising almost 30%.
“However if we plot both data series through the entire period (1980-2016).”
Doing that, PROVES that the ONLY way you can create a trend is by USING the 1998 El Nino step and the transient of the 2015/16 El Nino.
Since El Ninos are NOT driven by CO2, you have REINFORCED my point that apart from the El Ninos, there is NO WARMING IN THE SATELLITE DATA.
Thank you for concurring, 🙂
I love the way that toneb highlights his mathematical ineptitude. So Funny
First half of his trend graph is a classic error caused by using linear trend on cyclic data..
A very ROOKIE, junior high mistake.
(I’m way past trying to teach low IQ 15 year olds, so he will have to figure out his ignorance for himself)
Second half, he deliberately uses the start of the 2015 El Nino.
DUMB.. and not going to fool anyone.
RatPac A is a NOAA “product™” specifically adjusted for a purpose…
… to try to support the FARCE that is GISS fabrication..
Mark, Mark, Mark:
“tony, tony, tony.
What did I just finish telling you about reading comprehension.
“Almost certainly LESS, basically ZERO”
Is not the same as LESS than ZERO.
Sheesh, quit embarrassing yourself.”
I was replying to a post by AndyG55 my friend – and it has nothing to do with “reading comprehension”.
I was simply correcting a deceptive post by him that sought to hide a step up in warming after the ’98 EN in the plainly incorrect (reading too cold) Trop temp sat data series of UAH and RSS. One of which is not supported any more.
My WFT graphs show that, err, graphically.
I will always “embarrass myself” to denizens (well the vast majority).
As you do not realise it is you that are embarrassed.
It’s the nature of ideological belief systems you see.
If I did not then this would not be an echo-chamber of fan-boys cheering on the naysayers and fake “citizen scientists”.
Now would it?
Anyone (very few) on here calling out the dragon-slaying and fakery of data is obviously not to your liking.
Or is that just another obvious fact that escapes you?
AndyG55:
“I love the way that toneb highlights his mathematical ineptitude. So Funny”
Yes you are.
“First half of his trend graph is a classic error caused by using linear trend on cyclic data..”
It is not cyclic any more than Monckton’s “pause” is.
But then double standards are the norm here.
“A very ROOKIE, junior high mistake.
(I’m way past trying to teach low IQ 15 year olds, so he will have to figure out his ignorance for himself)”
Handwaving ad-hom is all you have when called out.
“Second half, he deliberately uses the start of the 2015 El Nino.”
Complete rubbish the second “half” is from ’97 to present, just what Monckton did with is “pause” running from 97 to present.
Kept insisting than that wasn’t cherry-picking
“DUMB.. and not going to fool anyone.””
Oh, it will show neutrals what is actually happening my friend,
And the dumb on here I do not seek to “fool”.
You’re long gone.
“RatPac A is a NOAA “product™” specifically adjusted for a purpose…
“… to try to support the FARCE that is GISS fabrication..”
So the hundreds of individual sondes from that record have been adjusted separately to make it look like ONE SENSOR is wrong.
Oh, do utilise some of the sense you were born with will you!
Ask Nick…. he’ll tell you that the GISS record makes bu****r all difference globally.
And if anything is “fake” it is UAH (V6 (beta5) … don’t you know.
Anyone promulgating conspiracy is beyond any rational approach.
And says more about that person than anything I can point out.
Aside from all that the trend has risen on both records by around +0.4C in 36 years.
Tata
Toneb, take a break, I’m getting tired of moderating these arguments of yours
tony mcleod != Toneb
Looks like tony isn’t the only troll with reading comprehension problems.
The period from 1980 to 1987 is indeed cyclic.


and if you just apply non-thinking linear calculators, because you are unaware opf what you are doing, you actually create a trend that isn’t there.
That is exactly what you have done on both your UAH and RSS WFTs graphs.
Let’s try to educate you, even though probably in vain….
Look at these three graphs, and tell me if the “linear trend” is +ve, -ve or zero in each case.
Other people can play if they want. 😉
“Complete rubbish the second “half” is from ’97 to present,”
ROFLMAO
You have just admitted you used the 2015 El Nino, thereby doing exactly what I said you had done.
Well done 🙂
NOAA, GISS, RATPAC…
Tom Karl, Gavin Schmidt, Tom Petersen….
nuff said. !!!
Anyone that says that is not cyclic… needs their eyes tested… or their brain.
“Ask Nick”
See, you have got a sense of humour.
Accidentally perhaps.
“Toneb, take a break, I’m getting tired of moderating these arguments of yours”
Anthony:
I appreciate that this is your Blog, and that people like me will call upon your vigilance re the replies to me.
If you see me as the problem fair enough. However I see the problem coming from the behaviour of certain denizens.
It would be nice if indeed certain denizens could limit themselves to the science presented in a straight-forward manner and not revert to personal attack and use of double standards.
That most would disagree with what I post I fully realise and expect, it does not, however, make it wrong.
If I put the cat among the pigeons to much on this occasion I will desist for a while.
Meanwhile – am I not correct in saying that Monckton characterised his “pause” by simple dint of going back from the present until ’97.
Thereby with constant refrain to the “pause lengthens to ….”.
Yes Toneb, it would be nice if you limited yourself to science, instead of propaganda pap and mis-information.
And please do try to be at least a bit less mathematically inept !
“it does not, however, make it wrong.”
No, but most of it is anyway.
I notice you are avoiding your “learning” task.
Note that I am reluctantly willing to TRY to help you learn…
IFF you want to learn.
The two sets of data before and after the 1998 El Nino look flat. An example of something similar is the ENSO region. It warms water instead of the atmosphere so much and the data is often flat until an El Nino occurs. Tisdale and Trenberth I think have both suggested something like this occurs with a warming. While this occurs in the ENSO region and the Pacific it doesn’t necessarily occur everywhere. And it’s not my point that it does, but it’s an example of the ability to resist change and then have change.
If we had more complete system data with the two flat before and after period it’s possible we’d see the warmth was going into the oceans enough to flatten the two sets of data.
One could argue the El Nino in the middle was noise. It is then Okay to disregard it. The removed section seems to be about 4 years centered on 1999 ½. The base of the El Nino spike seem to run from 1997 ½ to 2000. What happened to the 1 ½ years to 2001 ½?
http://woodfortrees.org/plot/rss
CO2 back-radiation (which is an erroneous assumption anyway) …cannot heat ocean water.
ENSO is a solar /wind warming, nothing to do with CO2
So any ocean build-up is irrelevant when looking for a CO2 signature, which is what we are doing here.
CO2 is meant to warm the atmosphere, but as PROVEN, the ONLY atmospheric warming is from NON-CO2 El Nino events.
I am fishing around with this:
http://www.woodfortrees.org/plot/uah6/trend/to:1985/plot/uah6/to:1987/trend/plot/uah6/to:1989/trend/plot/uah6/to:1991/trend/plot/uah6/to:1993/trend/plot/uah6/to:1995/trend/plot/uah6/to:1997/trend/plot/uah6/to:2000/trend/plot/uah6/to:2004/trend/plot/uah6/from:2006/trend/plot/uah6/from:2004/trend/plot/uah6/from:2008/trend/plot/uah6/from:2002/trend/plot/uah6/from:2001/trend/plot/uah6/from:2000/trend/plot/uah6/from:1999/trend/plot/uah6/trend/plot/uah6/from:1998/trend/plot/uah6/from:1997/trend
trying to get 2 flat before and after data sets. It’s not easy.
As I’m trying to explain to Toneb, you have to be extremely wary using linear trend calculators on cyclic data.
They are a tool than can easily be misused through not being aware of what they or the data is actually doing.
Try my little test with the simple sine curves, up above.
“CO2 is meant to warm the atmosphere, but as PROVEN, the ONLY atmospheric warming is from NON-CO2 El Nino events.”
El Ninos are not a cause by themselves. They are an important regional manifestation of a likely large area of the system with distant impacts usually over large areas. Other possible things with influences on El Ninos are ice sheet mass, sea ice area, the PETG, oceans temperatures at all depths, the GMST, sea levels, speed of the Antarctic circumpolar current and conditions in the North Pacific.
“The only way to look for a CO2 signal is to look outside the two major El Ninos…”
I guess you are looking for the signal by looking for rising trendlines which were not found by excluding data points. When the data is restored the trendlines for the most part rise from about 1980 using the RSS data.
We have two flat sets of data. Why can’t I draw a trendline through those?
http://www.woodfortrees.org/plot/rss/from:1980/to:1997/plot/rss/from:1997/to:2016/plot/rss/from:1980/to:1997/trend/plot/rss/from:1997/to:2016/trend/plot/rss/from:1980/to:2016/trend
“When the data is restored the trendlines for the most part rise from about 1980 using the RSS data.”
Sorry, but I feel like I’m talking to a brick wall, !!!
The FACT that you HAVE to include the El Ninos (which are nothing to do with CO2) to get a trend PROVES that CO2 has no part in the warming..
Do you comprehend… or not.
And what makes it compulsory to draw a LINEAR trend through anything to do with climate?

The 1998 El Nino makes it decided NOT linear, but a stepped trend
You can draw a stepped trend
The first part of the graph from 1980-1997.5 is probably better express with a non-linear trend.. if you must use anything rather than your basic eyes.
““steps” in data are subject to a wide variety of assumptions about the underlying data generating model. They are not in the data. they are consequences of making analytic assumptions about the data.”
Yeah I ran across something from Mosher hunting for something else. Steps arise from at least one assumption. It assumes the GMST steps up. That there are no steps but rather one long straight trendline is another. Arbitrary trend lengths involve an assumption.
Here’s what is looks like you’re doing. Explaining all of the GMST from the results from the ENSO region and perhaps nearby areas that can be seen over great distances. It transfers ocean warmth at times to the atmosphere. In theory all El Nino warming would be temporary as it seeks the TOA while La Nina usually follows cooling the GMST more than during an El Nino. I think consistent with Tisdale, it cycles. Warming ocean water than discharging that warmth to the atmosphere. You are removing two discharge cycles and arriving at two flat sets of data.
“Afterall, there is NO CO2 warming signal in the whole of the satellite temperature data.
The only way to look for a CO2 signal is to look outside the two major El Ninos…”
There are other temperature data sets. There are other ways to make assumptions about the satellite temperature data set. The system is not linear. I suppose your saying sensitivity is zero. I’ll say it’s variable. Here’s Ghil:
Look for the ‘Y’. As that goes to 90 degrees sensitivity approaches infinity, fails to do so and there’s your step. What’s probably going on is the massive oceans are burying the CO2 signal until they throw it at us during an El Nino.
“What’s probably going on is the massive oceans are burying the CO2 signal ”
ROFLMAO..
So predictable…. try anything to defend your unfounded beliefs.
There is NO MECHANISM for CO2 to warm the oceans without first warming the atmosphere.
even then, the atmosphere has very little if any warming effect on the oceans if any… thermodynamics.
Oceans are warmed mostly by the sun.
The atmosphere is NOT WARMING apart from El Nino events
There is NO CO2 warming signal in the satellite data set.
END OF STORY. !!!!!
“There are other temperature data sets”
None that aren’t totally mal-adjusted by the anti-CO2 agenda.
” I suppose your saying sensitivity is zero. I’ll say it’s variable.”
I’ve shown you that real data proves it is ZERO or very close to zero. Certainly doesn’t show up in the satellite data, nor in any sea level dat.. pretty much constant for over 100+ years
There is NO CO2 warming signal ANYWHERE. !!!
Show me anything that says its variable.
Its just an unproven belief.. probably not even to the status of a guess.
Show me a paper that shows that CO2 can cause any warming in a convective atmosphere.
So you reckon the CO2 warming is being sucked mysteriously into the ocean by some weird, unknown, mythical mechanism. (sorry, still trying to stop laughter at that piece of klimate kool-aide forced inanity)


So lets look at land data instead..
NO WARMING in UAH Land before the 1998 El Nino
And NO WARMING in UAH land between El Ninos.
RSS land actually has a COOLING trend between the end of the 1998 El Nino in 2001, and the start of the 2015 EL Nino
Seems like the oceans are sucking the CO2 warming out of that, as well, hey 😉
“What’s probably going on is the massive oceans are burying the CO2 signal ”
ps.. that one line shows that you BEYOND EDUCATING.
“As I’m trying to explain to Toneb, you have to be extremely wary using linear trend calculators on cyclic data.”
As Mother Nature almost without exception loves cycles and eschews straight lines, you have to be wary using linear trend calculators PERIOD.
That is a masterpiece and definitely a future Smoking Gun File. https://co2islife.wordpress.com/2017/01/17/climate-science-on-trial-the-smoking-gun-files/
Here’s what I am trying to say. You have found nearly horizontal trendlines. What could cause that? The biggest player, the oceans. They could always emit the same amount of warmth to the atmosphere. That would be linear. Then the GMST rise would be linear. Fortunately the oceans are not linear as shown by the ENSO region. Charge/discharge as Tisdale said.
Another way of saying what you’re saying is the oceans are the only cause of the warming. Giving credit to them for super monster giant El Ninos. We are at least half way down the CO2 can’t warm the oceans path. Maybe it can. And maybe they are just recovering from the LIA. And maybe it’s both.
If it can, that would lower the GMST rise and raise sea levels. All you need is two glasses of cool water. One with a lid on it and one without. The one without the lid will warm faster as the air above the water is warmer because it can circulate with room temperature air. CO2 or not, a temperature differential impacts the warming.
Can the atmosphere warm the oceans much? Tradewinds, upwelling, cool water that absorbs more SW than say 25.0 C water at the equator. It absorbs more as it’s cooler and evaporates less. This is seen in the GMST as La Nina predominant. The oceans hang onto more joules.
“Climate sensitivity is then defined mathematically as the derivative of an appropriate functional or other function of the system’s state with respect to the bifurcation parameter.”
https://www.google.com/url?sa=t&rct=j&q=&esrc=s&source=web&cd=3&ved=0ahUKEwink7Ccg83RAhUM7CYKHdYcD2kQFggoMAI&url=http%3A%2F%2Fresearch.atmos.ucla.edu%2Ftcd%2FPREPRINTS%2FGhil-A_Met_Soc_refs-rev%27d_vf-black_only.pdf&usg=AFQjCNH-WvU76GgUqmRL8flsoOm_p0cJjg&sig2=jlt4bAHUqsDXBEg33rEcjQ&bvm=bv.144224172,d.eWE&cad=rja
A Mathematical Theory of Climate Sensitivity or, How to Deal With Both Anthropogenic Forcing and Natural Variability?
Lacis et al. 1981
https://pubs.giss.nasa.gov/abs/la08000d.html
Suppose you got paid once a month and paid all your bills for the month on that same day. You’d have the same two trendlines as above if you excluded the days you got paid. Your net worth keeps increasing. Your working does nothing to increase your net worth because when you work, your net worth stays the same until you get paid, which I am going to remove from the records. Then I will conclude that your working has nothing to do with your increasing net worth and that it can’t. Now if we switched to accrual accounting, each day I’d show an increasing net worth as you are owed that day’s wages. Then when you got paid, I’d exclude that income as I counted it earlier, and recognize all your bills paid and deduct them from your net worth. Or I could have accrued them too. So If I spend 5 hours a day doing all this accounting we’d see a more or less steady rise in your net worth. So what we have with the oceans is them doing cash basis accounting. Storing up the joules earned for from 2-7 years, and then paying those to the atmosphere. We then conclude that since we need to exclude getting paid from the records, storing joules has nothing to do with the increasing net worth of joules in the atmosphere.
The GMST doesn’t include what it’s owed from the oceans. That is generally inferior to accrual accounting. But it’s what we have. However the Fortune 500 companies use accrual accounting. With the hype of the super monster El Ninos we just saw they were playing on this same thing. They thought the atmosphere was about to get paid and records would be set. It is quite likely we were going to get paid someday, but the GMST doesn’t count that.
It’s all guesses Tony, all of them. The truth is that we have a very poor understanding of the global energy flows in the atmosphere, let alone the oceans. Nobody knows what’s going to happen with the weather in the future, so the best we can do is continue to observe and adapt to whatever does happen. It is irrational to fear things you don’t understand and have little to no control over.
In my opinion (which is all it is) the warming from a doubling of CO2 concentration and any feedbacks will be less than 25% of the lowest IPCC claimed value. This means I hold the equilibrium sensitivity to be not more than 0.55 degrees per doubling. The concept of ‘baked in’ is valid, and the ‘baked in’ value so far is less than 0.2 degrees C. There is no way to sustain a valid claim for detecting a 0.2 degree change in global average temperature given the sparse data because the natural variability as shown by various proxy records for the past 10,000 years indicates global changes of 3 degrees C (at least). If we extend that to the past 15,000 years the number is far larger.
The idea that current CO2 emissions will drive temperatures up for decades or centuries years to come has no valid supporting evidence and a lot of counter arguments, primarily because the residence time is so short and the absence of the hotspot. The GHG theory, as espoused by the IPCC, is defective and deficient.
Other than its benefit as a universal fertilizer carbon dioxide is not an interesting gas. It is not dangerous and there isn’t much of it. Even at 3500 ppm the global heating effect is not very strong. That is only about three doublings from the current concentration. It would add about 1.65 degrees to the global temperature, assuming that a strong negative cloud feedback did not kick in with an additional potential 100 or 200 Watts/m2 of cooling as Willis has already demonstrated in his journal article.
There isn’t enough fossil fuel available to raise the concentration to 1000 let alone 3500 so the discussion is really over. The science is settled. There is no AG CO2 crisis and never was. Now let’s go back to solving real problems like ensuring constant and efficient delivery of energy to those living in energy poverty.
Hey Crispin, always enjoy reading your inputs to the WUWT posts. My sincerest compliments.
I had a brief discussion with a very intelligent individual in University (majoring in Math at Waterloo), and his response to higher CO2 concentrations was, “Well, we really don’t know how higher concentrations would impact our health.” Good question, so I did some digging ….
Apollo 13 did have to solve this problem, due to the Lunar Excursion Module (LEM) being the “home” for the three astronauts during the trip back to earth. The problem is that the LEM’s CO2 scrubbing system was designed based on two astronauts, however there were three of them on the way back and the scrubbing system was overwhelmed. And, of course, the command module scrubbing system and the LEM system parts were not interchangeable, so they had to do the “Red Green” approach to fixing it – which they did.
So, why did I dig into that historical reference, you ask? Well, NASA did the research and I found this in the attached link:
https://www.nap.edu/read/12529/chapter/10
“Carbon dioxide is the major expired by-product of human metabolism; if not effectively controlled, it can rapidly accumulate to dangerous concentrations in spacecraft atmospheres. On earth, the outdoor CO2 concentration is typically about 0.03% (DD update = 0.04%), and average indoor air contains CO2 in the range of 0.08% to 0.1% (IEQ 2006). In normal spacecraft operations, the CO2 concentration is typically about 0.5%, but the concentration approached 2% during the troubled Apollo 13 (Michel et al. 1975).”
So:
• 0.04% = 400 ppm (current atmospheric content)
• 0.08% – 0.1% = 800 – 1,000 ppm (range for the average house)
• 0.5% = 5,000 ppm (normal spacecraft operations)
• 2% = 20,000 ppm (NASA upper limit for Apollo missions)
NASA did the research and determined that 2% (20,000 ppm) is the upper limit that they would allow in space. The Apollo 13 astronauts did encounter this concentration for a period of time, but were not adversely affected by it. In the past 600 million years, the maximum CO2 concentration was 7,000 ppm (0.7%), or about 1/3 of what NASA would allow as an upper limit. And the period above 5,000 ppm was relatively brief, about 40 million years out of 600 million years (less than 7% of the total time frame).
Therefore although possible, it is highly unlikely that 7,000 ppm CO2 would adversely affect humans. Therefore even if the atmospheric concentration went to 700 ppm (0.07%), or even to 2,000 ppm (0.2%), as Dr. Patrick Moore (former President of Greenpeace, who left because “Greenpeace had lost their way”) recommends for maximum plant growth and minimum impact to the climate, I think that we would be okay with that level of CO2 in the atmosphere.
CO2 is plant food, yet the so-called “leaders” on this planet are doing everything that they can in an attempt to limit the atmospheric concentration of CO2. Okay, it is more of a redistribution of wealth, using “the sky is falling” paranoia to accomplish this task.
Hey Crispin, always enjoy reading your comments to the WUWT posts. My sincerest compliments!
I had a brief discussion with a very intelligent university student on the weekend (majoring in Math at Waterloo), and his response to higher CO2 concentrations was, “Well, we really don’t know how this would impact our health.”
Decided to do some digging ……
Apollo 13 did have to solve this problem, due to the LEM (Lunar Excursion Module) being the “home” for the three astronauts during the trip back to earth. The problem is that the LEM’s CO2 scrubbing system was designed based on two astronauts, however there were three of them on the way back and the scrubbing system was overwhelmed. And, of course, the command module scrubbing system and the LEM system parts were not interchangeable, so they had to do the “Red Green” approach to fixing it – which they did.
So, why did I dig into that historical reference, you ask? Well, NASA did the research and I found this in the attached link:
https://www.nap.edu/read/12529/chapter/10
“Carbon dioxide is the major expired by-product of human metabolism; if not effectively controlled, it can rapidly accumulate to dangerous concentrations in spacecraft atmospheres. On earth, the outdoor CO2 concentration is typically about 0.03% (DD update = 0.04%), and average indoor air contains CO2 in the range of 0.08% to 0.1% (IEQ 2006). In normal spacecraft operations, the CO2 concentration is typically about 0.5%, but the concentration approached 2% during the troubled Apollo 13 (Michel et al. 1975).”
So:
• 0.04% = 400 ppm (current atmospheric content)
• 0.08% – 0.1% = 800 – 1,000 ppm (range for the average house)
• 0.5% = 5,000 ppm (normal spacecraft operations)
• 2% = 20,000 ppm (NASA upper limit for Apollo missions)
NASA did the research and determined that 2% (20,000 ppm) is the upper limit that they would allow in space. The Apollo 13 astronauts did encounter this concentration for a period of time, but were not adversely affected by it. In the past 600 million years, the maximum CO2 concentration was 7,000 ppm (0.7%), or about 1/3 of what NASA would allow as an upper limit. And the period above 5,000 ppm was relatively brief, about 40 million years out of 600 million years (less than 7% of the total time frame).
Therefore although possible, it is highly unlikely that 7,000 ppm CO2 would adversely affect humans. Therefore even if the atmospheric concentration went to 700 ppm (0.07%), or even to 2,000 ppm (0.2%), as Dr. Patrick Moore (former President of Greenpeace, who left because “Greenpeace had lost their way”) recommends for maximum plant growth and minimum impact to the climate, I think that we would be okay with that level of CO2 in the atmosphere.
CO2 is plant fuel, plain and simple. And even NASA are advertising the “greening” of the earth due to higher CO2 concentrations. Furthermore the only places on the planet that CO2 absorbs energy in a relatively efficient manner is at the poles, and based on the historical temperature information for both, there is zero temperature increase due to increasing CO2 concentrations. The supposed “leaders” of this planet have got it all wrong therefore aside from the transfer of wealth that continues due to the alarmists winning the battle (so far), the restrictions that are being imposed on jurisdictions all over the planet will, by default, do nothing to change the direction that our climate will, via naturally occurring forces, migrate towards.
People working in coal mines face occupational exposures to CO2 up to a percent regularly.
That’s up to 10,000 PPM. Occupational exposure. No harm. Day in, day out.
Thank you very much for that information, AP, most appreciated. This is the type of information that we need to get out to the general public – about 9 months ago I sent a very critical email to NASA due to finding one of their sites where EVERY research scientist was supposedly convinced that humans are 100% responsible for the rising atmospheric temperature (cannot be driven by whom approves their budget – do ya think?!?), and a response that I got from them was very similar to the university student; “Historical CO2 concentrations have been higher but we do not know if we could survive in that environment.”
This is the nonsense that we are facing! Bloody amazing.
Crispin said:
“In my opinion (which is all it is) the warming from a doubling of CO2 concentration and any feedbacks will be less than 25% of the lowest IPCC claimed value. This means I hold the equilibrium sensitivity to be not more than 0.55 degrees per doubling.”
I agree Crispin – IF Earth’s climate equilibrium sensitivity to increasing atmospheric CO2 (ECS) actually exists as a significant parameter, then it is less than 0.55C/(2xCO2) – and possibly much less.
But does ECS actually exist in reality, and if so, how can we estimate it? The problem (as I see it) is that precedence analyses prove that CO2 LAGS temperature at all measured time scales*. Therefore, the impact of CO2 change on Earth temperature (ECS) is LESS THAN the impact of temperature change on CO2 (ECO2S).
What we see in the satellite record is the Net Effect = (ECO2S minus ECS). I suspect that we have enough information to make a rational estimate to bound these numbers, and ECS will be very low. My guess is that ECS is so small as to be insignificant.
Conclusion:
The alleged global warming crisis is a false alarm – there is no evidence that it exists and ample evidence that it does not.
Regards, Allan
*References:
1, MacRae, 2008
http://icecap.us/images/uploads/CO2vsTMacRae.pdf
Fig. 1
https://www.facebook.com/photo.php?fbid=1200189820058578&set=a.1012901982120697.1073741826.100002027142240&type=3&theater
Fig. 3
https://www.facebook.com/photo.php?fbid=1200190153391878&set=a.1012901982120697.1073741826.100002027142240&type=3&theater
Summary at https://wattsupwiththat.com/2017/01/11/the-recursive-cost-of-carbon/comment-page-1/#comment-2396279
2. http://www.woodfortrees.org/plot/esrl-co2/from:1979/mean:12/derivative/plot/uah5/from:1979/scale:0.22/offset:0.14
3. Humlum et al, January 2013
http://www.sciencedirect.com/science/article/pii/S0921818112001658
“Greenhouse gases” are more accurately called “radiative gases.” And, the idea that IR radiation from radiative gases in the upper tropical troposphere (UUT) can warm Earth’s surface—the keystone of global warming by greenhouse gases—flies in the face of thermodynamics.
The UTT is at -17 deg C and Earth’s surface at 15 deg C (always warmer than the UUT). Colder matter cannot warm hotter matter. IT radiation from -17 deg C air will be reflected not absorbed by Earth’s warmer surface as the energy levels equivalent to -17 deg C are already full in the surface. All of this IR radiation will eventually be lost to space.
Now, computer global climate models do not do night-time, just daylight 24/7, during which radiative gases, which cannot absorb large swaths of the IR spectrum, by the way, are effectively saturated and emit as much IR as the absorb, thus not heating the air. In any case, any possible warming would be undetectable.
It is during the real-world’s night-time that these radiative gases actively convert heat energy in the air to IR radiation which is then last to space. This is why the air cools so rapidly after sunset and little breezes kick up so quickly near the shadows of clouds on a sunny day with scudding clouds. This is a rapid process and completely missing from the computer models and completely ignored by all warmists.
“Greenhouse gasses” by definition cause warming.
It is 100% certain that it is less than the alarmists claim, otherwise other geological epochs with thousands of PPM concentrations couldn’t have supported flourishing life, then descend into ice ages for no apparent reason (since there was plenty of CO2). Or the more recent ice ages where the data shows CO2 lagging temperature.
I’ve always had trouble with spelling “gases” for some reason!
Caleb,
I like your essay and admire your efforts with your student, which I suspect could have resulted in you losing your position.
However I would like to draw your attention to another arm of the UN which is more insidious.
UN Agenda 21 and now UN Agenda 2030 are another arm of the “Save the Planet”efforts of the UN. Actually that is not the aim at all but I would like to draw your attention to the “sustainability”doctrine which finds its way through local governments and cells in society. One vehicle for this is ICLEI http://www.iclei.org and others are through UNESCO and other branches of the United Nations.
Another one is “UNITED NATIONS CONFERENCE ON HUMAN SETTLEMENTS” of which a key document is linked below. Like every carefully scripted UN report, it looks reasonable and supportable until :- take a look at page 8. The highlighting is mine.
https://thedemiseofchristchurch.files.wordpress.com/2015/09/unitednations-conference-on-human-settlements_habitat1.pdf
This is a huge influence developed through the United Nations and I and many others are learning that the UN is an organization with its own agenda with unfriendly tenticles invading every part of society.
Please check my blog.
All the best
Roger
http://www.thedemiseofchristchurch.com
Did the UN cut and paste that text from an essay by Marx?
Wow.
I helped a graduate student prepare a model of the biofuel industry in a third world country, and the model seemed to show biofuels helped reduce rural poverty and slowed down migration from the country side to urban slums. This in turn reduced crime. It is true food prices increased, but this encouraged more farming.
There were additional benefits, for example the import bill for oil and refined products dropped, and this helped the balance of trade.
I want to remind you that I worked in the oil industry for four decades, I don’t have an axe to grind. My involvement in this project came about because I had supervised an integrated team which used integrated assessment models, and I was mentoring students as a community service and to have good relations with university staffs (this helped us recruit their best graduates).
I think the USA ethanol industry is not economically viable unless oil prices climb above $100 per barrel, therefore it doesn’t merit much support, but that’s not the case in tropical nations with plenty of land they can convert to sugar cane and other biofuel crops.
Your past professional activity in the oil drilling industry in all honors, but technical progress has not stopped even before the oil drilling industry. Shale gas and oil are nowadays, if necessary, far more environmentally friendly and cheaper to promote. In the United States, some obsolete methods are still being used in this promotion. But, as I said, with a little support from the state in the form of tax relief, this industry would be able to modernize its machinery, introduce more modern exploration methods, and promote the existing energy sources more cheaply and efficiently. The technical developments are there, they just have to be used. However, I do not know if the US would be well advised in the present to exploit its own treasure of fossil energy too much. This is also a pound for the future. Perhaps one should abolish the sanctions against Russia, work with them and open up the Siberian gas and oil reserves. Then the US. This would justify the energy independence of the US on two occasions: First, Russia could not threaten the US with an embargo, the US itself is on oil and gas. And secondly, this would create a great energy self-sufficiency of the US in the future, if oil and gas are already exploited elsewhere.
The US has to exploit its resources ASAP. In the meantime it should resume development of generation IV nuclear reactors, especially molten salt reactors after a five decade long gap, the original project having been killed by president Nixon, who preferred Cold War Plutonium factories to actual power plants.
MSRs provide passive safety, a hundred times less waste with no long half life radioactive isotopes in it, and they are resistant to nuclear weapons proliferation, although it is not an issue for the US of A, being the larges nuclear power itself. Most importantly, fissionable fuel has a million times higher energy density than chemical fuels. Even a ton of ordinary granite, the default stuff continents are made of, contains as much recoverable energy as fifty tons of coal, but we have much better ores than that for a long time.
Molten fluoride salts are attractive, because they are inert chemically (they can’t catch fire) and have a very high boiling point, so the reactor core can operate under standard atmospheric pressure (it can’t possibly explode).
Other coolants, like gases (eg. Helium) should be under pressure, so they can escape in an accident, distributing nasty stuff widely. Molten sodium (or lead) is even worse, it can burn like hell. But the worst of all is hot water (steam) under high pressure, it can do unimaginable damage in an accident. This is why we have pressurized water reactors in service, I guess.
There’s nothing special about “shales” to change the medium term trend (never mind long term). There’s no “special technology”, there’s nothing to change recovery factor or the basic economics of shale plays being developed for oil. The only oil prone quality basin is the Permian in Texas, the Bakken sweet spots are mostly drilled, the Three Forks is uneven, the Eagle Ford isn’t that good at today’s prices, and the low costs we see are mostly caused by sharp cut backs which left us with gobs of equipment to cannibalize for spare parts, and a pool of people willing to get paid less until prices bounce or enough of them move over to something else.
There’s a significant difference between the prospects for oil and gas. Gas is in better shape, and this confuses people who don’t do the fine print. But biofuels compete with gasoline/diesel. And their prices are bound to go up over time because we just can’t find places to produce at low costs, and costs are increasing as we have to tap junkier reservoirs. It’s unstoppable.
Anyhow, I was discussing biofuels outside the USA. And that means sugar cane, soy, palm, etc. Other nations don’t have the USA rocks, they don’t have the light oil, and they don’t have the low cost environment. And those nations are the ones which do benefit from biofuels.
You make a good point about the import bill for oil and refined products…
for developing countries without oil/gas/coal reserves -in particular islands, where you have to ship that stuff in – renewable energy from e.g. solar, especially the low tech CSP model as used in Morocco, makes absolute sense, because you aren’t shelling out to import oil/gas/coal.
where currently there are a lot of diesel generators, by replacing diesel use in the day at least and with some battery storage, you massively reduce your fuel oil bill.
If you can get the islanders to maintain their batteries and dc/ac alternator equipment. We’re not talking dung fires here.
I has the personal experience while visiting a small Caribbean island of watching the water barge dock right next to the broken-down reverse osmosis water purification unit.
Many islands could be exporting gas. “Renewables” only make sense when the alternatives are extremely expensive. No such island economy could ever make PV panels and batteries using energy generated by renewable energy systems. Too expensive. Islands make there money from fishing, retirement and tourism. Always will. They can import what they want. There is need for islands or anyone else to generate all their own power regardless of cost. Islands are ideal places for placing small nuclear generators.
Pochas – I was thinking large caribean islands here… not atolls of fishermen in the deep pacific, but island nations.
Even King Island uses it diesel generators around 70% of the time.
You are having yet another hallucinogenic dream, Griff.
Too late to stop though, your mind is already destroyed.
Only in Griff’s world can you replace cheap reliable power with expensive unreliable power, and come out ahead.
Even for island nations.
Crispin, most islands lack gas resources they can produce for their own needs. An exception would be large islands which are part of a continental shelf, such as Trinidad (which is running down its reserves and faces a forthcoming energy shortage in a few decades).
Islands are a difficult nut to crack because solar and wind are intermittent and they lack hydro capacity to back up those two. They are expensive to interconnect to other grids, and they can’t afford the land space for large solar arrays anyway. If they try it they kill tourism. I wouldn’t gamble on helping them finance a small nuclear reactor. And as oil prices rise they’ll get in trouble. The only thing I think they’ll afford is medium sized coal plants equipped with scrubbers, and a few sugar cane and oil palm plantations.
Wouldn’t they almost always be better off farming to produce high value food for export, rather than low-value ethanol crops?
Solar panels and windmills are also imported by island nations.
Diesel might cost $10 gallon in remote Alaskan villages.
What would be the net cost & benefit to the west of a stringent CO2 emissions program?
First, in terms of the cost of economic retrenchment, the net cost would fall almost exclusively on the US and western countries, as China and the third world will not play the game. Energy underlies virtually *all* economic activity, so targeting energy is the quickest way to engender economic retraction:
De-industrialization will not solve the problem of “climate change.” Instead it solves the “problem” of industrialization (but only in the west!). The net economic costs to dramatically downsizing an economy of course are staggering. Now worldwide climate change spending is close to $1 trillion dollars annually on economically nonviable renewables and on research and institutional funding. We could do the same for 100 years, and that cost would be $100 trillion (without interest) at that rate, but in truth if the radical economic decapitation desired by the leftists was implemented the costs over a century could be like 10 times more, as $1000 trillion dollars (a quadrillion)!
The benefits? Minimal. Even if there’s some warming from CO2 .. on balance this warming may not even be a ‘cost.’ Minor issues from warming could be adapted to for just millions or at most billions of dollars. Were talking costs being thousands of times greater than benefits!
What’s more .. is the massive benefit from higher CO2, like sharply increased agricultural production and the greening of the planet (as de-desertification which adds new productive land). This could amount to scores of trillions of additional benefits! See the graph on agricultural production at this tweet for a sense of this. The costs to the west of the leftist program are unfathomably high; the benefits .. nearly nil, while our potential foe (ie China) would be free to build its economy and military (while *stealing* our lost industrial production [with net world emissions therefore being essentially zero from our twisted self-immolating effort]). Stop the insanity. Stop the leftists’ insane plan to knock the west out of commission!
“…the costs over a century could be like 10 times more, as $1000 trillion dollars”
“Minor issues from warming could be adapted to for just millions or at most billions of dollars.”
Links or evidence to support these claims?
Google “Bjorn Lomborg”. He has done very good work on exactly that.
His figures are nothing like a 1000 T dollars
RE: The 2015 Paris Climate Agreement. He writes, “The technical withdrawal will take a few years because of the terms of those accords . . .”. I’m not American but doesn’t a treaty need to be ratified by the U.S. Senate to become valid? Can’t Trump undo this “treaty” in about the same amount of time it took for Obama to sign it?
Who knows. Different analysts have said different things about that. My greater concern is that a little over a month ago Trump himself seems to have gone wishy-washy on the Paris Accord (despite a year of campaigning on summarily getting us out of the Paris lunacy). What’s more, a few days after Trump went ambivalent on the accord he nominated the Paris Accord pushing warmist Rex Tillerson for Sec of State, a position which arguably would have direct responsibility for international climate change policy.
This is too pessimistic. If one believes in the global warming of fossil fuels at least in parts, this does not mean that the international cartel of renewable energies has to be joined. Rex Tillerson as a former oil industry representative, even as one of their CEOs will not. In addition, he did not say at all to a hearing committee that global warming was catastrophic and not that he thought the modeled global warming is possible. I just think Tillerson is the most diplomatic representative among Trumps men and women and you have to read more between the lines. Tillerson is also bound by instructions. He acts exactly as Kerry does. This has been sent off only by order of Obama and did not act independently, as the Israel resolution clearly showed.
Hans-Georg .. Tillerson spoke of “the serious risks” of climate change. So nothing could be more clear. James Delingpole seems VERY critical of Tillerson, saying: “It was a huge oil company with masses of money to squander on environmental pay outs; and, under its CEO Rex Tillerson, it had a track record of corporate cowardice (withdrawing funding from right-wing think tanks; failing to speak up for fossil fuels; kow-towing to greens)…”
Also Tillerson supported the total amnesty sh|ll & warmist Jeb Bush for president. That gives me a picture of Tillerson as a corporate softie & Chamber of Commerce type.
Just because he’s an oilman doesn’t make him a saint. Supposedly it was Tillerson that dragged Exxon left on climate change. Tillerson will be, as you say, bound by instruction, but Tillerson said he will try to influence Trump on climate change. See: ExxonMobil’s Tillerson could moderate Trump on climate change: http://thehill.com/blogs/pundits-blog/the-administration/313678-exxonmobils-tillerson-could-moderate-trump-on-climate
Eric: I guess if reading left wing publications is to be believed, then skeptics have something to worry about.
The Left is still absolutely sure and positive and counting on someone “moderating” Trump. There is no evidence that this will happen, yet they cling. Trump is not an idiot (in spite of Michael Moore and other’s claims). He doesn’t nominate people he doesn’t trust. Tillerson will have to save the planet by sound economic principles or he’s out. Results are what Trump looks at. If electricity costs rise to $2.00 KW and businesses go bankrupt (actually long before that) and poor countries are relegated to eternal poverty due to politics, Tillerson will be replaced. The hopes and dreams of the Left are totally irrelevant in this picture.
Sheri
Breitbart and The HIll are not “left wing publications.”
And basically they just report Tillermen’s own words, as:
Rex Tillerson, Oct 2016: “At ExxonMobil, we share the view that the risks of climate change are serious… [and favor] the Paris agreeement.”
I think that there is a law in the USA, which puts so-called night and fog actions of presidents under suspension of revocation at the end of their term of office. I am not an expert on US law, but the Paris Treaty was signed by Obama at the beginning of September, the election was on November 8th and the new president’s presidency is on January 20th. Therefore, this signature of Obama could still fall under it. Furthermore, to the best of my knowledge, a convention binding on the US under international law is to be signed by the Congress. This was also the case in the case of the Versailles Treaty after the First World War, when the President signed, but Congress refused to approve. So he had not entered into force for the US. And such a contract may only be binding if it has entered into force. A big point for the contract is also that he, if not complied, is not prosecuted. What prevented the US from doing so, but not keeping it. UN troops will therefore not occupy the Capitol. And the international impact on the Mafia cartel of renewable energies would be the same. Without the US, nothing will happen, and certainly not against it.
éééé
eh?
It’s how the French say eeee!
ah!
An excellent piece which calmly expresses the really important issues and makes me feel that the personal rage I sometimes succumb to thinking about all the misspent money and lost progress is not irrational but justifiable.
“. . . the personal rage I sometimes succumb to thinking about all the misspent money and lost progress . . .”
To sooth yourself, consider this cockle-warming thought: Offsetting that waste will be an enormous and long-lasting loss of credibility by alarmist political and environmental and social factions in the wake of a resumption of the Pause, etc. The presumptive prestige of academia, environmental groups, bigshot scientific organizations, the UN, and Western governments, especially left-of-center ones, will be turned, in the eyes of most of the public, into scorn and presumptive distrust. The right will have an eternal and powerful talking-point against whatever emanates in the future from those know-it-all factions. Hubris will meet its well-deserved comeuppance
One of the major benefits of cheap, abundant energy not mentioned in the article is the effect it has on population growth. In Europe and North America, our population growth is below the replacement level. This means less stress on the environment. In energy poor countries, it’s just the opposite.
I’m gonna be the Devil’s Own Worst Avocado here – OK?
We’re told, above, that ‘net harm’ has been done to former colonies.
Yes it was, when they were colonised. Just like missionaries gong to ‘give religion’ and ‘civilisation’ to little lost and isolated tribes in jungles and places.
And what’s religion if not relentless guilt for its recipients and thereby control.
And we even see mention of Good Intentions. Lord help us, we all here know where those end up.
All throughout, we’re told the that the Western Way is The Way to go. Western civilisation is just so great, so lovely, everyone must have it. We are all so clever, so educated etc etc.
Oh yeah?
OK, give these poor people all the energy they want.
Ever hear of Jevon’s Paradox.
It is a real thing and an inbuilt characteristic of human nature, especially Western human nature. It will lead to where good intentions lead…
What else did the colonies, lost tribes and ‘poor people’ get?
If not syphilis, alcohol, guns, selfishness, greed, obesity, diabetes & heart disease, cancer and a diet so tasteless, devoid of nutrition and loaded with allergens, irritants and barely disguised toxins its barely believable. And when folks get any one of 192 autoimmune disorders, they’re told by ‘clever pople’ with computers that its their genes (buck passing) that are at fault and the cure is to eat ever more irritants and allergens.
What is *so* great about that little lot?
Then what, like the UK where something like 70% of your total gross salary is taken off you in tax and other mandatory takes. And a tiny fraction of that 70% goes to making us *so* intelligent we even stop making babies. RU crazy?
Is the 70% not maintain legions of parasites, who spend their time contriving ever more traps to fall into and hence an even bigger take of your ‘labour’ and then throw that money around signalling their own (not yours) virtue.
In no special order, its all about control, control & control.
And what sort of folks need control?
What about people who cannot cope with ‘the unexpected’, or deal with rapidly moving/developing situations? people who cannot abide the fact that ‘someone somewhere’ is or may be doing something they don’t know about.
Or people who have to take the day off work when a new leader is elected? Or folks who are endlessly catastrophist and rely on a superior being (supercomputer) to back up their catastrophic thinking & assertions. Or folks who are so well educated they really think cold objects can heat warm ones while hopelessly confusing cause & effect.
Don’t take it personally, if you do you are what I’m on about – classically, clinically & chronically depressed.
Is that really so great.
Yes, its a real pig of a problem and if you eat any amount of sugar/glucose/carbs/alcohol/dope its insurmountable. You don’t wanna think about it, you can’t be bothered, it’ll be better tomorrow etc etc.
So, guess what,you pass the buck.
In all probability to someone similarly affected because basically, we now have no choice but to eat carbs.
I would like to expand on your mention of “Good Intentions” in the OP.
It was never good intentions, Obama stated publicly that he wanted Energy Prices to Sky Rocket.
That has no good intention, that harms everybody, even the rich if only very slightly, but especially the poor and Industry.
Great statement.
“Troughfeeding parasites” …….. or …… “economyfeeding termites”, ….. makes no difference whatcha call them.
My fave is ‘EconomyLeeches’.
I’m not losing anything like 70% of my gross salary in the UK.
and from my taxes I get free guaranteed health care…
No one in the UK who can’t pay for medical treatment or who goes bankrupt paying for treatment.
If you are a higher rate tax payer, you pay tax at 40 to 45%, and National Insurance at about 10% so that is 50%. Then you pay VAT at 20% on everything you buy ) apart from food and children’s clothes, and a few other exceptions). If you buy petrol or alcohol or cigarettes then there is additional tax paid.
So for many in the UK, they are paying about 70% in tax on a large percentage of the money that they earn.
“and from my taxes I get free guaranteed health care”
You only get free health care, in a loose twisted concept of “free”; given that al of the “free” comes from the taxpayers, get sucked into a bureaucracy that allocates health care.
Guaranteed, only in the sense that if you wait long enough and are willing to allow under paid over worked medical professionals using old equipment.
Check into how many of England’s elites fly elsewhere for many procedures. Anyone who has the chance to get a procedure accomplished elsewhere, takes those options.
How do I know? Friends visiting from England who use our place to make appointments with doctors for their services.
Eye exams, eyeglasses, tonsils, x-rays, cat scans, blood work, dental work, etc.
Keep your government impeded second guessed health care. We’ll find a method that helps take care of the uninsured without funding a bloated bureaucracy.
One method keep heath care modern. The other socialistic method cements existing health care and methods into place.
“If you are a higher rate tax payer, you pay tax at 40 to 45%, and National Insurance at about 10% so that is 50%. Then you pay VAT at 20% on everything you buy ) apart from food and children’s clothes, and a few other exceptions). If you buy petrol or alcohol or cigarettes then there is additional tax paid.
So for many in the UK, they are paying about 70% in tax on a large percentage of the money that they earn.”
Richard:
Those on the higher tax rate only pay that rate on the income ABOVE the personal tax allowance, which is currently…..
2016 to 2017 2017 to 2018
Personal allowance 11,000 11,500
Basic Rate Limit 32,000 33,500
Higher Rate Threshold 43,000 45,000
Band Taxable income Tax rate
Personal Allowance Up to £11,000 0%
Basic rate £11,001 to £43,000 20%
Higher rate £43,001 to £150,000 40%
Additional rate over £150,000 45%
Also only 1% of UK citizens pay at 50%
15% pay at 40%
82% pay at 20%
https://www.theguardian.com/news/datablog/2014/jan/27/how-many-pay-top-rate-of-income-tax-uk
Nope – a long way below 70%.
W O W 82% of Britons earn less than £42,000 annually? (Currently $52,055 USD) That is barely enough to afford a house payment or rent and 2 cars. On top of that to have to pay SOOOO Much in taxes, it is a good thing your health care is provided or you would have zero take home
good point tone, I didn’t factor VAT – but I guess I don’t see it as from gross income??
(and US etc have sales tax, don’t they?)
“What else did the colonies, lost tribes and ‘poor people’ get?
If not syphilis, alcohol, guns, selfishness, greed, obesity, diabetes & heart disease, cancer and a diet so tasteless, devoid of nutrition and loaded with allergens, irritants and barely disguised toxins its barely believable.”
Good question. Let’s look at energy.
Colonies got:
mouldboard plough-based agriculture
high energy fertilisers
crop breeding programs to localise benefits
universities
highs schools
primary schools
dry cell batteries
radios
generators
bicycles
trains
clean water
sewers
paved roads
canals
hydro-electric (renewable) power
modern mining
boreholes
wind pumps (renewable energy)
the printed word
a civil service
codified laws
elections
telephones and telegrams
medicines, many of which saves lives in the millions
cataract surgery
inoculations against dread diseases
access to overseas universities
a vote at the UN
a right to visit and work for a time in the colonial power country (2 years in the case of the UK)
a chance to join the rest of the world, to understand their fellow men and to participate in global affairs with perspicacity and understanding.
Some colonies already had a few of these things but generally the spread of materialistic advancements was from the colonial powers to the colonies. It would behoove the former powers to learn something about social and spiritual advancements achieved in the colonies before the West collapses inward. You cannot live by ‘bread’ alone.
Of course we have a choice Peta. Eat greens & the carbs will take care of themselves.
https://en.wikipedia.org/wiki/Make_Room!_Make_Room!
The fact of the matter is, even before the renewable electricity programmes, nobody has been funding and building conventional power stations and grids in the developing world.
Now at last solar power and renewable technology is delivering to people previously without electricity… take Kenya, where renewables are a large part of the current programme which will supply electricity to every Kenyan.
and the biggest contributor to fighting fuel poverty in the world? The solar LED light programme.
This is replacing the kerosene lamp: kerosene is the only lighting source for many millions and kerosene takes a lot of their disposable income. Selling LEDs boosts the local economy and puts money in the pockets of the poorest, while giving them proper lighting to live and study by.
Sometimes I wonder if some commentators are from an irony program. The sale and trading of LEDs is therefore intended to strengthen the economy and prosperity in hardly developed countries. This is as ironic as the plot of the movie “the gods must be crazy” when a Bushman boy found a cola bottle in the middle of the savannah, which a bushpilot had previously thrown out of his chest. With such an intelligent world view, nothing is left to you. Make Intelligence great again amerika. Some native people need it.
I’m not seeing your point here…
More information here:
https://solar-aid.org/
and here:
http://www.philips.com/a-w/about/news/archive/standard/news/press/2015/20150319-Solar-powered-LED-luminaires-from-Philips-can-brighten-the-homes-of-millions.html
This ends fuel poverty and because the lights are sold, not given away, allows local traders to make a living.
For every stupid social trend, there’s always someone like Grift who tries to exploit it and cash in.
At least the pet rock wasn’t a government mandate.
Poor griff.. seems to think lighting is a major part of energy costs… DOH !!!
eight planks thick !!
Andy, if all you have is a kerosene lamp, it is.
Griff – January 18, 2017 at 1:28 am
Griff, up above you stated this, to wit:
“Selling LEDs boosts the local economy and puts money in the pockets of the poorest, while giving them proper lighting to live and study by.”
Griff, explain what you mean by “work and study” if all they have in their hut is a sleeping mat, a fire pit and an LED light.
China has recently announced their intention to accelerate their programs that help 3rd world countries build coal based power plants.
As always, Griff just makes it up as he goes.
Where there is no national or local grid, solar and/or wind may make sense if the benefit of their meager output is greater than the cost. However, you can’t run aluminum smelters or steel mills on wind and solar. To step up into the First World, Third Worlders need reliable base load power plants. For now that means coal, oil, hydro or nuclear.
In order to save solar for when it’s needed, ie lights at night, you also need to invest in batteries.
At least doubling the cost and the maintenance overhead.
Mark, there are probably already diesel generators which burn imported costly oil… you are saving that cost during the day… there are more daylight hours needing power and daytime is when industry mostly works
Griff, only you would use electric lights during the day.
Sheesh, are you actually as stupid as your posts make you seem?
Griff,
You write: ” … the biggest contributor to fighting fuel poverty in the world? The solar LED light programme.”
I understand the great advantage of solar LEDs — I even have some.
However, I do not use them for fuel. I use 24/7 grid (via hydro) electricity for heating, cooling, refrigeration, freezers, and so on. If the power line goes down (max. length of time in 25 years has been 4 hours) I can heat with a catalytic-assisted wood stove (USA-EPA certified). I use the wood stove, also, when outside air is very cold, because the air-sourced heat-pump will not work well then and the unit switches to electrical resistance heating.
“Fuel poverty” can be thought of, as …
1. the fuel-bill or cost is very high, or
2. the available fuel (energy) isn’t available at any cost.
Neither 1 or 2 fits in our case but I do feel sorry for anyone that experiences either or both.
One thing I don’t need down here at the moment is heating !!!!
Typical pre-southern buster……hot dry westerly wind.. ycuk. !!! 35.4°C
Well look, this is aimed at the millions using kerosene lamps who are nowhere near a grid.
It is a simple, cost effective step up from where they are right now.
Their fuel bill for kerosene id VERY high, for their income
It works – saves them money, gives them a mobile phone charger. The developing world ahs phones now.
Next step is enough electricity for a fridge, etc – which again is going to be solar plus battery and diesel backup, as there isn’t a grid for miles. And you can put solar into a central African town or city in 3 months and double the daytime grid power…
Then you get to Kenyan or SA level -where wind, solar geothermal supplements the grid. This guys have the best solar input – they are near the equator. Its not like they are in Alaska.
An excellent article, which, for what its worth I would like to add that governments always manage to invoke the Law of Unintended Consequences. The classic case in point is our UK government under Gordon Brown who decided it would be a good idea to promote the use of diesel vehicles because they emit less CO2 than petrol vehicles. Subsidies were put in place to encourage people to sell their old petrol cars and drive diesel cars. In the UK we have a road tax which is payable for each vehicle (ostensibly to pay for road building and maintenance) which was a flat rate, now it is in tiers, based on CO2 emission. Anyone who has driven behind a badly maintained diesel vehicle knows how unpleasant it can be with clouds of highly carcinogenic PM10’s being produced together with various oxides of nitrogen, that will cause other health issues. Twenty years down the line diesel vehicles are being banned from cities due to this pollution, Volkswagen is in trouble for faking emission data (no doubt with other car manufacturers to follow). This is the usual farce when governments meddle in things that they don’t understand and makes the idea of “Big Government, an all knowing, all seeing, micro manager of people’s lives, totally obsolete.
“I have no doubt that greenhouse gasses will continue to cause some warming, though less than alarmists claim.” That is an evidence-free, faith-based statement designed solely to placate Warmunists chomping at the bit to throw the D-word. Excellent post otherwise.
Ditto
A picture paints a thousand works. Mr Watts, you are a master at selecting images to convey a message. The donkey and cart in front of a nuclear reactor is a masterpiece of communication.
Well reasoned. However, lacking citations.
BTW hyperbolic or natural draft cooling towers do not automatically mean nuclear, just a very large steam cycle heat load. Could be a big coal plant. No flue gas stack in this case.
Oops. There are stacks. Could be these are coal plants.
The island of Hispaniola is shared by Haiti and the Dominican Republic. I once asked a student from the Dominican Republic what he thought was the reason it was doing so much better than Haiti. He replied, “We had a better dictator.”
Caleb Rossiter –
Please, please, please out your course(s) or lectures online. We all need to see the objective and critical review of how these models wildly predict the demise of the planet.
It has been said that the most efficient form of government is a benevolent dictatorship.
The only problem with that is that benevolent dictators are for the most part, mythical beasts.
That said, some dictators are worse than others.
That was supposed to be in response to commieBob.
Bureaucracy is rife with blamestormers wielding shields of good intentions. Back in the 1970s, carbon monoxide and hydrocarbon tailpipe emissions were an issue so the EPA sponsored research culminating in oxygenate additions to motor vehicle fuels. The research utilized magneto ignition carburated engines..by the time industry could incorporate machinery and processes to make oxygenated fuels, engines had evolved with closed loop lambda control systems making oxygenated fuels unnecessary. But wait, it gets worse.
The oxygenate selected for refinery blending was methyl tertiary butyl ether. Ethanol was not considered as it reacts with steel used in pipelines and storage tanks. But a major issue with underground storage tank leakage was raised by retailers since MTBE dissolves in groundwater . Still the EPA drove on. And now there are plumes of MTBE contaminated groundwater. All for an unneeded fuel additive.
Since then, retailers have installed double walled composite underground storage tanks with leak detection surveillance.
How did that Reagan quote go?
Something like:
The scariest phrase in the English language is “I’m from the government and I’m here to help.”
The technical withdrawal will take a few years, because of the terms of those accords
===============
Why? The agreement has no enforceable penalty so you can simply ignore the terms and withdraw at your pleasure. The worst that will happen is “name and shame”, which is about a stupid a policy for international diplomacy as you can hope to find.
Dr. Rossiter
What is you take on the fact every climate model has a positive feedback variable?
Many articles such as this one that support the use of fossil fuels miss their ultimate benefit. That benefit is that energy makes you rich and rich people have fewer babies. Amazingly this lowering of Fertility starts to drop at an annual income per person of $1,000-2,000 and falls until it hits the replacement level at an income per head of $4,000-10,000 a year. As Rex Tillerson said there is no better way to get people out of poverty than to give them electricity. The goal is to lower the worlds population. This will allow both humans and the environment to flourish.
The five steps would go a long way to improve the incomes of many of the poorest people.
Hmmm, and a head scratch. I’ve had the good fortune of being born into a family that stopped cooking with sticks about 130 years ago; however, despite all that available energy for all those years none in the family tree were made rich by having lightbulbs.
You sound like a good citizen of the world, so you should advise the People’s Republic of China of this nuance of energy, they may decide it’s cheaper to give people lighting rather than the mass sterilization of women. The downside of the plan; however, may be the Proletariat getting rich by having light bulbs in every hut causing them to become capitalist bourgeoisie thereby upsetting the classless society. You should probably run that by Rex Tillerson first.
A warming world is a better world . Any questions .
Yes, I agree. I live in upstate NY, can you promise me warmer January’s and Februarys in my lifetime?