James Hansen: We Have a Little More Time After All (Whew!)
By Robert Bradley Jr.
“Contrary to the impression favored by governments, the corner has not been turned toward declining emissions and GHG amounts…. Negative CO2 emissions, i. e., extraction of CO2 from the air, is now required.”
– James Hansen, “Young People’s Burden.” October 4, 2016.
“The ponderous response of the climate system also means that we don’t need to instantaneously reduce GHG amounts.”
– James Hansen, “We Hold Truths to be Self-Evident“ December 2, 2016.
What a difference a few months make!
Just in time for holiday season, and for the Trump Administration, the father of the climate alarm, formerly a climate scientist with NASA/GISS, and now a full-time scientist/activist, has ameliorated his grand climate alarm. The 10-year ultimatum announced in 2006, made more dire in 2009 and since, is now moderated.
This October, we were told that the net emissions of of man-made greenhouse gases in the atmosphere must go negative. Now, “we don’t need to instantaneously reduce GHG amounts.”
A climate scientist might want to see Dr. Hansen’s math and model simulation to understand the revision in the last sixty days.
Maybe the climate can survive Donald Trump after all!
Here is the history:
Old View (July 2006):
“We have at most ten years—not ten years to decide upon action, but ten years to alter fundamentally the trajectory of global greenhouse emissions” he wrote in his July 2006 review of Al Gore’s book/movie, An Inconvenient Truth. “We have reached a critical tipping point,” he assured readers, adding “it will soon be impossible to avoid climate change with far-ranging undesirable consequences.”
Revised View–Worse Than Thought (2009)
Several years later, with the publication of his 2009 manifesto Storms of My Grandchildren: The Truth about the Coming Climate Catastrophe and Our Last Chance to Save the Planet, he shared “some bad news” (p. 139) with readers:
The dangerous threshold of greenhouse gases is actually lower than what we told you a few years ago. Sorry about that mistake. It does not always work that way. Sometimes our estimates are off in the other direction, and the problem is not as bad as we thought. Not this time.
“The climate system is on the verge of tipping points,” Hansen stated (p. 171). “If the world does not make a dramatic shift in energy policies over the next few years, we may well pass the point of no return.”
Also in 2009, he told the press:
We cannot afford to put off [climate policy] change any longer. We have to get on a new path within this new administration. We have only four years left for Obama to set an example to the rest of the world. America must take the lead.
Revised View–Need to Go Emissions Negative (October 2016)
“Contrary to the impression favored by governments, the corner has not been turned toward declining emissions and GHG amounts. The world is not effectively addressing the climate matter, nor does it have any plans to do so, regardless of how much government bureaucrats clap each other on the back.…. Negative CO2 emissions, i.e., extraction of CO2 from the air, is now required.”
New View (December 2016):
“Stopping human-made climate change is inherently difficult, because of the nature of the climate system: it is massive, so it responds only slowly to forcings; and, unfortunately, the feedbacks in the climate system are predominately amplifying on time scales of decades-centuries.
The upshot is that there is already much more climate change “in the pipeline” without any further increase of atmospheric greenhouse gases (GHGs). That does not mean the problem is unsolvable, but it does mean that we will need to decrease the amount of GHGs in the relatively near future.
The ponderous response of the climate system also means that we don’t need to instantaneously reduce GHG amounts. However, despite uncertainties about some climate processes, we know enough to say that the time scale on which we must begin to reduce atmospheric GHG amounts is measured in decades, not centuries. Given the fact that the fastest time scale to replace energy systems is decades, that means that we must get the political processes moving now. And that won’t happen until the public has understanding of what is actually needed and demands it.
Previous posts on the climate science and climate policy views of James Hansen can be found here.


Discover more from Watts Up With That?
Subscribe to get the latest posts sent to your email.
So I take it coal trains are no longer “trains of death” then? Whew! Dodged that bullet.
Hansen’s New and Used
LAST CHANCE SALE — HURRY! SUPPLIES ARE LIMITED!!
http://l7.alamy.com/zooms/2165ef757d634359b2ccbe7ec8b767b3/closing-sale-ad-b324ee.jpg
“Last Day ?” lol
+ ^^^^
🙂
I imagine a lot of warmistas are twitching uncontrollably and quite possibly looking for a change of undies after reading Hansen’s latest
A technical point, if anyone can help. I’m confused about the actual level of increase in CO2 since 1988. From the chart showing Hansen’s predictions we have this sentence:
I don’t believe I’m nitpicking, as that doesn’t seem like an actual complete sentence. It’s a fragment. The word “is” is missing.
Is 2.5% the actual CO2 increase? And is that 2.5% per annum? Because I thought it was a lot more in total.
Human CO2 Emissions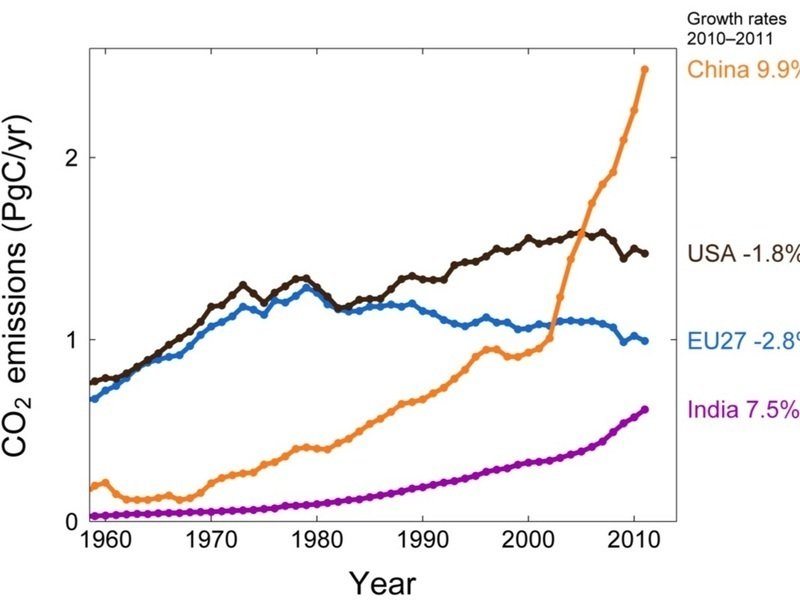
http://climatechangeconnection.org/wp-content/uploads/2014/08/Global_carbon_emissions_by_fuel_source_1751-2007.jpg
(eyeballing it, it looks like a, ~ 60% increase since “Hansen’s Big Day” (1988))
2010-2011 % Increase — CO2 Emissions
(net: 12.8%)
Looks like human CO2 was on a trajectory that flew off the end of Hansen’s chart many years ago….
(sure is good he wasn’t assigned to Flight Command)
CO2 UP. WARMING STOPPED.
But, but, but…….the CHILDREN!!! Oh, the HUMANITY!!!
(8300-6000)/6000 = 0.38 = 38% increase total CO2 since ~1988
Thanks Janice.
So I’ll assume we’ve had MORE than the 1.5% increase in total yearly emissions that Hansen said would correspond to the blue line (temperatures going way up). And that 2.5% is the roughly correct figure. With that, according to Hansen, by now temperatures should have already went through the roof. The oceans should be almost boiling. But we got … nothing. Zero. Nada. No noticeable change in temperature or climate, at all.
Thank you, Clyde Spencer. Do you have the graph that shows your ~38% figure? My find (graph above) makes it look like CO2 c. 1988 was around 5,000. Thanks! (and, I believe you, that your figures are correct, just would like to have a better graph for the record, here)
You’re welcome, Eric. Good to see you back. Well, lol, I guess all that heat went to San Diego (where someone we know said it was, “Hot as HE{CK}!” lololol a couple years ago) — that comment stuck with me, just hit the funny bone that day. Thanks for a smile.
🙂
Thanks again Janice. I should be back every once in a while. I was kind of concentrating my attention on the general election instead of climate change. Now we finally got a real skeptic as president! (And GWB and GHWB were NOT skeptics!)
Eric Simpson December 3, 2016 at 3:55 pm
Thanks Janice.
So I’ll assume we’ve had MORE than the 1.5% increase in total yearly emissions that Hansen said would correspond to the blue line (temperatures going way up).
That assumption is incorrect, Hansen’s projection for Scenario B was CO2 level of 400.5ppm.
Phil “That assumption is incorrect, Hansen’s projection for Scenario B was CO2 level of 400.5ppm.”
Then why does the caption on the graph on this page say that the reality is the increase in CO2 emissions is 2.5%, which “would correspond to the scenario ABOVE the blue curve.” ?
Phil
In other words, no matter what we do, even if we increase CO2 emissions through the roof, it would never go above 600ppm.
The 600ppm level of CO2 does not seem like anything to be alarmed about. Indeed, it would seem to be a positive.
I meant the last comment (about 600ppm) to be for Chimp, below. My bad.
Eric,
Yes, it’s hard at best to cook up any fossil fuel use scenario over the next century that gets us to 600 ppm. We’re unlikely to keep gaining two to three ppm per year, as gas replaces coal and oil in more and more applications. But even at two ppm per year, it would obviously take 100 years to reach 600 ppm.
Salubrious as 600 ppm would be, 800 would be better, getting us into the zone that most pleases most plants, to include all trees and the majority of crops. As noted elsewhere, 1000-1300 ppm, as in greenhouses, would be best of all.
Chimp
If our CO2 emissions are going to naturally nosedive I hope we can do something to keep those emissions up so we can reap the benefits of the ppm reaching at least 600ppm if not the higher levels that you would prefer. I’m usually against govt subsidies, but maybe, as people switch to natural gas and other energy sources, we should provide big subsidies for burning coal and oil to keep that CO2 level rising.
And btw, keep in mind that the 1300ppm that you mention would be ideal is just over 1 part CO2 per 1000.
1 part per 1000! This is what the fear-mongering Chicken Littles are squawking about!
Eric,
Dunno if we’ll ever need to subsidize fossil fuel burning. The world is in a naturally warming trend, so CO2 should stay in the 300s ppm even if humans don’t burn any wood, coal, oil or gas. But we’ll continue to engage in CH4- and CO2-producing activities even if and when most of our electrical power and transport energy comes from nuclear, hydro, “renewable” and other sources.
If wind and solar ever become economical, I hope that their dire environmental costs can be ameliorated somehow. It’s for the birds and the bats, if not the children.
Chimp,
Speaking of wind power / and birds, I know that in the mountains by Big Bear Lake CA they close off a popular trail for nearly 6 months because they are worried that some hikers may inadvertently disturb the habitat of a few nesting Bald Eagles.
But drive off the mountain into the desert below (near Barstow) and you find just hundreds of these massive & ugly windmill monsters that must be killing scores of Bald Eagles all the time. SHUT THOSE WIND MONSTERS DOWN!
Here’s is a truly disturbing video, big bird KILLED by windmill:
Eric,
It’s so hypocritical it’s sickening that windmills and solar farms are exempt from environmental and endangered species legislation.
And the production of windmills and solar panels in China would never pass environmental muster here.
Eric Simpson December 3, 2016 at 5:14 pm
Phil “That assumption is incorrect, Hansen’s projection for Scenario B was CO2 level of 400.5ppm.”
Then why does the caption on the graph on this page say that the reality is the increase in CO2 emissions is 2.5%, which “would correspond to the scenario ABOVE the blue curve.” ?
I don’t know where they got their numbers from but the Hansen data shows 400.5ppm for scenario B. Perhaps you should ask the original poster?
ftp://aftp.cmdl.noaa.gov/products/trends/co2/co2_annmean_mlo.txt
Mauna Loa shows growth in annual mean CO2 fraction from 351.56 ppm in 1988 to 400.83 ppm in 2015, a 27-year gain of 49.27 ppm or 14.01%. Thus, the average yearly growth in CO2 concentration has been 1.82 ppm. It has ranged from 0.48 ppm in 1992 to 3.05 in 2015. This El Nino year might equal or exceed last year. CO2 jumped 2.93 ppm in the El Nino year of 1998, but just 0.93 in 1999. The lowest growth in this century was 1.56 ppm in 2004.
A Pinatubo effect might be evident in 1991, when CO2 gained only 0.99 ppm, and especially ’92. However the growth rate was already headed down, as it grew 2.29 ppm in 1987, 2.13 in 1988, 1.32 in 1989 and 1.19 ppm in 1990.
Thanks for those numbers, Chimp. There seems to be a lot of variance, but a report out (with graphic) last month suggests that the rate of CO2 growth has been flat at 2% for the 12+ years since 2002, while the rate of growth had been growing for decades before that: http://www.dailymail.co.uk/sciencetech/article-3917244/Is-greenhouse-effect-slowing-CO2-atmosphere-plateaued-12-years.html
A possible explanation is that a growing biomass of plants are soaking up a lot of the CO2.
I’ve also heard it predicted (as by Art Robinson) that even with growing CO2 emissions the limit on the parts per million (PPM) that we’d see would be ~ 600ppm. I don’t know what the reasoning was, but an increase to 600ppm with it positive effects on plants (and essentially zero affect on warming at these ppm levels) has got to be considered a big benefit to the planet.
The El Nino CO2 ‘burps’ are just Henry’s Law of physical chemistry. The effective rate is just under 2ppm with a very slight acceleration. More signiticant is that ~1/3 of all CO2 increase since 1958 (Keeling curve inception) has been since 2000, a period in which except formthe now rapidly cooling 2015-16 El Nino blip there has been no atmospheric warming detected by satellite or balloon.
Every time alarmists say we have reached the point of no return or tipping point ,people lose any incentive to do anything. The proper interpretation of that observation is that it is futile to do anything as its now too late the world is doomed. We should totally spend our resources on the current generation as climate change has already gone too far to save the future. It is similar logic that caused the Australian government to sack a whole lot of workers at its chief scientific body the CSIRO who were told that because the science is 97% certain there was no need to continue to research it.
That caused serious angst and unfortunately the government backtracked and rehired many of them. If you expect people to believe in what you say then understand that the consequences of this belief may be that the money tap will be turned off.
David, you are absolutely right. There fore I am going with their worst prediction, I am going out and enjoy myself before it is too late. ( the aussies rehiring the CSIRO was a joke, but I guess the golden hand shake must have cost more than keeping them on and at least you know where they are.)
The motivation for Hansen’s switch is obviously the election of Trump. He never did believe his “doom is nigh” nonsense – he was just pressing for immediate action since he had a favorable dupe in the White House. Now that we’ve got a President who is going to show no inclination to drastically cut CO2 emissions for the next 4-8 years, Hansen needs to dial back the apocalypse. Otherwise, in 2020 or 2024 everybody is going to think it’s too late to do anything about the climate and we might as well go out enjoying ourselves.
Here’s my climate-related prediction. As soon as there is another Democrat in the White House, Hansen – if he’s still alive – will again get on his street-corner soapbox with his end-of-the-world-is-coming routine about “tipping points” and “four year deadlines.”
Kurt,
Is that a soapbox that converts into a sandwich board that says, “The end is nigh!”?
+1
(and it also converts into a little get-away car…. but, in the end, he’ll just be burning it to cook his pan of pork and beans….. getting — brrrr — colder)
🙂
the end is always nigh.
it’s nigher than we thought.
it comes as no surprise
they should have known they would be caught.
Agreed Kurt!
I am surprised, I had begun to think that Hansen was showing age related senility; but this turn around show that he is coherent and attentive to current events.
When a new leader takes the field, especially a no-nonsense impatient leader, all of the political gluteous maximus osculators, flexible fawners and climate fund parasitic sycophants; those with brains at least, immediately bow while pretending to respectfully celebrate the new leader’s words and ideas. All, while thinking Marcus Brutus thoughts. Et tu?
Griff will be along soon with his Arctic ice graph.
Griff? Where is he? I miss my daily thigh-slapper!
I hope you’re right. I’ve been wondering how the arctic ice was doing.
TA , it’s doing fine kinda cold up there though.
Ross King December 3, 2016 at 2:45 pm
“Griff? Where is he? I miss my daily thigh-slapper!”
Oh payday people, Griff is probably off to the pub thank, to our generosity. I hope he got enough for a good helping of “pub” food.
michael
Do you talk about this graph?
http://www.woodfortrees.org/graph/nsidc-seaice-n/plot/nsidc-seaice-n/last:156/trend
13 years no decline in arctic sea ice extend
“This El Nino year is proof positive that climate sensitivity Isn’t anywhere near what he once thought it was. Right now Global temperature has fallen towards the plateau set from the 1998 Super El Nino, especially over land as seen below.. ?w=640
Well no.
Global temps haven’t “fallen towards the plateau set ….”
http://www.drroyspencer.com/wp-content/uploads/UAH_LT_1979_thru_November_2016_v6.gif
In fact this last November was the second warmest in the UAH sat temp record.
“Combine that with the fact that even as carbon dioxide has been increasing, temperatures have not been upwardly tracking with it, but instead we’ve seen El Niño driven spikes in temperature, which have nothing to do with CO2 sensitivity. The natural variation of the system still rules the climate.”
Why would you expect “temperatures to track with it” (in a monatomic fashion) ?
There is a natural variation. On top of the AGW signal.
For the same reason that you say the EN has raised GMST’s, then the previous 18 odd years of predominantly -ve PDO/ENSO/LN regime suppressed them.
You can’t just credit the heat from the cycle and deny the cooling side.
Either both are true or neither are.
Also this is the history of the PDO regime vs GMST.
Please do notice that all varieties climb along with the temp.
http://static.skepticalscience.com/pics/JohnN-G_ENSO_trends.gif
So generally speaking we have a system that receives solar energy, stores it and then,in cycles, returns some of it to the atmosphere, and all the while (long term trend) manages to make the atmosphere warmer.
Whilst also heating the deeper ocean…..
If the sun is not powering warming (it isn’t – ask Leif), and as you imply instead ENs are, then the oceans would be cooling.
A transfer of heat from ocean to atmosphere.
http://www.nodc.noaa.gov/OC5/3M_HEAT_CONTENT/
What AGW signal?
No such thing is in evidence globally. Whatever warming has occurred since CO2 took off after WWII is well within normal bounds. Previous warming cycles since the Holocene Optimum have lasted longer and gotten hotter.
For that matter, for practically the first half of the monotonic postwar CO2 rise, earth responded by getting colder. So much so in fact that in the ’70s the scare was the coming return of the ice sheets, not global warming.
Humans have made cities and some other parts of the planet warmer, but overall, not so much, and not measurably from the GHE. So far, more CO2 has been beneficial to plants and other living things.
Dear Mr. McLeod,
(in your ear) You mistakenly posted the wrong graphs. They (##1 and 2) SUPPORT the statement you (apparently) intended to contradict:
(btw: we saw you slip that card into your sleeve — well, I thought you’d be better off knowing, you want to get hired for more gigs, don’t you? — i.e., no one was fooled by your “warmest in the UAH record” sleight of hand.)
Janice
Blatent bafflegab, or just boring BS, how to decide which?
*Blatant*, sorry.
must.stop.drinking.t’night.
why?
Toneb,
You ask, “Why would you expect “temperatures to track with it” (in a monatomic fashion) ?”
Umm, because that’s what the models show. You know, the ones that predict climate catastrophe right around the corner. No, not that corner, the next one…
By which I assume you mean “monotonic”.
But.but…haven’t we already passed the “tipping” point(s?) that Hansen and the rest of the Muppets had projected?
Yet, here we still are commenting on WUWT.
Perhaps all those “tipping points” were, what’s current the term?, “Fake News”? “Political Science”?
Toneb, that is all way to systematic and logical for the choir here. They prefer the tabloid:
“SHOCK:” nonsense; anything that confirms their ideological bias.
But hats off to you for trying.
Tony, what is the maximum temperature this planet can reach because of CO2?
Water vapour, methane, CO2, etc, or just CO2?
Total atmospheric forcing usually has the planet at about 23C.
Your point?
…read down a few posts
Nice bit of bafflegraph there. You must have read “How to lie with statistics”. Three different sources, to different time scales, apparently using linear least squares on self-correlated data, one graph with multiply corrected figures, homogenization, different periods, Well Done! it’s almost believable
Measurements? Surely you jest, Mr. Gardener.
http://woodfortrees.org/plot/uah6-land/from:1998/to:2016.25/trend/plot/uah6-land/from:1998/to:2016.25
Taking peak of 1998 El Nino to peak of recent event from UAH land only shows a rise of about 0.06 deg C in 18 years.
that’s about 0.03 deg C per decade or 0.3 per century.
http://woodfortrees.org/plot/uah6/from:1998/to:2016.25/trend
Looking at full global average it’s about half that : 0.015 deg C / decade.
Now watch as climate “scientists” start falling over each other to say it’s not as bad as we though please don’t defund the important work we are doing.
This the part that warmists like Toneb ignore.the PER DECADE trend. It waaaay below the IPCC minimum rate.
Glad you posted it, Greg!
Speaking of “cherry-picking” intervals, your GISTEMP graph with the meaningless linear trends completely obscures what happened before 1977 (try starting this in the late 50s, for example). And then notice that stopping somewhere around 2007 obscures how flat that period from 1997/1998 is, up to the latest El Nino.
Net, net, you took the step function that was associated with the major El Nino in 1997/1998 and used it to pretend there is some sort of pure linear trend over the last 50 years instead of the variation we’ve experienced (with a slow upward trend) over the last 100+ years. And of course, even the 0.6 degrees C you noted over the fifty year period only works out to 1.2 C/century. And CO2 has increased how much over that period? And therefore the sensitivity is what?
As usual, using the two El Nino steps to fabricate a trend.
Do you have any other monkeys handy?
Toneb…..not Tony
And guess who Troll Tone B is trying to smear (use to create confusion)?
(for those new to WUWT, “Tony B” is a fine science realist scholar’s scholar who regularly posts impeccably well-founded-in-science comments)
Thanks Janice….I got caught in that one
Someone was posting using AndyG55’s handle too
How many of the ocean buoys are present in the Arctic? Where is it that sea ice absence has allowed the oceans to cool? Oh yeah, the Arctic. Did you also forget about the paper showing upward vertical movement of energy in the oceans? Is that why you limited the data to 700 m?
This is what happens when a person doesn’t understand the data he is using. ToneB is a perfect example of why bias so easily destroys ones critical thinking ability.
Richard M,
Critical thinking is a handicap if you are a climate change believer.
The Climate Holy trinity for the Left is:
-The IPCC (the gospel-spewing savior)
-The UN (the benevolent Father)
-The Keeling Curve (the omnipresent ghost affecting all life).
i stick with Bob Tisdale’s theory: i suspect the global temp will soon show a small step up. (though this time signs are a bit contradictionary: arctic sea ice very low, but greenlands ice melting is also very low with a record whopping + 100 Gton far above any recorded gain anomaly. so not sure if it will)
if the temp will make a step up around the +0.4 anomaly mark that makes El nino driving the warming….
that gives Leif a big problem: the only driver of El nino is…. the sun. (and cloudiness)
Toneb
You nailed it for once, it is a natural warming cycle and see you didn’t even have to mention agw to explain it.
Clearly, Hansen must see that “the gig is up” and that he has to find a new way of spinning himself into some kind of new relevance and concomitant funding.
The GOOD NEWS for us is that this is very clear evidence — from no less than ***HANSEN*** that the cracks in the whole crumbling edifice of AGW theory, practice, politics and funding are so fast appearing that die-hards like him are looking for a new start.
Sorry, buddy, go tote sandwich-boards to earn a crust … you are irredeemably tainted with the label: ‘Snake-Oil Salesman’.
P.S. Hansen … live by the sword, die by the sword. No-one believes you any more.
Jim Hansen has a sweet GS retirement check every month. Courtesy of his the US tax payer. As Director of NASA/GISS, he was Senior Executive Service, which with COLA is a nice $140K year ( or more) package
I think it’s to late, the crime has already been committed. Lock him and Gore for fraud.
Guardian piece from July 31, 2008:
https://www.theguardian.com/environment/2008/aug/01/climatechange.carbonemissions
“Time is fast running out to stop irreversible climate change, a group of global warming experts warns today. We have only 100 months to avoid disaster. Andrew Simms explains why we must act now – and where to begin…….”
100 months from the end of July, 2008 was Nov. 30, 2016 (if my math is right). Terrific, so I have been getting all set for runaway climate change this year and was planning on attending Ms. Schmidt’s Good Grief therapy sessions out in Utah.
And now Hansen comes along and tells us that we’ve been given a bit of a reprieve from the Nov 30th deadline this year. I mean, what’s a body supposed to do here? End-of-the-world gloom and doomers have been persistently wrong throughout human history, but climate alarmists can’t possibly be repeating history here, can they?
Noooo, of course not. (sarc).
Hansen is just playing the long game. He wants the gravy train to last decades, not a year or two.
Exactly. Hansen wants to glean favor from the skeptics by being the idiot that finally learned the real science. If the political worm turned, it would bet a given that he would pivot back to alarmism. He is a political whore.
Rat,
+10 on the comment.
+1e+06 on the screen name.
Hansen is hedging his bets. Nothing to see here, folks, he says.
How much of our money has this man caused to be wasted on this CAGW sc@m? How many people has he driven temporarily insane with fear because of his lies? He’s got practically the whole elite world marching to his tune and now he wants to change this tune a little.
We want our money back, Hansen.
He is not changing his tune one iota. That is purely the bias you see when you look at all this through the WUWT prism.
“He is not changing his tune one iota. That is purely the bias you see when you look at all this through the WUWT prism”
Yeah, yeah, yeah…
You just go right on believing your hokey schtick, tony.
But it’s over, believe me.
AGW = It’s All Gone Wrong!
tony mcleod, “He is not changing his tune one iota.”
Jim Hansen Climate Change: On the Edge
Published on Friday, February 17, 2006, by the Independent/UK
Available here: http://www.commondreams.org/views06/0217-22.htm
Original here: http://news.independent.co.uk/environment/article345926.ece (truncated and requires purchase).
In 2006: “How long have we got? We have to stabilize emissions of carbon dioxide within a decade, or temperatures will warm by more than one degree. … we cannot wait for new technologies like capturing emissions from burning coal. We have to act with what we have. This decade, that means focusing on energy efficiency and renewable sources of energy that do not burn carbon. We don’t have much time left. (my bold)”
Jim Hansen, 2016: “The ponderous response of the climate system also means that we don’t need to instantaneously reduce GHG amounts. … the time scale on which we must begin to reduce atmospheric GHG amounts is measured in decades,… (my bold)”
Also in the 2006, Independent: “Once a sheet starts to disintegrate, it can reach a tipping point beyond which break-up is explosively rapid. The issue is how close we are getting to that tipping point. The summer of 2005 broke all records for melting in Greenland. So we may be on the edge. (my bold)”
Hansen’s changed his tune many iota.
Here’s probably why: catastrophe predicted within a decade of 2006. Let’s see, that’s umm … calculating … 2016! Greenland icesheet: still here. Air temperature change 2006-2016: approximately zero (El Niño apart).
2006: On the edge
2016: Ponderosity
He’s back-sliding.
Tony,
So, claiming settled science, predicting catastrophe right around the corner ans shouting that “We’re on the Venus Express, the oceans are going to boil and we’re all going to die!” isn’t one iota different from saying there is much we don’t know about climate and that there’s plenty of time. What color is the sky on your planet?
Through the prism of reality, here is what Hansen said in 2009. Compare and contrast with now:
In his book Storms of my Grandchildren, Hansen issued this dire warning: “[I]f we burn all reserves of oil, gas, and coal, there is a substantial chance we will initiate the runaway greenhouse. If we also burn the tar sands and tar shale, I believe the Venus syndrome is a dead certainty.” (In fact it would take ten times as much CO2 as could be released by all the presently accessible fossil fuels to have any chance of runaway heating, even by the accounting of climate alarmists.)
http://news.nationalgeographic.com/news/2013/13/130729-runaway-greenhouse-global-warming-venus-ocean-climate-science/
He said that burning of fossil fuels leaves earth in “imminent peril”. He suggests that millions of species, and humanity itself, are threatened. The book title refers to the ferocious and stormy weather events that will occur next generation if fossil fuel use continues in the way it has.
Hansen claimed that we immediately need to cut back atmospheric carbon dioxide emissions to stabilized at 350 ppm or less, in order to avoid environmental disasters for generations to come. He advocated prompt phaseout of coal plant emissions, plus improved forestry and agricultural practices.
That was then. This is now. The urgency is gone with the wind.
Ok you got me. He’s a contrarian.In fact, wasn’t he talking about the looming ice age back in the seventies?
Tony,
I don’t know what Hansen’s opinion was about global cooling in the 1970s, but his colleagues at NASA and NOAA publicly expressed concern about the looming return of ice sheets.
Academia of course was also infected with the possibly lucrative fear. In 1974, the year after I graduated, my Stanford profs Ehrlich and Holdren (Obama’s science advisor) warned of coming icy doom. Ditto Schneider and many others who later jumped on the global warming band wagon, or should I say gravy train?
The quantitative absurdity this whole lost generation is based upon is Hansen’s claim , http://cosy.com/Science/Hansen.avi , that Venus’s surface temperature , 225% ( 400K > ) the gray body temperature in its orbit is due to some electromagnetic , ie : spectral , phenomenon . Quantitatively absurd by the most classic experimentally founded and verifiable computations . ( I’m waiting to see some brilliantly simple demonstrations of these classic quantitative laws . )
Yet the entire GHG paradigm asserts that some cascade of spectral filters trap the 33K difference from the crudely estimated radiative balanced temperature of 255K .
SHOW ME .
Either the equations or the experiment . Some variation on Ritchie’s 1830s experiment should do . Nothing complicated — just demonstrate it in a 1 dimensional sandwich between a heat source and sink .
You can’t get the equations to balance without the terms for the other macroscopic force .
Even if, as it would seem, we live in a ‘Post-Truth’ world (thanks in large to the Mannipulators of Climate
Science), the irony is that TRUTH becomes The Gold Standard.
And the ULTIMATE TRUTH can only be determined by a return to the old-fashioned principles of rigorous
Scientific challenge, repeatability of results and vigorous debate, etc. For Heaven’s sake, Einstein is still being questioned (albeit at the margins) but *his* science has never been settled, has it? I posit that *no* science is *ever* “settled”, so who are these sinecure-seeking, Charlatan, Snake-Oil Salesmen to persuade us otherwise?
I think we ‘lost the script’ shortly before the onset of the AGW debate …. perhaps by the back-room politco/scientific spin-doctoring during the mad-cow scare. The Pay-Masters told the Scientists what to say to further their political ends. Goodbye scientific integrity.
The Scientists, not being short of brain synapses, twigged-on that it is a two-way street … and here we are with this unholy alliance between opportunistic politicians and sinecure-seeking pseudo-scientists (a pox on both of them!)
Let TRUTH be held to the highest levels of testing, not something gleaned from pseudo-scientists, politicians and — of course — their ever-sensationalist parroting friends — the media.
Agree the whole Venus/CO2 thing is totally messed up but it is the foundation of the AGW movement, damn you Carl Sagan, it’s the massive Venutian atmospheric pressure creating supercritical C02 at the surface, basically the surface of Venus is an liquidy ocean-like CO2, as any rookie scientist knows you heat a liquid up and it veerrrrrry slowly rises due to buoyancy, hardly any convection at all. But on Earth when you heat up air or vaporize water at the surface it rises very fast that’s why nearly 90% of heat transfer is due to convection. But the fake news is that is Venus is hot due to CO2 not pressure and since that is the official propaganda try to oppose it and you get banished.
Venus ~95% CO2 atmosphere, HOT! Mars, 95% CO2 atmosphere, COLD! Venus, ~90 x earth atmospheric pressure/mass. Mars ~0.6 earth atmospheric pressure/mass. Gas laws apply. CO2 insignificant to temperature.
Yes . But it still needs to be emphasized that the force which “causes” the pressure is that only other macroscopic force : gravity . That pressure , “lapse rate” , whatever , doesn’t just happen . It is due to precisely quantifiable and quantified non-optional gravitational force . It cannot be left out of the energy balance equations . And the trade-off shows itself as kinetic thermal energy . Others , eg : HockeySchtick , have worked out the equations . I’m totally focused on finding the market for my 4th.CoSy , but that does seriously include people interested in modeling planetary physics as I discussed at the Minnowbrook2013 APL Implementers Conference so I’ll wait for others to motivate work in that direction .
The bottom line , tho , is that the notion that a spectral GHG effect is responsible for the ~ 33K difference between our “radiative balance” temperature and our surface temperature is simply , classically , and experimentally provably false . It defies the Divergence Theorem . It fails undergraduate physics and Hansen should have been laughed out of the room for incompetence when he first made his claim . Instead it has become a paradigm which has retarded a generation .
The only effect changes in CO2 or other GHGs have on our temperature is the de minimis changes they may make at these already optically saturated levels in our spectrum as seen from outside . No “tipping points” around except the one at 273.15 .
Anthony
Interesting RSS plot: sort of looks like the area under the 1998 El Nino peak is about equal to area under the 2015/16 peak, which would make sense if approximately the same total energy was released.
Jane,
Compare for yourself the data on 2015/16 vs. 1998 El Ninos.
(Mucho thanks to Bob Tisdale and his blog.)
Mr Watts, this relationship is extremely easy to map-out, and should have been the starting point of any serious research. You should commission a simple article that Simply take a data set of Temperature and CO2 and add on the marginal energy absorption of atmospheric CO2. That last data is easily found using MODTRAN.
Example:
Year CO2 Temp Delta T W/M^2 Delta W/M^2
1880 285 14.1 290.89
1900 295 14.2 0.1 290.701 -0.189
1920 305 14.05 -0.15 290.544 -0.157
1940 310 14.3 0.25 290.481 -0.063
1960 315 14.2 -0.1 290.419 -0.062
1980 335 14.4 0.2 290.105 -0.314
2000 370 14.6 0.2 289.665 -0.44
2016 400 14.8 0.2 289.288 -0.377
1880 285 14.1 290.89
1910 300 13.85 -0.25 290.638 -0.252
1935 310 14.2 0.35 290.481 -0.157
1975 330 14.2 0 290.199 -0.282
2016 400 14.8 0.6 289.288 -0.911
Year Delta T/Delta W/M^2
1880
1900 -0.53
1920 0.96
1940 -3.97
1960 1.61
1980 -0.64
2000 -0.45
2016 -0.53
1880
1910 0.99
1935 -2.23
1975 0.00
2016 -0.66
The δC / δW/M^2 doesn’t make much of a case for CO2 to be the cause.
http://www.worldviewofglobalwarming.org/images09/CO2Temp.jpg
Just look at this chart. The ΔC falls between 1880 and 1910, yet the ΔW/M^2 increases. The ΔC then climbs between 1910 and 1945, and the ΔW/M^2 increases. The ΔC then falls between 1945 and 1985, and the ΔW/M^2 increases. The ΔC then climbs between 1985 and 2016, and the ΔW/M^2 increases. CO2 trapping W/M^2 can result in either falling or rising temperatures. That is a problem.
http://www.worldviewofglobalwarming.org/images09/CO2Temp.jpg
“We’ve noted previously, that it is 150% wrong.”

There is no indication where those claimed measured temperatures are from. What dataset?
In fact, Hansen was predicting surface air temperature. And his prediction has stood up very well.
@Nick Stokes, this is a very very very easy problem to solve. Simply calculate the ΔC°/ΔW/M^2. You simply can’t tie CO2 to ΔC° and CO2’s ΔW/M^2. If you can’t demonstrate that the additional energy trapped by CO2 results in higher temperatures, you can’t make your case.
How is that different from standard sensitivity, expressed as °C/(forcing in W/m2)?
Greg,

“As you well know it is the temperature record which has been adjusted to fit the earlier claims, if you are going to use GISS LOTI.”
What I very well know is that it has no dependence on adjustments, which in any case are not made by Hansen, but NOAA. I know that because I calculate global temperatures myself, using unadjusted GHCN temperatures. And it makes no difference. TempLS in green, GISS L/O in brown:
The numbers don’t add up. There is extreme variability with the Δ°C/ΔW/M^2, in fact at some times it may be (+) and at others (-). There must be other factors driving temperature, otherwise,there would be a linear relationship. There isn’t.
“Nick Stokes December 3, 2016 at 4:06 pm
How is that different from standard sensitivity, expressed as °C/(forcing in W/m2)?”
Forcing? What is being forced? Theory? And you say science is on your side? Total BS!
Nick writes
Most closely tracking scenario C which is Hansen’s prediction for rapid decline in CO2 emissions. Reality is much closer to scenario A which is increasing CO2 emissions. Scenario B is slowing rate of use. Are we doing that? No. Just ask China and India…
Although I’ll admit that the numbers Hansen used (A:410ppm, B406ppm, C~370ppm – assuming you’ve quoted them correctly at your site) would put the scenario closer to B. So basically Hansen over estimated the warming as well as over estimating the emissions. in terms of “naming” the scenarios.
“Hansen over estimated the warming as well as over estimating the emissions. in terms of “naming” the scenarios.”
The scenarios are more complex than can be covered by simple tag names. They allow for changes in CH4, CFCs, and for volcanoes (at least B and C). CH4 fell well short, for CFCs, the effects of the Montreal protocol came after 1988. Hansen’s program predicts the effects of GHG gases. It does not predict the amounts that might be put there by emission. It does not even relate emissions to concentration.
Without comparing the evolution to the actual numbers input, you can’t say that he overestimated warming.
As I said above, those gas numbers were posted here for a similar paper the following year. They don’t exactly correspond, but are close.
Nick writes
Nonsense. You can see his projection is tracking most closely to scenario C and that was based on about a 370ppm CO2 calculation. There is no way the other GHGs make up for that difference.
Hansen’s projection was a fit based on the current warming rates in his day. That’s what happened and explains his results perfectly.
Nick writes
Hansen had another program to predict the CO2 emissions. Hence why they’re output to a ridiculous 12 decimal places. I’ll warrant it was very simplistic.
Nick wrote
From Hansen’s paper
So…nope. You cant blame the effect of CFCs in his scenario B and C projections.
Oh and I see that Hansen predicted a positive feedback from stratospheric H2O. You asked who had assumed water vapour would increase in the stratosphere (in the face of it actually being a negative feedback and decreasing in reality) and now you have the answer.
TTTM,
“You cant blame the effect of CFCs in his scenario B and C projections.”
No. Here are the headings of the gas conc file I posted:
CO2_A N2O_A CH4_A CFC11_A CFC12_A CO2_B N2O_B CH4_B CFC11_B CFC12_B CO2_C N2O_C CH4_C CFC11_C CFC12_C
CFC11 and 12 were in all scenarios. Here are the actual numbers for 2015, from that 1989 file, with CFC nums from here:
CO2, N2O was scen B, the rest Scen C
Nick writes
OK, I’m willing to accept “minor chlorine and fluorine compounds” doesn’t include CFCs as a whole.
What’s going on with Hansen’s Figure 2? He appears to be implying that the CO2 forcing for lets say scenario A is about 0.8W/m2 by 2050 but when you add the other trace gasses and even add the negative impact from aerosols, the forcing is about 2.2W/m2
How does that work exactly?
Obviously I mean delta T rather than W/m2 but it looks like he’s attributing about 2/3 of the warming to the trace gasses??
No Nick , that’s a disingenuous claim. As you well know it is the temperature record which has been adjusted to fit the earlier claims, if you are going to use GISS LOTI.
What Hansen said in 1988 was NOT based on rigging the SST record by applying NMAT “corrections” to daytime SST.
Post hoc adjustments to SST do not count in assessing how accurate his predictions were, not to mention the constant ‘warming up’ of the land based data as well.
Also your blue line “GISS Ts MET stations” ( ie the land record ) is not comparable to the “global temperatures” plotted from Hansen.
With exception of the recent spike, the closest match seems to be “scenario C” which is the drastic reduction on CO2 output starting in 1990 which just did not happen. Basically AGW is busted.
Thanks for the graph.
Greg,
Reply above
The test for scenarios is what happened. Scearios were defined in terms of forcing – GHG concentrations. In fact, what evolved was between B and C. Discussion here.
Nick StokesDecember 3, 2016 at 4:46 pm
” I calculate global temperatures myself, using unadjusted GHCN temperatures.”
GHCN temperatures are already adjusted by the time you get them to use Nick. Tell the truth for a change.
Evidence? It’s quite untrue. GHCN unadjusted means just that.
“Nick Stokes
The test for scenarios is what happened. Scearios were defined in terms of forcing – GHG concentrations.”
That’s not accurate. Hansen’s three scenarios were distinguished by different GHG emissions rates, not rates of increasing concentration in the atmosphere. Those are two different things. Global emissions rates since 1988 met or exceeded Hansen’s scenario A, in which he assumed a 1.5% annual increase in emissions from 1988. At that rate, in the 17 years from 1998 to 2015, CO2 emissions would have increased by a factor of 1.49. This article pegs actual emissions increase since 1990 at 50%: https://insideclimatenews.org/news/19052016/global-co2-emissions-still-accelerating-noaa-greenhouse-gas-index.
Temperatures rose nowhere near what Hansen’s model predicted for our actual growth in emissions.
Kurt December 3, 2016 at 10:29 pm
“Nick Stokes
The test for scenarios is what happened. Scearios were defined in terms of forcing – GHG concentrations.”
That’s not accurate. Hansen’s three scenarios were distinguished by different GHG emissions rates, not rates of increasing concentration in the atmosphere. Those are two different things. Global emissions rates since 1988 met or exceeded Hansen’s scenario A,
As stated in Hansen et al 1988 scenario A assumed continuing exponential trace gas growth, B assumed a reduced linear growth of trace gases, and C assumed a rapid curtailment of trace emissions.
Hansen’s projection for scenario B was CO2 by 2016 of 400.5ppm.
Temperatures are below scenario C, if we had curtailed all co2 production years ago.
“GHCN temperatures are already adjusted by the time you get them to use Nick. “
No evidence, and easily refuted. I have written a post here setting out how BoM goes from AWS numbers posted every half hour (within minutes) to a monthly file, CLIMAT form, and so to GHCN unadjusted. You can check at every stepo. But of course, no-one is interested in that. More fun just to rant.
“Hansen’s three scenarios were distinguished by different GHG emissions rates, not rates of increasing concentration in the atmosphere. “
No. Emission ideas inspired them, but you can’t use those for computation (or not in Hansen’s day). You need concentrations, and they have been posted. Here is Hansen setting that out:
The actual numbers (gas conc) for the scenarios are given here. That’s from a paper a year later, but using the same scenarios.
“Phil:
As stated in Hansen et al 1988 scenario A assumed continuing exponential trace gas growth, B assumed a reduced linear growth of trace gases, and C assumed a rapid curtailment of trace emissions.”
You need to read the Hansen’s paper more carefully. These are the exact words on the assumptions of his scenario A: “Scenario A assumes that the growth rates of trace gas EMISSIONS typical of the 1970s and 1980s will continue indefinitely. The assumed annual growth averages about 1.5% of annual EMISSIONS.”
Nick Stokes:
“Emission ideas inspired them, but you can’t use those for computation (or not in Hansen’s day). You need concentrations.”
Emissions “ideas” didn’t “inspire” the scenarios (whatever that gibberish means). The emissions growth rates WERE the scenarios. Whatever CO2 concentrations resulted from those scenarios were, like temperatures, an output of the scenario, not an input. Otherwise, he would have included those in the paper itself. And the portions of appendix B that you don’t quote affirms again that the assumptions of the scenarios are in the growth of emissions, not atmospheric concentration.
You’re just engaging in sophistry to try to explain away the fact that his predictions of what would occur for what he testified under oath before Congress was the “business as usual scenario” was wildly inaccurate. And do you really want to be arguing argue that Hansen’s knowledge of the climate system wasn’t good enough for him to get something relatively simple right, like what atmospheric CO2 concentration would result from a given rate of growth in emissions, but that he understands the climate well enough to get the insanely hard stuff right, like what the temperature curve is going to look like for a given rise in concentration. What you see as some kind of validation for a wrong prediction is just an ex post facto correlation to try to salvage something from the failure.
Kurt December 4, 2016 at 5:06 am
“Phil:
As stated in Hansen et al 1988 scenario A assumed continuing exponential trace gas growth, B assumed a reduced linear growth of trace gases, and C assumed a rapid curtailment of trace emissions.”
You need to read the Hansen’s paper more carefully. These are the exact words on the assumptions of his scenario A: “Scenario A assumes that the growth rates of trace gas EMISSIONS typical of the 1970s and 1980s will continue indefinitely. The assumed annual growth averages about 1.5% of annual EMISSIONS.”
I have read it very carefully, many times, my statement to which you refer is accurate.
You’re just engaging in sophistry to try to explain away the fact that his predictions of what would occur for what he testified under oath before Congress was the “business as usual scenario” was wildly inaccurate.
His projections for CO2 in 2016 were:
A 405.4ppm, B 400.5ppm, C 367.8
M-L data Oct 2015 398.3ppm, Oct 2016 401.6ppm
Not bad for a estimate made 30 years ago!
As he stated at the time he expected that scenario B was “perhaps the most plausible of the three” and that scenario A “must eventually be on the high side of reality”, also that scenario A included some speculative, “crudely estimated trace gas trends” which the others did not.
His estimates for CH4 and CFCs are better matched by scenario C, although after plateauing after 2000 CH4 is now growing again. (CH4 fixed at 1916 ppb, actual 1834ppb)
“Phil
I have read it very carefully, many times, my statement to which you refer is accurate.”
No – it’s not accurate. Your statement was that Scenarios A-C related to growth of CO2 concentrations in the atmosphere. Hansen’s scenarios were for different options for man-made emissions, not different rates of growth in ppm of CO2 in the air. Hansen was asked specifically about this when he testified before Congress, and he confirmed that scenario A predicted what would happen if GHG emissions continued on their “business as usual” exponential growth. The resulting increase in CO2 concentration in the atmosphere was, like temperatures, a result of the scenario, not part of what was assumed in the scenario.
“His projections for CO2 in 2016 were:
A 405.4ppm, B 400.5ppm, C 367.8
M-L data Oct 2015 398.3ppm, Oct 2016 401.6ppm
Not bad for a estimate made 30 years ago!”
No – it’s a lousy prediction. You’re illogically conflating his predictions of CO2 concentration in the atmosphere for ALL the emissions scenarios and trying to compare that entire range with what actually occurred. Read the passage of yours I just quoted more critically this time. The CO2 concentration in 2016 that actually resulted from the world continuing its exponential growth in CO2 (scenario A) was less than what Hansen thought it would be if CO2 emissions were held to linear instead of exponential growth. No reasonable analysis would call that “not bad.” If your bar for being “not a bad estimate” of actual CO2 growth is so low that hitting anywhere within the range of any of the three estimates is good enough, then what exactly was the point of differentiating CO2 concentrations for each scenario in the first place?
“As he stated at the time he expected that scenario B was “perhaps the most plausible of the three” and that scenario A “must eventually be on the high side of reality”, also that scenario A included some speculative, “crudely estimated trace gas trends” which the others did not.”
Stop taking quotes from Hansen’s paper out of context. With respect to scenario A, his only caveat was that, since it relied on continued exponential growth in CO2 emissions, it must”eventually” be on the high side of reality as we started running out of fossil fuels. Hansen’s vacillations between scenarios A and B related to the long term projections, not the short term projections. We clearly haven’t felt any limit on fossil fuel production in the last 30 years – inventories of fossil fuels are continually increasing, and again, the real world output most closely followed scenario A except for one major volcanic eruption, which even the climate alarmists admit would have only shown a transitory effect for about five years.
And even if you were to assume that Hansen’s’ statement about Scenario B being “perhaps” the most plausible (lovely weasel word, that) related not to the very long term projections but even to the short term temperature predictions, what does it matter? We now know that the actual growth in CO2 emissions – being by far the most important greenhouse gas considered by Hansen – met or exceeded what was considered by Hansen to be Scenario A. What Hansen considered to be the most likely emissions scenario in 1988, before he could have known what would happen, is not relevant to judging the accuracy of the prediction after the real world results have come in. You’re just trying to seize on this weasel language to support your revisionist history of Hansen’s predictions.
“an output of the scenario, not an input”
They may be an output of the scenario. But they are the input to the GCM, and the only forcing input suplied. Not emissions, or terms like “business as usual”. You can only assess the performance of the GCM in terms of the actual numbers it is given to work with. And they were as Phil describes.
If I’m reading the temperature annotations on this old graph correctly, are you showing that the peak of the current El Nino was 0.5 degrees C higher than the 1998 El Nino? That’s certainly not consistent with the RSS/UAH data, and seems larger than the (less accurate) land/ocean sets as well – and shows dramatic increase starting in some time around 2012 – does that make sense? I know it helps in trying to make your case, but you’re not providing needed information – for example, which “scenario” of Hansen’s actually happened?
” you showing that the peak of the current El Nino was 0.5 degrees C higher than the 1998 El Nino?”
Yes, that is what GISS says, and other surface indices.
http://data.giss.nasa.gov/gistemp/graphs/graph_data/Global_Mean_Estimates_based_on_Land_and_Ocean_Data/graph.png
I’ve discussed what scenario happened here:
” The only test that matters is what actually occurred. And the test of that are the actual GHG concentrations that he used, relative to what we now measure. The actual numbers are in files here. Scenario A, highest emissions, has 410 ppm in 2015. Scen B has 406, and Scen C has 369.5. The differences between A and B mainly lie elsewhere – B allowed for a volcano (much like Pinatubo), and of course there are other gases, including CFC’s, which were still being emitted in 1988, but not much now. Measured CO2 fell a little short of Scenarios A and B, and methane fell quite a lot short, as did CFCs. So overall, the actual scenario that unfolded was between B and C. “
There is a slight discrepancy with that GISS graph, in that I have shown 2016 to date, while GISS stops at 2015.
“In fact, Hansen was predicting surface air temperature. And his prediction has stood up very well.”
Yeah, if you go by that bastardized surface temperature chart, custom made to make the predictions look good.
Comparing data using a bogus chart just gives you bogus conclusions.
I’ve shown in the graph above that using unadjusted GHCN makes very little difference.
Nick wrote: “I’ve shown in the graph above that using unadjusted GHCN makes very little difference.”
Well, I don’t think you are using unadjusted data. See below.
http://www.dailywire.com/news/2071/most-comprehensive-assault-global-warming-ever-mike-van-biezen
“10. “Data adjustment” is used to continue the perception of global warming:
For the first several years of my research I relied on the climate data banks of NASA and GISS, two of the most prestigious scientific bodies of our country. After years of painstaking gathering of data, and relentless graphing of that data, I discovered that I was not looking at the originally gathered data, but data that had been “adjusted” for what was deemed “scientific reasons.” Unadjusted data is simply not available from these data banks.”
Would like to have your thoughts on this. And the thoughts of all the other people who use this data to do their work.
“Would like to have your thoughts on this.”
As far as Biezen is concerned, this is simply untrue:
“Unadjusted data is simply not available from these data banks. Fortunately I was able to find the original weather station data from over 7000 weather stations from around the world in the KNMI database. (Royal Dutch Meteorological Institute).”
He hasn’t looked. Unadjusted GHCN (qcu) is available here in the same directory as adjusted. That’s where KNMI (and most others) get it. And there is vastly more unadjusted data in GHCN daily.
As mentioned above, I use GHCN unadjusted to calculate a global index, with very little difference to GISS etc. I have just written a post here which traces through how AWS numbers posted by BoM every half hour are shown in real time, transmitted to publicly available WMO files (CLIMAT) and to GHCN unadjusted, all without change.
” Unadjusted data is simply not available from these data banks”
Well, for some reason, noone who uses these data banks wants to comment on the claim that they are not unadjusted data.
“Well, for some reason, noone who uses these data banks wants to comment on the claim that they are not unadjusted data.”
I comment, as linked above and elsewhere. Others may think the claims just too unsubstantiated (as they are). The thing is, if you really want to press this stuff, you need a demonstrated example. The data is all out there. Just find a case where you think data presented as unadjusted is not so. Then there is something to work on.
Ppm T T ppm
2014 2.13 0.69 0.84 2.13
2013 2.05 0.63 0.75 2.05
2012 2.65 0.58 0.64 2.65
2011 1.88 0.54 0.60 1.88
2010 2.42 0.66 0.76 2.42
2009 1.89 0.60 0.61 1.89
2008 1.60 0.51 0.50 1.60
2007 2.22 0.59 0.66 2.22
2006 1.76 0.60 0.57 1.76
2005 2.52 0.65 0.65 2.52
As an example Nick. More changes have been made since. Notice how the temperature was adjusted upwards from 2009 … and so on until I stopped at 1960. In a previous post I quoted the ppm for one year and the the response was ” where did you get that. That’s not what I have “… implying that any research I do is invalid by using incorrect data. Would you care to explain why temperatures were adjusted ? All data is from NOAA as posted.
“Would you care to explain why temperatures were adjusted ?”
What a mass of meaningless numbers! What on earth dataset are you citing. Reference? Link?
Nick wrote: I commented, as linked above and elsewhere.”
Sorry about that Nick. I see you did reply. It’s funny, I didn’t see any reply from you at the time I posted, even though it looks like you posted four hours before I did.
“Others may think the claims just too unsubstantiated (as they are). The thing is, if you really want to press this stuff, you need a demonstrated example.”
Maybe we need to get Mike van Biezen, the author of the article, to come over here and defend his claims. I’m thinking that might be interesting.
And his prediction has stood up very well…..
So you’re saying we no longer need to reduce CO2 levels?…..what his prediction was based on
Nick, GHCN temperatures are already adjusted by the time you get them to use Nick. Tell the truth for a change.
“Nick, GHCN temperatures are already adjusted by the time you get them”
Evidence? It’s quite untrue. GHCN unadjusted means just that.
NOAA is so corrupted that even its raw “data” can’t be trusted. Its flunkies have their thumbs on the the thermometers, as it were.
‘NOAA is so corrupted that even its raw “data” can’t be trusted.’
GHCN monthly data is transcribed directly from the WMO CLIMAT forms, which it posts as received from the national met organisations.
Nick,
So? Do you imagine that all the forms are filled out automatically by disinterested machines, or are there humans in the loop?
“all the forms are filled out automatically by disinterested machines”
Actually yes, and you cn trace it. Details here.
“And his prediction has stood up very well.”
Aren’t those NOAA/GISS “adjustments” just dandy 🙂
Fabrication at its worst.
Science is the argument, not the papers, Nick. You’ve refuted none of my analyses, not one.
I’ve also debated top climate modelers in my reviews, and have shown they’re widely incompetent. Maybe that should be wildly incompetent, because they apparently know nothing whatever about physical error analysis all the while purporting physical analysis.
Apparently, you’re in the same boat; also here.
Snark all you like, Nick. You’ve consistently lost the argument where the rubber actually meets the road.
Nick, can it really be true that you both know nothing at all about propagated uncertainty and are impervious to figuring it out?
Very hard to believe. And yet, evidence of its absence is right there before us. But, I admit, imperviousness is a non-unique solution to the problem of non-presence. Maybe there’s a different causal reason.
I sometimes think Mr. Stokes is getting paid. Causa erat pecunia.
Better than insanity. Sort of.
How are your papers going, Pat?
Science is on my side, not yours.
Nick Stokes: “Science is on my side, not yours.”
No, not really.
Janice, if Stokes is getting paid, good for him!!! We all know you aren’t getting paid so LMAO @ur momisugly U
@ur momisugly Stokes: Science is on Pat Frank’s side. Corrupt peer review is all you have.
Thanks for that endorsement of my honesty, Sham. No, indeed, I have not been corrupted by money. How good of you to point that out.
#(:))
Nick Stokes
December 3, 2016 at 5:26 pm
What science?
Science fiction is on your side. Science corrupted by politics.
And GIGO computer gaming.
Chimp: This thread is FULL of excellent comments by you. Completely unlike what “Chimp” posted recently. It is, I think, very possible an AGW troll is masquerading here as “Chimp.” Be on the look-out. And please do not take my sharp criticism of you recently as directed at YOU. It was at “him” or “her.”
Yes Janice, nothing better than a woman who gives it away for free!!!!
Janice,
I don’t know to what comments you refer. I’m not aware of anyone imitating me.
I’ve posted the same kinds of comments all along. But glad you like them.
“Nick Stokes December 3, 2016 at 5:26 pm
Science is on my side, not yours.”
I just sprayed wine all over my screen when I read that. Your best post EVAH! Can’t wait for your next, at least I will have time to put on my girdle.
“HENRYSatSHAMROCK@aol.com December 3, 2016 at 7:00 pm
Yes Janice, nothing better than a woman who gives it away for free!!!!”
Clearly you are not the sharpest tool in the shed…
“How are your papers going, Pat?
Science is on my side, not yours.”
Actually, I sure you must have noticed Nick – but “post-truth wins on here.
Some even burrow deep enough into the rabbit-hole to think that the raw station data is adjusted at point of measurement ….
“So? Do you imagine that all the forms are filled out automatically by disinterested machines, or are there humans in the loop?”
I ask you, where can anyone go in countering that sort of logic?
You may also have noticed that anyone from the science side with any professional expertise is treated with especial contempt.
Correction:
The is one who isn’t – Leif Svalgaard.
Just think how deep would the burrow be on those “It’s the Sun stupid” threads were it not for him.
HENRYSatSHAMROCK, if you were a little more intelligent, you’d be able to post really stupid comments instead of merely vulgar ones.
Nick writes
post modern “science” maybe.
Pat writes
Nick appears to be heavily invested in CFD modelling. Hence his appreciation for the GCMs. Nick, for your benefit, models are always wrong but sometimes useful and for the purposes you (probably) use them, they’re definitely useful. Instantaneous uses like modelling a wing’s performance or near instantaneous uses like weather forecasting. Fine.
However, for the purposes of 100 year projections, GCMs are not useful.
Nick, in spite of a constant increase of anthropogenic co2 increase if you look at the yearly increase in temperature and co2 ppm per year, co2 clearly follows temperature. All your chart produces is that there has been a very slight underlying warming trend and co2 follows. It is not certain that all of the resulting increase in co2 is anthropogenic . While it is to be expected that anthropogenic co2 is mixed with the natural, there is no way of knowing whether the total amount increase is a result of human input or entirely from natural sources based on increases in temperature. Referring to isotopic amounts has run into considerable doubt. Also, the assertion that co2 remains in the atmosphere for hundreds of years is also false. At the current rate of sinking, 100% of the co2 in the atmosphere would be reduced to 0 if, in fact the co2 were in balance and anthropogenic co2 was the only cause in increase, in less than 100 years and all anthropogenic co2 were stopped immediately. … and in the last year NOAA has both adjusted both the co2 record and temperature after it pointed out that co2 followed temperature. They have also done some other things to try to account for what can only be massive of amounts of anthropogenic co2 that remains unaccounted for. The co2 record itself is no longer an apples to apples comparison. In a previous argument with Isvalgaard, I didn’t answer his last statement on TSI. However, he knows as well I do that small difference in numbers have big results. The entire notion of SLR is predicated on warming of the oceans. It doesn’t take much to get the catastrophic rise that has been predicted. If that had in fact happened, no one here would be arguing except how to fix this problem. The heat is definitely not hiding in the ocean.
C/AGW has too many assumptions, and in any case it’s the best case scenario calculated for disaster based on those assumptions. Every single calculation was rounded up in favor of AGW, and every single mitigating factor was negatively reviewed and rounded down.
TSI is an assumption of variability over time, all of the amounts of where that energy goes is also an assumption. A difference in any direction causes entirely different results. My point about the instrumentation error and the math, from the decline, should mathematically put us in the beginnings of an ice age, per the math, not the actual. Yet, those numbers when produced back in 2001 match all of the other calculations. There is absolutely no way that could have happened unless it was contrived.
Unless you have a vested interest in AGW or just totally dense, this has to make sense to you. Arguing otherwise puts you in one of the two camps. Perhaps both.
If ‘co2 clearly follows temperature’, why did temperature lag behind co2 in UAH/RSS from 1998 – 2014 while that same co2 steadily rose over the period? How could co2 be rising but not temperature if co2 only follows temp? Co2 didn’t follow temperature then.
Co2 follows temperature the ppm per year clearly follow the temperature. Temperature did decline but there is an underlying warming trend. A slight one. Before NOAA started fixing the record, 1998 co2 ppm was 2.93 and temperature was 0.64 above normal for that year. 1999 temp was 0.46 above norm and co2 ppm declined to 0.93 . I graphed out every year from 1960 and every year co2 did the same thing, it followed. In spite of constant year over year increases. My point is that it’s somewhat warmer, and there is more co2. Whether it’s entirely from natural or anthropogenic sources, or some percentage is unknown. Only that co2 can not be causing deviations in temperature.
I am stating this outright, I’m using their data. Whether it’s right or not, is another issue. Even though NOAA has been adjusting the data, the pattern is still evident.
1994 1.91ppm 0.33c
1995 1.99ppm 0.45c
1996 1.25ppm 0.32c
1997 1.91ppm 0.52c
1998 2.93ppm 0.64c
1999 0.93ppm 0.46c
The trend lines and the slopes are the same. Co2 follows temperature. That’s not true for the years I presented, it’s true for as far back as I cared to go, 1960. There are people that can show co2 lags temperature in the past. The graph C/AGW has that shows total co2 amounts and yearly temperature anomolies is misleading. I’m saying co2 amounts are increasing because of temperature not because of anthropogenic co2. There would be no reason over a 5, 10, or 20 year period that co2 ppm would fluctuate with temperature in the face of constant year over year increases in production. It’s not as they have suggested a random variation. It is constant. The picture becomes even clearer when factoring in the size of the ever growing sinks, of which there is no possible explanation. According to C/AGW, the oceans were colder in 1960 than today, able to absorb more or less co2 ? And tropical forests, more or less in 1960 than today ? What reason could there be for today 1 and a half times more co2 is being sunk than the entire yearly amount than in 1965 ? And that’s the offical amount. The actual is probably much greater. The offical amount is 50%, I have anywhere from 68% to over 80%. You can do that too, mole amounts or weight per volume.
UAH/RSS both show a temperature decline in the LT from 1998-2014. Your meanderings still don’t explain why there was an almost 10% increase in atmospheric co2 during that same period while the temperature declined. According to your post “co2 clearly follows warming” and “co2 ppm clearly follow warming”, except obviously not.
Obviously you’re not looking at the same information in the same way. Did you graph it ? It becomes very apparent. Each and every year co2 followed temperature. According to the all, there has been no decline in temperature. Your ramblings seem to be a feeble attempt at discrediting this line of research in hopes that, ” the only thing left for temperature increase is co2 “. Do you think this hasn’t been done before ? And further, you tone isn’t one of interest, it’s condemnation which might lead to a pissing match of some sort, which I’m really not interested in.
LOL – so you claim that from 1998 – 2104 UAH/RSS lower troposphere temps rose equal to the almost 10% increase in atmospheric co2? Woodfortrees would even laugh at the odd postulation. You’re right tho, its not worth further deliberations about such a complete falsehood.
Calling it a falsehood and being one are two different things. The data speaks for itself, or did. From 1960 until 2015 co2 followed temperature. There is a third party involved and that is the interplay of cosmic rays. It is or was event in the record with the solar cycle and Ray activity in 1962 and 63. Belittling me won’t change those facts.
Do you know what this site is ? It’s a site where true believers become skeptics. Every year the educational system churns out another batch of I’ll informed, spoon feed useful idiots. And every year the tactics, 15 year old information, and arrogance with a different name appears. Some quickly see what wrong, and others take awhile. There are many here, that were once believers that have converted over. Do you know how many skeptics become believers in AGW ? If you could convince me, you could convince every skeptic here. The science is not with you on this. That’s why no one goes back to believing in AGW.
And I can and will defend my position that there has been an underlying warming trend and that warming trend along with cosmic ray activity influences co2 levels. There may be countervailing influences that I’m not aware of, but until so stated this stands.
Which by the way, there are a lot of ideas here to which have a great deal of merit. This is just one of many. How it all fits together is why we keep talking about. Among skeptics, the science is not settled.
UAH & RSS data from 1998 – 2014 easily disprove your ‘co2 clearly follows warming’ claim. And global atmospheric co2 rose steadily from 1945 thru 1975 yet there was no appreciable global warming then, so you don’t seem to have any sturdy data on that 1960 – 2015 time span either. So that also disproves the falsehood you claim of ‘co2 following’.
https://rishrac.files.wordpress.com/2016/07/scan0001.pdf
Its not going away. NOAA changed the data after the fact not before. And yes, I have studied it. Before NOAA started changing the data, peak to peak solar cycles coincide with co2 ppm per year lows and highs in an inverse relationship. Co2 follows temperature. And it is also influence by cosmic rays.
uhh, no thanks, not interested in any more of your gobbledygook. You still can’t explain UAH/RSS 1998-2014 or 1960-75 non warming, no sense going any further. I’m guessing 4chan and Alex Jones are your ‘go to’ sources for cosmic rays. Take care now.
And you can’t explain the sinks either. All I have to do is see whether anyone at NOAA is listening. Evidently they are, else they wouldn’t have bothered to change the numbers. I don’t pay much attention to the numbers your throwing around, I don’t trust them. Either you’re a die hard warmest with a vested interest or dumber than a box of rocks.
To you it’s rambling about nothing, to someone else it’s serious. I don’t think you have a clue what I’m talking about. It’s the co2 sinks. It seems you can’t do more than one equation in you head. Not only are the sinks a problem… you know suppose the sinks didn’t grow at all. And then there is the missing co2, production minus the 50 % that is suppose to have been sunk. Then that leaves, let’s cherry pick 2011, 7.5 BMT that’s unaccounted for, on top on the sink taking out a total of 19 BMT, suppose the natural sink is static at 6BMT as it was in 1965, then when you are looking at the co2 ppm with temperature … but then you have no idea what I’m talking about.
I’m prepared to believe that Hanson really does believe in global warming. I believe this because he was one of the few to recommend nuclear as the best means of fighting it.
Most of the other big supporters seemed more interested in promoting a social agenda, and one of the things they could not stand was Nuclear. It had to be their version of renewable or the highway.
You know, if the Greens/Alarmists *really* wanted to do anything to save the planet from a runaway greenhouse, then the solution to their problem is to wholeheartedly support powering the world economies with nuclear power.
Nuclear power will satisfy the Greens/alarmists’ desire to lower CO2 emmissions, and the skeptic side will support nuclear power because it is one of the best alternatives.
If the Greens/Alarmists can get over their revulsion to nuclear power, we can all get on the same page.
This will never happen with wind and solar. Wind and solar are deadends and the sooner people realize it, the sooner we can start doing something that will actually make our lives better.
Exactly!
Well said!
Problem is the propagators of environazisism don’t care about “saving” the “environment”, all they care about is controlling people, punishing people, subjugating people. They simply use their hordes of delusional followers who DO actually care about enviromentalism to push their socialistic political ideology.
Maybe somebody has caught this but Weather Underground, who has decent weather if you ignore the hype, went quiet after the election, not even posting new nature pictures. They have now posted a link about a new charity for the injured.
https://www.wunderground.com/blog/JeffMasters/comment.html?entrynum=3516
..The “Trump Effect” is getting Yuuuge !!….Finally, sanity may be returning to this area of science…As for Hansen, he has lost all credibility…
I should note the request to make a “tax deductible donation to the nonprofit Climate Science Legal Defense Fund. “
With the new administration in place, those guys will likely need a huge “Climate Science Legal Defense Fund”. Mark Steyn’s countersuit isn’t going to be the only legal tangle they get in – I’m wondering if there are any emails left on the EPA servers. I’m guessing that a lot of EPA folks wind up on disability from carpal tunnel syndrome – too many hits on the “delete” button.
I got audited by the IRS 3 times under Obama, and many Tea Party Groups were harassed, and this group gets tax exempt status? Trump definitely needs to look into IRS treatment equity.
It would be interesting for you to make a claim to the Climate Fund. Since you are probably not a member of the 97% consensus that WU refers to that has been injured, you probably would not be covered. Tyranny of the minority?
Hanson. Obviously smart enough to realize which side of the bread the butter is on!
When Hanson speaks the world sleeps . Does this mean the Arctic won’t be ice free for a few more years ?
The climate alarmists are toning down their BS because they have no credibility and they are now
going to be held to account for it .
Whimper Whimper so long Hanson . The next climb down will be Gore , Nasa and the little pack of AG lites
of Who Knew fame .
Like Australia ,that is no longer buying the science is settled crap , the so called USA climate scientists who can’t defend their pronouncements are going to see their funding vanish and their reputations exposed to direct sun light .
A strong La Nina will crush their hopes. It’s a cold, cruel world, and getting colder.
James Hansen Lecturing on Climate to Millenials
(youtube)
(Charlie Brown is Hansen’s agent…. only because he thought Hansen was his dad’s boss….. (Hansen, a close relative of Lucy the football sc@mmer, lied to him, shock!)).
zzzzzzzzzzzzzzzzzzzzzzzzzzzzzz
Let’s all remember Hansen is the godfather of catastrophic global warming.
At the beginning, there was Hansen and Manabe. Manabe thought doubled CO2 might provide up to 2.0C of warming. But Hansen was the 4.5C guy, and somehow, he got Manabe banned out of the movement in the early 1980s. I mean Manabe was completely shut out afterward.
And then when Hansen teamed up with Michael Mann and saw that screwing around the data provided big benefits for funding and reputation after Michael Mann’s 1998 hockey stick, he realized that they could get away with playing with the data and exaggeration was the way to go.
Since then, it has been nothing but finding ways to make a tiny warming trend turn into a big warming trend and using dirty, dirty tricks to keep the pressure on and the funding flowing in.
He was the godfather and he should pay a very big price for what he has down.
this is the latest chart hansen got a look at, right?
it’s Algor Mortis now…lol (what an awesome pun, eh?)
https://en.wikipedia.org/wiki/Algor_mortis#/media/File:Glaister_equation.svg
I quite agree, but still I feel offended so see Hansen mentioned in the same sentence as Syukuro Manabe, one of the most important scientist in atmospheric physics ever!