By Sebastian Luening, Frank Bosse and Fritz Vahrenholt
Introduction
On 14th November 2016 Stefan Rahmstorf (“stefan”) of the Potsdam Institute for Climate Impact Research (PIK) published on the climate blog Realclimate an article entitled „Record heat despite a cold sun”. In this article he discusses a temperature prognosis which we first published 2012 in the book “Die kalte Sonne”. An English translation of the book came out 2013 under the title “The Neglected Sun”. In his blog post, Stefan Rahmstorf attempts to demonstrate that the solar development does not match with the temperature evolution and hence has only a negligible effect on climate. Furthermore, he argues that our temperature prognosis has essentially failed.
First of all, it is good to see that our work is being considered by a prominent climate scientist and by this has re-entered the public climate debate. Nevertheless, we disagree with the conclusions drawn by Stefan Rahmstorf and would like to take the opportunity to comment on the issues raised in his article. To this end, we address the following points:
· Is solar development really incompatible with temperature development?
· Does it make sense to evaluate a prognosis only a few years after it was published?
· How did we arrive at our prognosis and why do we think it will still be successful?
· How likely are high climate sensitivity scenarios?
1) Is solar development really incompatible with temperature development?
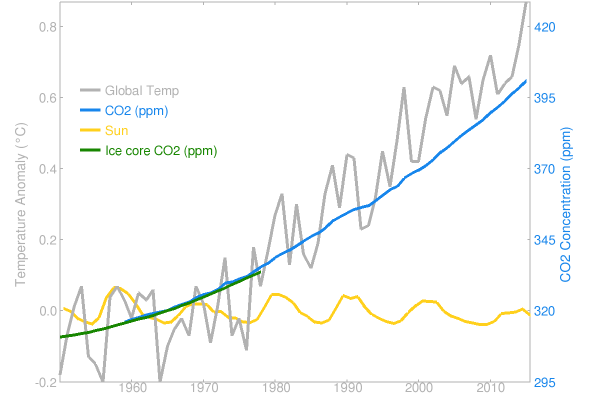
In his starting figure, Stefan Rahmstorf shows the time evolution of global temperature, CO2 concentration and solar activity from 1950 onwards. Unfortunately, the first part of the 20th century is not shown which would have offered interesting insights into possible climate driving mechanisms. In Figure 1 we have extended the graph to 1900 and illustrate solar activity based on a total solar irradiance (TSI) reconstruction by Steinhilber et al. (2009) based on cosmogenic radionuclide 10Be measured in ice cores. The rapid warming of the first half of the 20th century coincides well with a steady increase in solar activity. Attribution of this warming therefore is not trivial as also CO2 increased contemporaneously.
In the 1960s and 70s temperatures dropped, corresponding with a fall in solar activity while CO2 continued to climb upwards. Recent research suggests that the negative phase of 60 year ocean cycles may have been the main reason for this colder interval (Gervais, 2016; Meehl et al., 2016; Tung and Zhou, 2013). Solar activity picked up again in the 1980s/90s reaching some of the highest values, making the second half of the 20th century one of the most active solar periods of the past 10,000 years (Solanki et al., 2004).
Solar activity began to gradually decline in subsequent 11-year solar cycles in the 2000s and 2010s, as marked by the downward trend in the TSI curve by Steinhilber et al. (2009) (Fig. 1). Notably, the reduced solar activity roughly coincides with the so-called warming hiatus or slowdown that commenced around 1998. Again, ocean cycles may have played a major role in initially boosting and eventually terminating the phase of rapid warming that took place 1977-1998 (Meehl et al., 2016).
Due to the inertia of the climate system, time lags of a few decades with regards to external triggers have to be expected. The drop in solar activity during the early 21st century may therefore be only fully implemented in global temperatures in the coming years to decades, if solar activity plays a more important role than currently assumed by the IPCC. Stefan Rahmstorf’s solar representation misses the important ramp up to the exceptionally high solar plateau in the second half of the 20th century. Looking at the interval 1898 to 1997, solar activity (sensu Steinhilber et al. 2009) shows an even better (R=0.78) correlation with temperature than CO2 (R=0.75).

Figure 1: Time evolution of global temperature (GISS), CO2 concentration and solar activity (Steinhilber et al. 2009).
2) Does it make sense to evaluate a prognosis only a few years after it was published?
Climate change temperature prognoses refer to mid- and long-term developments, and do not intend to cover effects related to fast-paced El Nino, La Nina or volcanic events. It therefore does not make sense to evaluate a prognosis only four years after it was published, especially not during an El Nino year such as 2015/16. Apart from this, the temperature dataset chosen by Stefan Rahmstorf and its way of smoothing are debatable.
The GISS data have experienced repeated large administrative changes and therefore are considered by part of the climate research community as unstable (Fig. 2). Furthermore, Rahmstorf chooses averages over a 12 months period which unfortunately further emphasizes the El Nino peak. A better choice might have been monthly temperature data which by the time when Rahmstorf’s blog article went online in mid November 2014 had already returned down to values of the pre-El Nino temperature plateau. In terms of smoothing, a longer-term moving average would make better sense, e.g. 37 months, which helps to reduce some of the El Nino and La Nina short-term temperature effects. In the case of a 37 month smooth, the last smoothed data point is from mid 2015, shortening the reality-test interval of the prognosis down to merely three years.

Figure 2: Diagram showing the adjustments made since May 2008 by the NASA Goddard Institute for Space Studies (GISS) in anomaly values for the months January 1910 and January 2000. Graph from Climate4You.com (October 2016 newsletter).
In Figure 3 we have plotted the global RSS satellite temperature data for the period 1997-2016 and compared it with the prognosis of Vahrenholt & Lüning (2012). Since 2012 the 37-months RSS running mean has stayed quite well within the lower and upper limits of the prognosis. Short-term deviations outside the range during El Ninos and La Ninas are acceptable, as the dynamics of the temperature development have already exceeded the narrow range during previous occasions, e.g. during the 1998 El Nino (Fig. 3). The monthly RSS values in the second half of 2016 have sharply declined and have now re-entered the upper limit of the prognosis.

Fig. 3: Measurements of global temperature (RSS, monthly values, last data point October 2016) compared to the forecast for global temperature til 2030 by Vahrenholt & Lüning (2012: Figure 73). Thick line represents 37 months moving average.
The same comparison has also been carried out for the GISS surface temperature dataset (Fig. 4). In contrast to the satellite data, the GISS temperatures plot above the prognosed range. It will be interesting to see in the coming years, if the temperatures return into the corridor of the prognosis and if future administrative changes to the dataset by GISS will reduce the amount of perceived warming, possibly bringing better alignment with the satellite datasets.

Fig. 4: Measurements of global temperature (GISS, monthly values, last data point October 2016) compared to the forecast for global temperature til 2030 by Vahrenholt & Lüning (2012: Figure 73). Thick line represents 37 months moving average.
We take the opportunity to present additional temperature prognoses and their comparison with the measured temperature development. Meaningful comparisons can be carried out by studying climate scenarios that have been published at least two decades ago. First, we take a look at three temperature curves by Hansen et al. (1988) (Fig. 5). Scenarios B and C reflect cases in which trace gas growth rates would have been mildly reduced after 1988 and kept constant after 2000 (Scenario B), and drastically reduced 1990-2000 with zero emissions thereafter (Scenario C). The two cases have to be discarded, because emissions have not developed according to these scenarios, as we know today. Therefore scenario A captures the real evolution of emissions best, representing a 1.5% Increase of trace gas emissions per year, corresponding to growth rates typical of the 1970s and 80s. In terms of temperatures, however, scenario A of Hansen et al. (1988) has drastically overestimated warming by more than double the real amount.

Fig. 5. Measurements of global temperature (GISS, yearly average values) compared to the forecast for global temperature by Hansen et al. (1988). Description of scenarios see text.
Another temperature prognosis suitable for evaluation stems from the First Assessment Report (FAR) of the Intergovernmental Panel on Climate Change (IPCC) that was published in 1990. Since publication, 26 years of new data have been observed. The comparison shows that measured temperatures have followed a path at the lower end of the FAR climate scenarios (Fig. 6). Notably, the extreme upper warming forecast has turned out to be incorrect. A major factor in these scenarios plays the large range of 1.5-4.5°C of warming per CO2 doubling proposed by the IPCC FAR for the CO2 equilibrium climate sensitivity (ECS). The moderate warming that tracks the path at the lower end of the FAR spectrum may suggest that climate sensitivity is equally in the lower part of the IPCC range. Notably, an ECS scenario of 1.5°C was also presented by Vahrenholt & Lüning (2012).

Fig. 6. Measurements of global temperature (RSS, black curve) compared to the extreme lower (green curve) and upper (red curve) forecasts for global temperature by the IPCC First Assessment Report (1990).
3) How did we arrive at our prognosis and why are we confident that it will still be successful?
Our prognosis in Vahrenholt & Lüning (2012) considered three main climate drivers, namely an anthropogenic CO2 increase, multidecadal ocean cycles and solar activity changes.
CO2. In the years following our publication, a general shift towards lower CO2 climate sensitivities has occurred in the research community (Lewis and Curry, 2015; Loehle, 2014; Masters, 2014; Mauritsen and Stevens, 2015; Skeie et al., 2014; Spencer and Braswell, 2014; von der Heydt et al., 2014). The reduction is mostly based on re-evaluations related to the role of ocean cycles and the limited cooling potential of aerosols. Notably, reconsidered solar effects on climate have not yet been implemented and may lead to additional changes in the climate sensitivity value. In its latest report from 2013, the IPCC openly stated that at present it is not in a position to give a ‘best estimate’ for equilibrium climate sensitivity because of a “lack of agreement on values across assessed lines of evidence and studies”. To a certain extent, the re-considered warming potential of CO2 validates our prognosis approach in Vahrenholt & Lüning (2012) in which we used a climate sensitivity at the lower end of the current IPCC range of 1.5-4.5°C per CO2 doubling (IPCC, 2013).
Multidecadal Ocean Cycles. Since publication of our prognosis in 2012, the understanding of multidecadal ocean cycles and their systematic influence on global climatic has seen a major breakthrough. While previously modellers viewed the ocean cycles mostly as unpredictable noise, the cycles are now finally accepted to play a fundamental role in cooling or warming global climate. The Pacific Decadal Oscillation (PDO) and Atlantic Multidecadal Oscillation (AMO) have markedly increased global warming during 1860-1880, 1910-1940 and 1975-2000. In contrast, the ocean cycles slowed warming and cooled during 1880-1910, 1940-1975 and since 2000 (e.g. Han et al., 2016; Steinman et al., 2015; Tung and Zhou, 2013; Wyatt and Curry, 2014).
In the past, PDO peak plateaus typically triggered accelerated warming. Following the El Nino in 1998, the PDO has started its long-term decline, interrupted only by short-term rises, e.g. related to the recent 2015/16 El Nino (Fig. 7). The PDO climb down since 1998 may be the key reason for the slowdown in global warming since then. Based on an empirical average cycle period of 60 years, the PDO will most likely be in a general cooling stage during the coming two decades or so.

Fig. 7. Phases of the PDO ocean cycle Index compared to fluctuations in the general 20th/21st warming trend (monthly GISS data).
The AMO lags the PDO by about one and a half decades and started its decline only recently in 2015 (Fig. 8). The AMO cooling coupled with PDO cooling will turn the majority of the ocean cycle system into cold mode until the 2030s by when ocean cycles gradually turn into warm mode again.

Fig. 8. Atlantic Multidecadal Oscillation (AMO). From KNMI Climate Explorer. Last data point October 2016.
Solar Activity Changes. A great number of studies have demonstrated that solar activity has played a major role in climate during pre-industrial times (e.g. Hernández-Almeida et al., 2015; Holland et al., 2014; Ojala et al., 2015). On a Holocene scale of the past 10,000 years, solar-forced millennial-scale climate variability is a globally well-established Holocene phenomenon and has been described from all oceans and continents (Lüning and Vahrenholt, 2016). Solar-driven climate cycles are known from upper, middle and lower geographical latitudes, encompassing all climate zones, from the Arctic to the tropics. It is plausible to assume that the long-lasting connection between solar activity changes and climate is still active today.
Most solar physicists agree that we are heading towards a solar minimum in the first third or first half of this century (e.g. Ahluwalia, 2014; Lewis and Curry, 2015; Sánchez-Sesma, 2016; Skeie et al., 2014; Spencer and Braswell, 2014; Tlatov, 2015; Velasco Herrera et al., 2015; Zolotova and Ponyavin, 2014). In the past, solar minima have been commonly been associated with significant climate cooling, therefore it may be reasonable to expect a similar temperature effect in modern times for the coming decades.
How likely are high climate sensitivity scenarios?
In his blogpost at Realclimate, Stefan Rahmstorf cites a recent paper by Friedrich et al. (2016) in support of high climate sensitivities and a strong CO2 warming effect. The paper proposes massive anthropogenic warming of 5-7°C until the year 2100. This result is highly surprising because comparisons of modelled and measured temperatures favour rather lower climate sensitivity scenarios (see above). Also Brown et al. (2015) demonstrated that climate sensitivities in the upper part of the IPCC range are rather unlikely because they do not match with the observed recent temperature development, therefore worst case scenarios as envisaged e.g. by Friedrich et al. (2016) should be discarded.
In a recent post-publication review, James Annan demonstrated that the climate sensitivities proposed by Friedrich et al. (2016) grossly overestimate measured global warming (figure with Annan’s comparison here). Our own analysis confirms Annan’s results. We have digitized the key figure of Friedrich et al. (2016) and compared the output of the paper with the observations (Fig. 9). We used the ENSO-, solar- and volcano-adjusted global mean surface temperature (GMST) of Grant Foster (“Tamino”) since 1951 for four records (GISS, HadCRUT4, Cowtan/Way and Berkeley Earth). The comparison shows that the warming trend of Friedrich et al. is twice as high as the trend slopes of the observed GMST.
The calculated transient climate response (TCR) from the observations is 1.35°C per CO2-doubling, while the calculated TCR of Friedrich et al. amounts to 2.7°C per CO2-doubling. In a comment at James Annans Blog Nicholas Lewis determined an equilibrium climate sensitivity (ECS) of only 45% of the estimated values in the paper when using better established forcing data and GMST variances between Last Glacial Maximum and pre- industrial levels from recent studies in the literature.

Fig. 9. Model output temperatures from Friedrich et al. (2016) (red curve) compared to the observed adjusted measured temperature datasets of “Tamino”. Our prediction (Vahrenholt & Lüning 2012) is marked in brown. Note its small deviation to the observed temperatures in contrast to the large deviation of the red curve of Friedrich et al. (2016) which Rahmstorf cites as “sensitivity of global temperature to CO2 is independently confirmed by paleoclimatic data”
How did Friedrich et al. (2016) arrive at their conclusions which do not seem to hold up to reality calibration? The basis of their calculation is formed by temperature and CO2 data for the last nearly 800,000 years, covering several glacial and inter-glacial periods. Closer inspection shows that the authors seem to have overlooked that CO2 increases typically lag temperature rises by a few hundred years (Ahn et al., 2012; Monnin et al., 2001; Pedro et al., 2012; Stott et al., 2007) by way of CO2 outgassing from the warming oceans due to reduced ability to hold CO2 (Campos et al., 2016; Schmitt et al., 2012), making it complicated to attribute large parts of the warming to a primary carbon dioxide effect during Pleistocene times. Notably, the Friedrich et al. dataset has only a resolution of 1000 years which is insufficient to identify and discuss this time lag effect. In addition, James Annan discusses problems with the temperature database used by Friedrich et al. (2016). Summed up, the reasons for the exaggerated CO2 climate sensitivities of Friedrich et al (2016) may be found in incorrect attribution of warming, partial mix-up of cause and effect and choice of temperature reconstructions.
Conclusions
· Pre-industrial and 20th century data suggests that solar activity changes are a credible driver for climate change and require greater attention.
· While it is too early to judge our climate prognosis from 2012, it is essentially still well on track when eliminating short-term El Nino and La Nina effects.
· Comparisons of prognoses dating from 1988 and 1990 with subsequently observed data indicate that CO2 climate sensitivities are likely at the lower end of the spectrum proposed by the IPCC. Scenarios favoring high climate sensitivities significantly overshoot warming when compared to the real temperature development.
· Both Pacific and Atlantic ocean cycles have now entered into the multi-decadal cooling mode. Furthermore, also solar activity is expected to enter a major minimum phase. For the upcoming two decades it is therefore expected that natural climate drivers will contribute cooling to the climate system which may not be fully compensated by anthropogenic warming related to greenhouse gases.
· The climate system has arrived at an important crossroad at which it will soon become clear if the attribution of anthropogenic vs. natural drivers to 20th century warming has been quantitatively correct. It is expected that the coming 5-10 years will bring clarity to this question. We call on all parties of the climate discussion to open-mindedly engage in this critical phase, weighing the arguments and data for and against each other fairly and transparently, regardless of personal backgrounds, affiliations, previous convictions and individual preferences.
References
Ahluwalia, H. S., 2014, Sunspot activity and cosmic ray modulation at 1 a.u. for 1900–2013: Advances in Space Research, v. 54, no. 8, p. 1704-1716.
Ahn, J., Brook, E. J., Schmittner, A., and Kreutz, K., 2012, Abrupt change in atmospheric CO2 during the last ice age: Geophys. Res. Lett., v. 39, no. 18, p. L18711.
Brown, P. T., Li, W., Cordero, E. C., and Mauget, S. A., 2015, Comparing the model-simulated global warming signal to observations using empirical estimates of unforced noise: Scientific Reports, v. 5, p. 9957.
Campos, M. C., Chiessi, C. M., Voigt, I., Piola, A. R., Kuhnert, H., and Mulitza, S., 2016, Glacial δ13C decreases in the western South Atlantic forced by millennial changes in Southern Ocean ventilation: Clim. Past Discuss., v. 2016, p. 1-22.
Friedrich, T., Timmermann, A., Tigchelaar, M., Elison Timm, O., and Ganopolski, A., 2016, Nonlinear climate sensitivity and its implications for future greenhouse warming: Science Advances, v. 2, no. 11.
Gervais, F., 2016, Anthropogenic CO2 warming challenged by 60-year cycle: Earth-Science Reviews, v. 155, p. 129-135.
Han, Z., Luo, F., Li, S., Gao, Y., Furevik, T., and Svendsen, L., 2016, Simulation by CMIP5 models of the atlantic multidecadal oscillation and its climate impacts: Advances in Atmospheric Sciences, v. 33, no. 12, p. 1329-1342.
Hansen, J., Fung, I., Lacis, A., Rind, D., Lebedeff, S., Ruedy, R., Russell, G., and Stone, P., 1988, Global climate changes as forecast by Goddard Institute for Space Studies three-dimensional model: Journal of Geophysical Research: Atmospheres, v. 93, no. D8, p. 9341-9364.
Hernández-Almeida, I., Grosjean, M., Przybylak, R., and Tylmann, W., 2015, A chrysophyte-based quantitative reconstruction of winter severity from varved lake sediments in NE Poland during the past millennium and its relationship to natural climate variability: Quaternary Science Reviews, v. 122, p. 74-88.
Holland, H. A., Schöne, B. R., Lipowsky, C., and Esper, J., 2014, Decadal climate variability of the North Sea during the last millennium reconstructed from bivalve shells (Arctica islandica): The Holocene, v. 24, no. 7, p. 771-786.
IPCC, 1990, First Assessment Report http://www.ipcc.ch/publications_and_data/publications_and_data_reports.shtml.
-, 2013, Climate Change 2013: The Physical Science Basis. Contribution of Working Group I to the Fifth Assessment Report of the Intergovernmental Panel on Climate Change, Cambridge, United Kingdom and New York, NY, USA, Cambridge University Press, 1535 p.:
Lewis, N., and Curry, J. A., 2015, The implications for climate sensitivity of AR5 forcing and heat uptake estimates: Climate Dynamics, v. 45, no. 3-4, p. 1009-1023.
Loehle, C., 2014, A minimal model for estimating climate sensitivity: Ecological Modelling, v. 276, p. 80-84.
Lüning, S., and Vahrenholt, F., 2016, Chapter 16 – The Sun’s Role in Climate A2 – Easterbrook, Don J, Evidence-Based Climate Science (Second Edition), Elsevier, p. 283-305.
Masters, T., 2014, Observational estimate of climate sensitivity from changes in the rate of ocean heat uptake and comparison to CMIP5 models: Climate Dynamics, v. 42, no. 7-8, p. 2173-2181.
Mauritsen, T., and Stevens, B., 2015, Missing iris effect as a possible cause of muted hydrological change and high climate sensitivity in models: Nature Geosci, v. 8, no. 5, p. 346-351.
Meehl, G. A., Hu, A., Santer, B. D., and Xie, S.-P., 2016, Contribution of the Interdecadal Pacific Oscillation to twentieth-century global surface temperature trends: Nature Clim. Change, v. 6, no. 11, p. 1005-1008.
Monnin, E., Indermühle, A., Dällenbach, A., Flückiger, J., Stauffer, B., Stocker, T. F., Raynaud, D., and Barnola, J.-M., 2001, Atmospheric CO2 Concentrations over the Last Glacial Termination: Science, v. 291, p. 112-114.
Ojala, A. E. K., Launonen, I., Holmström, L., and Tiljander, M., 2015, Effects of solar forcing and North Atlantic oscillation on the climate of continental Scandinavia during the Holocene: Quaternary Science Reviews, v. 112, p. 153-171.
Pedro, J. B., Rasmussen, S. O., and van Ommen, T. D., 2012, Tightened constraints on the time-lag between Antarctic temperature and CO2 during the last deglaciation: Climate of the Past, v. 8, p. 1213-1221.
Sánchez-Sesma, J., 2016, Evidence of cosmic recurrent and lagged millennia-scale patterns and consequent forecasts: multi-scale responses of solar activity (SA) to planetary gravitational forcing (PGF): Earth Syst. Dynam., v. 7, no. 3, p. 583-595.
Schmitt, J., Schneider, R., Elsig, J., Leuenberger, D., Lourantou, A., Chappellaz, J., Köhler, P., Joos, F., Stocker, T. F., Leuenberger, M., and Fischer, H., 2012, Carbon Isotope Constraints on the Deglacial CO2 Rise from Ice Cores: Science, v. 336, no. 6082, p. 711-714.
Skeie, R. B., Berntsen, T., Aldrin, M., Holden, M., and Myhre, G., 2014, A lower and more constrained estimate of climate sensitivity using updated observations and detailed radiative forcing time series: Earth Syst. Dynam., v. 5, no. 1, p. 139-175.
Solanki, S. K., Usoskin, I. G., Kromer, B., Schüssler, M., and Beer, J., 2004, Unusual activity of the Sun during recent decades compared to the previous 11,000 years: Nature, v. 431, p. 1084-1087.
Spencer, R., and Braswell, W., 2014, The role of ENSO in global ocean temperature changes during 1955–2011 simulated with a 1D climate model: Asia-Pacific Journal of Atmospheric Sciences, v. 50, no. 2, p. 229-237.
Steinhilber, F., Beer, J., and Fröhlich, C., 2009, Total solar irradiance during the Holocene: Geophysical Research Letters, v. 36, no. L19704.
Steinman, B. A., Mann, M. E., and Miller, S. K., 2015, Atlantic and Pacific multidecadal oscillations and Northern Hemisphere temperatures: Science, v. 347, no. 6225, p. 988-991.
Stott, L., Timmermann, A., and Thunell, R., 2007, Southern Hemisphere and Deep-Sea Warming Led Deglacial Atmospheric CO2 Rise and Tropical Warming: Science, v. 318, no. 5849, p. 435-438.
Tlatov, A. G., 2015, The change of the solar cyclicity mode: Advances in Space Research, v. 55, no. 3, p. 851-856.
Tung, K.-K., and Zhou, J., 2013, Using data to attribute episodes of warming and cooling in instrumental records: Proceedings of the National Academy of Sciences, v. 110, no. 6, p. 2058-2063.
Vahrenholt, F., and Lüning, S., 2012, Die kalte Sonne, Hamburg, Hoffmann und Campe.
Velasco Herrera, V. M., Mendoza, B., and Velasco Herrera, G., 2015, Reconstruction and prediction of the total solar irradiance: From the Medieval Warm Period to the 21st century: New Astronomy, v. 34, p. 221-233.
von der Heydt, A. S., Köhler, P., van de Wal, R. S. W., and Dijkstra, H. A., 2014, On the state dependency of fast feedback processes in (paleo) climate sensitivity: Geophysical Research Letters, v. 41, no. 18, p. 6484-6492.
Wyatt, M. G., and Curry, J. A., 2014, Role for Eurasian Arctic shelf sea ice in a secularly varying hemispheric climate signal during the 20th century: Climate Dynamics, v. 42, no. 9, p. 2763-2782.
Zolotova, N. V., and Ponyavin, D. I., 2014, Is the new Grand minimum in progress?: Journal of Geophysical Research: Space Physics, v. 119, no. 5, p. 3281-3285.
There is no global temperature. Which means this whole thing is moot.
It’s the usual underspecified model problem with insufficient numbers of turning points.
For the record, I asked Stefan Rahmstorf to comment or refute the paper of Christy et al that does not find a statistically significant warming due to CO2 since 1959
https://thsresearch.files.wordpress.com/2016/09/wwww-ths-rr-091716.pdf
After two weeks, still no word from Stefan. Do you concede Stefan?
This seems like something to review every 5 years or so. Now is not really too soon for a first review. The unpredicted El Nino warming would seem to cast doubt on the prediction. Next up: 2021.
Sebastian Luening November 28, 2016 at 10:58
Thanks, Sebastion, appreciated.
There is an old expression that “The exception proves the rule.” Most people don’t understand that “proves” is used in the sense of a “proving ground”, which is a testing ground. The expression means “The exception tests the rule” … and in the case of the graph, it fails the test.
More to the point, you are telling us that the reason we should trust your claims is because we cannot trust the data you used in your main graphic … Ouroboros wept at the beautiful circularity of that argument.
Only if you do NOT include your very necessary claim of a multi-decadal lag …
What on earth does that mean? Whatever link MIGHT exist between small sunspot related variations and climate would have to operate on all time scales.
That’s just handwaving, nowhere near true. If you shift your yellow line three decades to the right to show the lag, your claimed correlation of 0.78 for the pre-1987 data goes in the toilet.
So?
Whoa, whoa. You’ve been saying all along that solar runs the show. Now, some vague undefined entity called “ocean cycles” is running the show. Did I mess the coup d’etat?
Again, this is handwaving
NO, NO, NO!!! You are the one postulating mechanisms like “feedbacks” and “multi-decadal lags” and “amplification mechanisms” and “long-term solar cycles” for which you have not presented any explanation. I’ve not asked for a mechanism. I just asked for you to define what mechanisms YOU are claiming are at work.
As to whether I “believe the solar-climate link”, it’s not a question of belief. A few years ago I started researching the purported link between the solar variations of the sunspot cycles and the climate. To date I have not seen any solid evidence that the sunspot cycles can be seen anywhere in the surface climate datasets, despite looking at a couple dozen of what people assured me were very solid studies.
Indeed, I’ve repeatedly asked people who think such a solar-climate exists to send me TWO LINKS, one to the best study establishing the purported connections, and the other to the data used in the study. This generally has a very curious effect on people—instead of just providing the links, they come up with the most ridiculously ingenious excuses you ever heard for NOT sending the links … it’s amazing to watch them shuck and jive trying to explain why they won’t put their ideas to the test.
In any case, you are more than welcome to demonstrate the existence of your claimed sun-climate connection with two links …
I don’t insist on any such thing, that is a total fantasy on your part. All I’ve ever asked for is EVIDENCE that the purported connection between some climate variable and small solar variations actually exists. If I ever get that evidence, we can talk about mechanisms. Until then, such discussions are meaningless.
Mmm … not easy in Excel, that’s one of the reasons I do my work in R.
The same to you, thanks for your response.
w.
PS: I found this claim astounding:
No, we don’t “all know” that. In fact, other than rising in the East, nobody knows what the sun will be doing from “the 2010s” onwards …
Willis – Apparently you gave up too quickly in searching for a connection between sunspots and climate. The key is perceiving sunspots as a proxy for the RATE that energy is retained by the planet. Because the planet energy can go up or down, there must be an average SSN above which the planet warms and below which the planet cools. SSN anomaly is the value above or below the average. The proxy times the time-integral of the SSN anomalies divided by the effective thermal capacitance gives the contribution of the sun to average global temperature (AGT). Combining this with a simple approximation of the net effect of all ocean cycles on the planet and the growing influence of the rising water vapor (prompted by your work) results in a 98% match with measured AGT (HadCRUT4).
there must be an average SSN above which the planet warms and below which the planet cools
The Sun always warms the Earth…
yet the earth experiences variance in temperature. that is, it gets warmer, and cooler.
sometimes its cooling.
Yes, when the solar output is falling the Earth is cooling, but when the solar output is again increasing the Earth is warming.
Leif – “when the solar output is falling the Earth is cooling” Not until the solar output drops below that required for constant temperature. If the solar output is above that for constant earth temperature, the solar output could be dropping but still be high enough to cause the temperature of the earth to be increasing. This is readily understood when you realize that solar output is a forcing and the temperature of the planet responds to the time-integral of the forcing.
Not until the solar output drops below that required for constant temperature.
No, that is nonsense. The Earth does not ‘strive’ for a constant temperature. It responds all the time to the changing input [perhaps with a small lag]. The ‘time-integral’ idea is an artificial construct and not how things work.
Leif – You should know better. This is trivial for an engineer who understands heat transfer. Calling it a lag demonstrates a lack of understanding.
I mentioned ‘lag’ because many people of your persuasion seem to like that to explain everything [invoking an appropriate lag]. But if you don’t like that, the more the better.
Now, if you look at temperatures [e.g. in boreholes] at depth, you find that their variations ‘lag’ behind the heat input at the top. [OK so far?] while their amplitude decreases. But the surface temperature is hardly driven by the deep layers, so are not the integral over centuries.
The idea of integrating doesn’t work. For one, the integral over deviations from the mean is always zero [by definition of the mean], so you have to posit some other value to measure the deviations from. This makes that value a free parameter, that you can vary until things fit the best, but that is just plain curve-fitting.
Other free parameters are the length of the integral interval and the start time. So you have plenty of vaiables to juggle, but in the end it is just curve-fitting with little physical content and zip predictive power.
Leif – OK but IMO we still have somewhat of a disconnect. I’m familiar with the borehole thing you described and how a fluctuating forcing causes temperature waves that travel in the solid away from the forcing. Been there, done that. However, the integrating you refer to which doesn’t work is not relevant to what I am talking about.
I will try an example to elucidate the simple scenario I am talking about:
Start with a mass with high thermal conductivity so the assumption that it is all at the same temperature is acceptable. It is at a steady-state temperature, T1.
Apply a forcing to it, say a small heater at time 0.0. The temperature of the mass will increase comparatively quickly at first and the rate will decline as it approaches a new steady-state temperature, T2, asymptotically. The curve shape is similar to T = T1+(T2 T1)*(1-e^-kθ) where k depends on thermal factors of the problem and θ=elapsed time. The new steady-state temperature is when the heat being received (forcing) equals the heat leaving (negative forcing from radiation, convection & conduction). The time it takes to get 1-1/e (about 63.2%) of the way from T1 to T2 is called the time constant (e.g. the time constant for earth is about 5 years: Schwartz 2007 http://www.ecd.bnl.gov/steve/pubs/HeatCapacity.pdf).
Now assume when the temperature T of the mass gets half way from T1 to T2 the forcing is ramped down to the level where the final temperature would be 90% of the way from T1 to T2. While the forcing is ramping down, T is still increasing (assuming it is still less than T1+0.9*(T2-T1)), now on its way to 90% of the way from T1 to T2. The temperature at any time after 0.0 is the time-integral of the forcing from 0.0 up to that time (divided by effective thermal capacitance).
Separate subject:
Predictive ability of equation (1) in my blog: Figure 14 includes a prediction that used data up to 1990 and assuming solar cycle 24 that actually happened was predicted in 1990. The predicted trend for 2020 calibrated by data through 1990 is within 0.06 K of the predicted trend using data through 2015 (Fig 11). The prediction 2020-2037 depends on what solar cycle 25 does which is your bailiwick. I give a range depending on whether the sun is blank like Maunder Minimum or active like 1925-1941.
Start with a mass with high thermal conductivity so the assumption that it is all at the same temperature is acceptable.
Neither the atmosphere nor the oceans fulfill that assumption, so analysis based on that does not seem to be relevant.
The only purpose of the example is to show what is wrong with this “when the solar output is falling the Earth is cooling”. If you are unable to see it . . . well, I tried. Solar output trend as determined by time at SSN (calculated by the time-integral of SSN) has been falling since about 2004 but the earth (AGT) has not been cooling . . . yet. The assessment that is a 98% match to measured AGT 1895-2015 (R^2=0.98) is at http://globalclimatedrivers2.blogspot.com. This has recently been peer reviewed as shown at http://irjes.com/Papers/vol5-issue11/E5113145.pdf
If you are unable to see it
Are you talking to yourself?
Solar activity has been downward since the 1950s and temperatures have been rising. So, no real connection. Solar output never cools the Earth, only warms it to various degrees. No need to ‘integrate’ anything.
Leif
Solar activity has been downward since the 1950s and temperatures have been rising
Henry [after taking a deserved break] says
this is an incorrect statement. Solar activity reached its maximum in 1971 and [relative] warming only reached its end in 1995
http://oi68.tinypic.com/fkqyi0.jpg
[and other graphs]
this incorrectness of your understanding of course flows from your refusal to put two of the successive Schwabe solar cycles of differing polarity into one Hale cycle and to judge those [Hale] cycles’ strength on their own. What would it show you if you did?
I can prove from various sources, e.g. minima, maxima etc. that the succession of the Hale cycles was as follows:
1928 Beginning of new GB cycle. Solar activity reached its minimum and starts climbing up. First quadrant of the GB cycle until 1949 it is still relatively cooling.
1950 Beginning of the new Hale cycle which forms the 2nd quadrant of the GB cycle. It starts warming.
1971 Solar activity reached its maximum. Beginning of the new Hale cycle i.e. 3rd quadrant of the GB cycle. It is still warming until it reaches 1994.5
1995 Beginning of the new Hale cycle i.e. the 4th quadrant of the GB cycle. Relatively we started cooling a bit [the ‘pause’] compared to previous. Solar activity back to its minimum in 2015, same as 1927.
2016-2037.5 Beginning of the new GB cycle and new Hale cycle. Two decades of more cooling coming up, similar to 1928 – 1950. Sharp drop in big T coming up soon and we start climbing back up again.
All of that is simply wrong. Here is a good graph of solar activity:
http://www.leif.org/research/HMF-B-Variation.png
I am looking at energy coming through the atmoshere. Or proxies for energy. Try looking at ssn when you put the 2 schwabes together.
Have not got the time for tjis anymore. Maybe next weekend.
The energy does not depend on the sign of the field, so no Hale cycle in the energy. An engineer should know that…
leif, I think we discussed my result of Tmax in Alaska before [investigation from 3 or 4 years ago]
http://oi60.tinypic.com/2d7ja79.jpg
you wanted to prove there is no GB in recent SSN
http://www.leif.org/research/HenryP-GN.png
and I argued that I don’t trust SSN before more then 100 years ago, not least because of the corrections to original data, just like they did with global Tmean
Now, everybody can see that SC 20 is the odd one OUT and that is important.
Go figure.
and I argued that I don’t trust SSN before more then 100 years ago
SSN from 1900-1960 also do not agree with your curve.
Perhaps you don’t trust them eithet.
I’ll paraphrase your statement:
“I don’t trust data that disagree with my curve”.
The simple explanation is, perhaps, that your hallowed curve is just plain wrong.
Leif, you are ignoring what Hale & Nicholson said and I think the resulting confusion is another shame on you and the top solar scientists. Nothing wrong with my curves –
if you are not interested, fine, but for everyone else:
here is what you can learn from my curves, counting downwards using my own numbering so I don’t make a mistake
Hale 1 = SC25 + SC26 note during SC 26 it is going to be very cold, just like the 1940’s. During the hunger winter of 1944 people in Holland started to eat tulip bulbs
Hale 0 = SC24 + SC 23 start of the ‘pause’
Hale -1 = SC 22 + SC21 2nd warming quadrant
Hale -2 = SC 20 + SC19 1st warming quadrant
Hale -3 = SC 18 + SC 17 = similar to Hale 1
Looking at SSN I can see with my eyes, that, if I were to measure the areas below the Hale pairs of Schwabe cycles as indicated above, and add those areas together to get an average for each Hale, I would get a perfectly normal distribution of SSN that follows my curves exactly….
Looking at the solar polar magnetic field strengths you can see the same thing, i.e. you draw a parabola and hyperbole respectively for the south and north field strength and those curves would basically represent the average field strength over time – 1971 to 2015 – exactly half the GB cycle.
Who was the guy that started with this nonsense that you could simply separate the Hale Nicholson cycles into 2 Schwabes and look at every SC separately? He must be one of those guys who also believe that man must pay for the sunshine…
Leif, you are ignoring what Hale & Nicholson said
No, I’m explaining to you that the energy provided by that magnetic field does not depend on the sign of the field, hence there is no Hale cycle in the energy received. The rest of your comment is just nonsense.
so it was you Leif, then, mainly? wasn’t it
and you think you are still correct?
everywhere I look they mention the 22 year period in the Fourier spectra of a number of records
e.g.
Persistence of the Gleissberg 88-year solar cycle over the last 12,000
years: Evidence from cosmogenic isotopes
Alexei N. Peristykh1 and Paul E. Damon
Department of Geosciences, University of Arizona, Tucson, Arizona, USA
Received 15 March 2002; revised 2 July 2002; accepted 9 July 2002; published 3 January 2003.
[1] Among other longer-than-22-year periods in Fourier spectra of various solar–
terrestrial records, the 88-year cycle is unique, because it can be directly linked to the
cyclic activity of sunspot formation. Variations of amplitude as well as of period of the
Schwabe 11-year cycle of sunspot activity have actually been known for a long time and a
ca. 80-year cycle was detected in those variations. Manifestations of such secular periodic
processes were reported in a broad variety of solar, solar–terrestrial, and terrestrial
climatic phenomena. Confirmation of the existence of the Gleissberg cycle in long solar–
terrestrial records as well as the question of its stability is of great significance for solar
dynamo theories. For that perspective, we examined the longest detailed cosmogenic
isotope record—INTCAL98 calibration record of atmospheric 14C abundance. The most
detailed precisely dated part of the record extends back to 11,854 years B.P. During this
whole period, the Gleissberg cycle in 14C concentration has a period of 87.8 years and an
average amplitude of 1% (in 14C units). Spectral analysis indicates in frequency
domain by sidebands of the combination tones at periods of 91.5 ± 0.1 and 84.6 ± 0.1
years that the amplitude of the Gleissberg cycle appears to be modulated by other longterm
quasiperiodic process of timescale 2000 years. This is confirmed directly in time
domain by bandpass filtering and time–frequency analysis of the record. Also, there
is additional evidence in the frequency domain for the modulation of the Gleissberg cycle
by other millennial scale processes.
how could anyone have missed this?>
note the average of 2 Schwabe is 22 years….
None of this matters as to the energy in the Hale Cycle:
The energy of the magnetic field does not depend on its sign, hence there is no Hale cycle in the energy received.
The Gleissberg ‘cycle’ has been about 100 years lately:
http://www.leif.org/research/Gleissberg-Cycle.png
and thus disagrees with your curve.
leif
I know from my own results how long the GB is and I most certainly don’t trust the unsmoothed SSN that you promote, as just explained
data for GB which include my own data and a number of proxies, like the flooding of the Nile, also show a correlation with the position of a few planets
http://oi64.tinypic.com/5yxjyu.jpg
now obviously the question comes up: is that correlation [position of the planets] caused or causal to solar activity?
you tell me your honest opinion
[please don’t avoid the actual question]
now obviously the question comes up: is that correlation [position of the planets] caused or causal to solar activity?
For your elucidation: http://www.leif.org/research/AGU%20Fall%202011%20SH34B-08.pdf
Hi Dan
I saw you are using Hadcrut4 data to show Tmean from before the 1950s
I don’t know if you realize this, but obviously the way we measure and compute daily T mean results now, since the 1970’s, is completely different than before 1950/
for example, the earliest example of a re-calibration of a thermometer that I could find was 1948. In those days without computers you had to rely on someone personally taking 4 or 6 readings a day to get a mean. Only in the 60s they started with the wind-up clocks and a “pen’ recorder and even then to calculate a mean for the day was not so easy or not possible if the ink dried up…… Of course nowadays it is all thermo couples with recorders that are calibrated once a year that measure once a second and at the end of the 24 hour day print an average and min and max
So, as far as Tmean is concerned you cannot really compare the last 50 years with the 50 years before that. It is really comparing apples with pears.
Instead of Tmean before 1950 you could look at Tmax or Tmin. Although the calibration error might still be there, it is probably has less error.
Or, looking at rate of change instead of anomalies also eliminates the calibration error/ at least.
Leif – These two statements of yours don’t do much for your credibility on climate.
“when the solar output is falling the Earth is cooling”
“Solar activity has been downward since the 1950s and temperatures have been rising”
The time-integral is correct. The time-integral of speed is distance. The time-integral of power is energy. The time-integral of a proxy for energy rate on earth wrt break even divided by effective thermal capacitance is AGT anomaly. Combine that with the effect of other significantly contributing parameters as shown in Equation (1) and you match measured anomalies 1895-2015 98%. Equation (1) projects the trend to 2020 with high certainty of less than 0.1 C off and to 2037 depending on what the sun does. This is all fundamental engineering science. Doing anything else might explain the “epic fail” of ‘climate scientists’ to predict AGT.
This is all fundamental engineering science
No, it is curve-fitting.
Hen – Who is ‘we’? Are you asserting that all of the reporting agencies are wrong? Awhile back I compared AGT for the 4 agencies that report temperatures including prior to 1895. All are about the same as shown at http://globaltem.blogspot.com I used to combine them in a sort of average but decided just using HadCRUT4 didn’t sacrifice any usefulness of the approach. With an R^2 of 0.98, there isn’t much room for improvement.
Leif – Call it what you like, it ‘predicted’ (using actual SSN) the AGT trend 25 years into the future, 1990-2015, within 0.1 C. The prediction from here on depends on the SSN trend which, it appears, no one is very confident about.
What is ‘actual SSN’?
“Multidecadal Ocean Cycles. Since publication of our prognosis in 2012, the understanding of multidecadal ocean cycles and their systematic influence on global climatic has seen a major breakthrough”
The breakthrough came earlier than that, see here:
http://www.newclimatemodel.com/the-real-link-between-solar-energy-ocean-cycles-and-global-temperature/
May 21st 2008
” I have written this article to draw attention to what I consider to be the underlying real world process of global temperature change. Global temperature is controlled quite precisely (although it is difficult to calculate) by solar energy modulated by a number of overlapping and interlinked oceanic cycles each operating on different time scales and being of varying intensities, sometimes offsetting one another and sometimes complementing one another.”
and:
“Before it is safe to attribute a global warming or a global cooling effect to any other factor (CO2 in particular) it is necessary to disentangle the simultaneous overlapping positive and negative effects of solar variation, PDO/ENSO and the other oceanic cycles. Sometimes they work in unison, sometimes they work against each other and until a formula has been developed to work in a majority of situations all our guesses about climate change must come to nought.
So, to be able to monitor and predict changes in global temperature we need more than information about the past, current and expected future level of solar activity.
We also need to identify all the separate oceanic cycles around the globe and ascertain both the current state of their respective warming or cooling modes and, moreover, the intensity of each, both at the time of measurement and in the future.
Once we have a suitable formula I believe that changes in global temperature will no longer be a confusing phenomenon and we will be able to apportion the proper weight to other influencing factors such as the greenhouse effect of CO2.”
Stephen, of course there were earlier pioneer contributions, and I see you were one of these pioneers. Congratulations and thanks. I first heard about the ocean cycle – temperature link through articles by Syun-Ichi Akasofu and Don Easterbrook. The credit really goes to you guys who spotted this so early. It took quite a few years that this concept now finally got accepted, this is what I meant with “recent breakthrough”. In 2011 I had spoken to one of the key IPCC modellers and he was still convinced that ocean cycles are just noise. Times have luckily changed and science has made a major leap forward.
Cheers
Sebastian
Thanks, Sebastian.
I’m now awaiting similar progress on my hypothesis about the mechanism for a solar effect on climate via UV in the lower stratosphere which I have been putting forward since about 2010.
Most recent iteration here:
http://joannenova.com.au/2015/01/is-the-sun-driving-ozone-and-changing-the-climate/
People are working on it, apparently, but they haven’t joined up all the dots as yet 🙂
Hope it doesn’t take 50 years as in Wegener’s case.
Good stuff. Thanks for the link. It is indeed time that researchers mak progress on the solar climate effect. The cloud/cosmic ray idea was a good start but is more complicated and complex than people thought. I still think there is something there which contributes. The UV is an important potential amplifier. Temperature changes in the stratosphere over a 11 year solar cycle are significant. How do these filter down to the troposphere? The strong link of stratosphere to troposphere has meanwhile been accepted (another breakthrough), but the detailed mechanisms are in the process of being understood.
How I see it and for those who disagree the burden is on you to show why it is not correct and as Willis says not by hand waving which is all I have seen from the other side, just as that side always tries to accuse us of.
Prolonged minimum solar mechanisms which are modified by the geo magnetic field strength.
It will cause the following:
Increase in galactic cosmic rays results in an increase in global cloud coverage.
Increase in galactic cosmic rays will also result in major volcanic activity.
Decrease in UV results in sea surface temperatures cooling
Decrease in EUV light causing the atmospheric circulation to become more meridional due to less ozone and distribution changes in the ozone. Results in greater snow coverage and cloud coverage.
All the above resulting in the albedo to increase which will cause cooling ,even an increase nearing 1% being sufficient.
CO2 in the meantime having a zero effect upon the climate while the GHG effect is a result of the climate/environment. That is why CO2 never leads the temperature.
The climate models do not take into account solar variability or geo magnetic variability.
AGW THEORY is flawed from the missing lower tropospheric hot spot , to the missing positive AO evolving, to a decrease in OLR in major doubt.
Solar activity entering a DALTON type period of activity which will be sufficient to have the solar parameters meet my criteria to bring about global cooling modified by the geo magnetic field. The low solar parameters driving the terrestrial items which control the climate into a cooling mode.
Global cooling has begun and it will be accelerating going forward. AGW theory will be proven to be wrong before this decade is out.
The historical climatic record supports a solar climate relationship but does not support a CO2 climate relationship.
.
So as the globe cools I can not wait to see the denial and all the lame excuses.
[but if it doesn’t happen as you predict, what will you be saying? -mod]
I appreciate the question from the moderator because I am making big clams here. If the prediction does not happen, I will say I am wrong. I will admit it and not try to spin out of it.
Remember my predictions are based on extremely low solar parameters which I have mentioned many times that need a sufficient duration of time 6 months or greater following 10+ years of sub solar activity in general.
Thus far the 10+ years of sub- solar activity in general has occurred.
Presently the solar flux reading, EUV light/UV light, and cosmic ray counts have reached my criteria but not the AP index or solar wind speed, or the IMF, or overall solar irradiance.
I expect the solar wind speed and AP index will start to drop off once the coronal holes start to fade away which should eventually happen due to very low sunspot activity.
Presently duration of time has yet to set in any meaningful way due to the fact some of the solar criteria is above what I have called for presently while some of the solar criteria has recently reached my parameters.
Yes if the above happens and the global temperatures stay the same or do not go down I will be wrong. Of course the global temperatures are not going to go down in one straight continuous line but the overall trend will be down if I am correct.
Thanks for the question.
Are ALL of your conditions and mechanisms absolutely necessary? Will you claim victory if only one of them fails? or two? or three? etc….
Sal – Beware the rising water vapor.
Stephen like myself have been solar advocates for years and agree on many items but have some differences but that is the norm in this field.
An example would be the role the geo magnetic field strength has in the climate .
Robert Felix is big on this and I am with him on this but again do not agree with everything he says.
Javier also much agreement with but then differences. Namely the solar cycles which I think are next to useless to predict future solar activity.
Hi Salvatore.
There are multiple phenomena (such as cosmic rays and the magnetic field strength) that serve as proxies for the variations that undoubtedly occur in the solar wavelength and particle outputs (rather than in TSI per se) but the only ones that I find capable of altering the behaviour of the jet stream tracks are the ones that affect the ozone creation/destruction process in the lower stratosphere.
A warmer lower stratosphere pushes the tropopause downwards and a colder lower stratosphere allows the tropopause to rise.
That is what the sun is doing but differentially at equator and poles.
Stephen keep up the good work . I think a climate response is now in the making to what we have been advocating, as long as the solar/geo magnetic fields stay weak and weaken further.
Stephen I think the geo magnetic field enhances solar effects when in sync with it.
I this a bold statement but one has to either sink or swim with his/her predictions.
ozone creation/destruction process
Which is due to EUV of which we now have a good record stretching back almost 300 years:
http://www.leif.org/research/Reconstruction-of-Solar-EUV-Flux-1740-2015.pdf
The EUV follows the sunspot cycle [and TSI] very closely [so SSN and TSI are good proxies for EUV].
There are implications for climate research in this, see e.g.
http://www.leif.org/research/EUV-F107-and-TSI-CDR-HAO.pdf
EUV isn’t the only feature of solar output that has an impact on the ozone creation/destruction process in the lower stratosphere.
What else?
http://www.esrl.noaa.gov/csd/assessments/ozone/2010/twentyquestions/Q2.pdf
“In the stratosphere, the process begins with an oxygen molecule (O2 ) being broken apart by ultraviolet radiation from the Sun”
A whole range of chemical reactions can affect the ozone balance including solar protons and nitrous oxides. Most of the reaction types are affected by changes in sunlight either directly or indirectly.
You might look at the work of Joanna Haigh.
Solar Protons very rarely gets down to the lower stratosphere and thus have negligible influence.
And nitrous oxides are essentiall man-made:
http://www.noaanews.noaa.gov/stories2009/20090827_ozone.html
Nitrous oxides are mostly natural and production rates are affected by sunlight and thus global albedo
(“a) N2O, or nitrous oxide, and some NO, or nitric oxide, are produced by bacteria in the soil and in the oceans. Nitrous oxide is relatively unreactive in the troposphere and is the main source of nitric acid and other nitrates in the stratosphere. This is important in the chemistry related to ozone destruction in the stratospheric ozone layer.”
So, once in the stratospheric ozone layer the effect of nitrous oxides that may be present is influenced by the intensity and wavelength structure of sunlight and the presence or absence of other chemicals and particle reactions.
Solar protons destroy ozone in the mesosphere but mesospheric air feeds down to the lower stratosphere above the poles via the Polar Vortices. Thus solar protons can affect the size of the Antarctic ozone hole and the concentration above the Arctic.
UV and EUV are important but your focus on EUV is misleading.
UV and EUV are important but your focus on EUV is misleading.
I showed that as EUV goes, so go all the other solar indicators as they are all due to the same solar magnetic field. I don’t ‘focus’ on EUV as the actual agent, but show that whatever solar agent(s) you prefer they all vary as the magnetic field [that can be deduced from the EUV]. The solar magnetic field since at least the 1740s have not matched the changes in temperature, hence is not a major player for climate change. Figure 1 of this very post is a good illustration of this disconnect.
I agree that the magnetic field varies with the other solar parameters but in my view the magnetic field strength and all those other parameters are mere proxies for a wavelength/particle effect on the net balance of the ozone creation/destruction process.
It is atmospheric chemistry under varying solar conditions that is the key.
I focus on ozone because only the temperature of the lower stratosphere will affect the height of the tropopause from above (the warming effect of ozone creates the tropopause by reversing the vertical lapse rate slope) and in order to get the observed air circulation pattern changes between meridional (more cloudy) and zonal (less cloudy) one must alter the gradient of tropopause height between equator and poles.
The evidence is accumulating that that is exactly what solar variations are achieving.
I focus on ozone because only the temperature of the lower stratosphere will affect the height of the tropopause from above
So, only solar radiation [which has not had any trend the last 300 year] is the only driver.
“The solar magnetic field since at least the 1740s have not matched the changes in temperature, hence is not a major player for climate change.”
Well there you go again despite being told, calmly and sensibly, that in view of system inertia there is absolutely no reason why we should have a close match over the relatively short timescale since the 1700s.
I agree that the 1700s was a time of high solar activity and it was warmer then than during the period of lower activity before 1700.
<i.Well there you go again despite being told, calmly and sensibly, that in view of system inertia there is absolutely no reason why we should have a close match over the relatively short timescale since the 1700s
So ‘there is absolutely no reason why’ variation of solar radiation can explain the recent global warming over the even shorter timescale since the 1900s. Good that you agree with that.
I referred to a ‘close’ match. There is nevertheless a similarity in that the 1700s period of active sun was warmer than the period before and the 20th century active sun also involved warming.
You were demanding nearly precise equivalence which is silly.
There is nevertheless a similarity in that the 1700s period of active sun was warmer than the period before and the 20th century active sun also involved warming.
But the 1700s were much cooler than the 20th century, so no similarity there. The 20th century’s activity has gone down since the 1950s and temperatures have soared. Again a not even ‘close’ similarity.
But, in general, your inability to put numbers to your utterances makes it possible to use extensive hand waving which [as you say] is not very ‘scientific’.
There is simply no support for any of your ideas.
Not ‘solar radiation’ per se but rather the specific mix of wavelengths and particles.
Dealing with you is like trying to nail jelly to a wall.
the specific mix of wavelengths and particles.
Can you be specific? What mix exactly?
to nail jelly to a wall
your ideas are as firm as the jelly you mention.
Cycles very much improve the probabilities of predicting correctly. Your problem is that cycles do not predict the same that you think is going to happen. However your prediction record is awful, so I don’t understand why you are so confident that this time you are going to get it right.
Right now it boils down to three general predictions:
1. Those that believe that we are heading towards a Solar Grand Minimum.
That includes you, Abdussamatov, Zharkkova, Sánchez-Sesma and others.
For that to happen SC25 should be significantly lower than SC24. And SC26 lower than SC25.
2. Those that believe that we are entering a prolonged centennial minimum similar to the 1900’s
That includes Leif Svalgaard that has said that we are entering a group of five low activity cycles.
https://wattsupwiththat.com/2016/11/24/the-bray-hallstatt-cycle/comment-page-1/#comment-2351721
For that to happen SC25-28 should all be similar to SC24.
3. And me, that believe we are already in a short centennial minimum of an intensity similar to the 1900s but much shorter (only two of at most three cycles).
For that to happen SC25 should be similar to SC24, but SC26 and specially SC27-28 should have again higher activity, similar to SC21-23.
This last prediction is based on the cyclic behavior of solar activity that you dismiss so easily.
http://i.imgur.com/chz2WcX.png
A longer centennial minimum won’t take place until around 2115. When the next low in the de Vries cycle is expected. But as the de Vries cycle is linked to the Bray cycle, the solar activity during that minimum will be higher than during the 1900’s if the model is correct. A solar grand minimum is not expected for several centuries.
In less than 10 years we will know if the first prediction is correct. Once SC25 shows a higher activity than the prediction requires we will know we are not approaching a Solar Grand Minimum.
In about 11 years we will know which prediction is correct, once the magnetic fields of the Sun allow for a prediction of SC26 activity. Further confirmation will come in about 22 years when we can do the same for SC27.
This last prediction is based on the cyclic behavior of solar activity…
Cycles presume that the Sun has a memory of past cycles or that the process that drives the cycles ‘knows’ that it has to repeat. Our present knowledge of the Sun does not identify a memory or the driving process inducing cycles. In fact there is a great deal of randomness in the creation of the polar fields from the debris of the current cycle. The flux in the polar field is only of the order of a few active regions [out of the 3000 that occurs during the sunspot cycle], so we are dealing with ‘small number statistics. It is quite possible to get four heads in a row from five flips of the coin, but not to get 400 heads in 500 flips.
So you are postulating that unknown processes are driving the system. It is usually a bad idea to ascribe something to some unknowns.
I am not sure about that. Does the night have a memory of the past days or a knowledge that it has to come? The Earth simply spins and that produces cycles.
You don’t need to know the process to spot a cycle. The Ancient Egyptians thought that the sun was a god, Ra, who traveled on two solar boats one during the day and another during the night. That you don’t understand the cycle or its causes doesn’t mean that you cannot calculate it, and the ancient Sumerians calculated the eclipses without understanding of their mechanism. And they have a complex cycle.
My observation is of the same category as your observation that:
“There is an approximate 100-year variation where generally low cycles and high cycles are found in groups of about five cycles duration.”
http://www.euanmearns.com/wp-content/uploads/2016/05/Figure-5.png
The hundred year unit that you have observed is composed of two parts, 1 and 2, with a small decrease in activity in the middle (SC 20 in the 1970s), but the 208 yr de Vries cycle indicates that it is actually a double unit (A and B). Therefore 1, 2, 3 and 4, with 4 affected by the de Vries cycle. This observation can be extended into the past and one can see that the de Vries lows have always fallen on 4 (filled red circles in the following picture).
http://www.euanmearns.com/wp-content/uploads/2016/05/Figure-6.png
4 always has lower activity than 3 when it is at ± 500 years of a ~ 2400 yr Bray low (filled red circles), but never when >500 years of a ~ 2400 yr Bray low (empty red circles). This agrees with the observation many times mentioned in the literature that the Bray cycle modulates the de Vries cycle, so the last one is only conspicuous near the Bray lows.
The Roman Minimum however fell on 2, which indicates that the ~ 1000 yr eddy cycle is independent from the other two.
There is no need to understand how the Sun works to be able to identify its cycles and be capable of making a successful prediction, as the Sumerians did with the eclipses. Sooner or later the scientists will be able to find out how the cycles originate and improve our predictive capability, but the cycles are always spot by people that don’t understand them, and just have keen observation capabilities.
At the next minimum (2021?) we will finish 2 and start 3. And 3 is almost always strong. It was strong during the entire LIA, where it produced the warm interludes. The chances that we will have a Grand Solar Minimum in the next 60 years are almost nil. And then the next period 4 will not be affected by the de Vries cycle (open circle). So just normal solar activity for the next century.
I don’t know if solar cycles are internal or external to the Sun, nor I care much. It is not my job to find out what causes them. I care that they do exist and they do affect the climate, because that is what the proxies say.
As there are no dramatic predictions from solar cycles for the next 400 years (which is good for people), it is possible that most people will not recognize the cycles. After all to work out the eclipse cycle you need eclipses. In my opinion it may well be 500 years before we see another Grand Solar Minimum, so Salvatore has a long wait ahead.
So your ‘science’ is at the level of the Egyptians and the Sumerians. Modern solar physicists know a bit more about the Sun, about its interior and how it works. We are quite sure that the sun will not suddenly start to spit out great balls of green cheese. Similarly, the solar interior [because it is so hot and convective] cannot sustain long-term cycles that require spatial and temporal long-term memory. We know a lot about what the Sun cannot do. Your cyclomania is not science. Even if a ‘prediction’ comes true, it could be correct this time for the wrong reason and may not hold in the future.
Cute remark, but science has always been based on observation, and modern science is as likely to get lost as Ancient Egypt science when it forgets to be grounded in observation, and solar cycles is not the only example. The belief in the almighty warming power of CO2 is myth based, not observation based, as observations say no significant warming for almost 20 years. And the role of dietary fat in disease is myth based as the observations did not support it. And String theory is myth based as it is not grounded on any observation. Doctors, climate scientists, solar physicists, they all tell us how much they know, and they told us the same 20 or 50 years ago when they knew a lot less. What they don’t usually tell us is how much they don’t know. So unless what they say is properly based on observations, as the Sumerian astronomers demonstrated, it is probably a myth.
Memory is not a requirement for long term cycles. Daily, seasonally, and annually cycles are all achieved without memory from the system. Same for orbital Milankovitch cycles. Same for the lunar cycles. The memory requirement is based on your assumption on how such cycles should operate. Your assumption is likely to be wrong.
There are no wrong reasons. My interpretation of the cycles is based on observations. If the predictions are correct is because my interpretation is sufficiently close to reality. My model gives an approximate amplitude for every solar cycle in the future for thousands of years. It can be tested how close to the reality is every 11 years. As you say it will sooner or later fail because solar cycles are quite irregular and we don’t know why. But hopefully our knowledge of the Sun will have advanced to know what causes the long cycles of solar activity variability and make better predictions. But that advance will be impossible for as long as those with more influence in the field, like yourself, reject the observations and evidence of the existence of the long cycles. A field in science cannot advance while those with more influence in the field block the advance, like you do.
Memory is not a requirement for long term cycles. Daily, seasonally, and annually cycles are all achieved without memory from the system. Same for orbital Milankovitch cycles. Same for the lunar cycles.
The memory is given by the orbits and no physical processes are involved driving the cycles. The Sun and the Climate are very different from the orbit driven cycles. You comparisons are not relevant.
solar cycles are quite irregular and we don’t know why
We do know why: the reversal and build-up of the polar fields are very much a random process.
A field in science cannot advance while those with more influence in the field block the advance, like you do
Cyclomania is not advancing the field. It is important instead to weed the field. The Sun-Weather-Climate field is a 400-yr long travesty with thousands of bad papers. There has been no progress in understanding cycles longer than the 11-yr sunspot cycle, which may not be a ‘cycle’ at all, but simply a sequence of independent eruptions with a temporal scale set by the size of the system.
Leif,
You don’t know that. That is an assumption. Nothing can be demonstrated not to exist.
Not true. Solar cycles are advancing our paleoclimatology knowledge. That’s why some papers that deal with solar variability and cycles are widely cited. And I am sure that the position that many astrophysicists like you hold about long variability cycles is not precisely encouraging to young talents. After doing their best so there is no progress they complain that there is no progress.
That 90% of the papers on solar variability are bad says nothing. 90% of the papers on anything are bad. Few people researching a subject against the contempt of their colleagues makes for scant progress.
You don’t know that. That is an assumption. Nothing can be demonstrated not to exist.
We have total solar eclipses [also observed by the Sumerians] because the apparent size of the Moon currently rather precisely matches that of the Sun. There is no physical process that links the two such that this coincidence is always satisfied, as the match is purely coincidental [given by orbits and sizes]. So, there is a demonstration of something that does not exist [a mechanism that keeps the two apparent sizes the same for all times].
And I am sure that the position that many astrophysicists like you hold about long variability cycles is not precisely encouraging to young talents
Young talents will do what young talents do after they have mastered the science they are studying. One thing they learn is not to be gullible and not to be fooled by themselves [Feynman].
Willis says below which my reply is why don’t you show and prove to us why solar/climate links do not exist? Let’s put the shoe on the other foot for a change.
From Willis
Indeed, I’ve repeatedly asked people who think such a solar-climate exists to send me TWO LINKS, one to the best study establishing the purported connections
I’ve linked Willis to my work but he doesn’t accept it as authoritative enough despite the better fit with real world observations than the work of anyone else.
the better fit with real world observations than the work of anyone else
Since you do not provide numbers, it is impossible to honestly claim a ‘better fit’ with anything.
Number of diverse climate phenomena. I have previously listed them for you on more than one occasion.
Verbiage does not make possible a claim of ‘better fit’ as I have pointed out many times.
If you say that real world observations don’t count then there is nothing more to be said to you. In due course those observations will be better tabulated and quantified but as yet the data is sparse so you will just have to wait.
@Stephen Fisher Wilde
Stephen, I would get in touch with you. My contact: http://kaltesonne.de/impressum/
Greetings, Sebastian
Yes, I think we can discount the simple cosmic ray scenario because it doesn’t help much with the observed circulation pattern changes. There is no shortage of condensation nuclei anyway.
The key is in the concept that the gradient of tropopause height between equator and poles must change if the degree of jet stream meridionality / zonality (and hence cloudiness) is to change.
In order to have an effect on the tropopause gradient the solar variations (wavelengths and particles) must have a different net effect on the ozone creation/destruction balance over the equator as compared to over the poles.
The mesosphere becomes important because that region supplies a ‘feed’ of downward flowing air into the stratosphere above the poles. (The Polar Vortex proper, not the so called polar vortex of jet streams around the poles at the surface).
It has been observed that the ozone quantity response to solar changes above 45km (in the mesosphere) is reversed as compared to the response below 45km. The paper showing that feature covered the period to 2004 but I have not heard what has happened since.
One interesting implication is that an active sun causes a larger ozone hole without any need for our CFCs.
Interesting times.
“The auroras are themselves caused by energetic electrons bombarding the upper atmosphere. The reason that auroras are usually located near the polar regions is that the Earth’s magnetic fields guide the energetic electrons there. Electrical currents as great as a million amperes can be produced along the aurora oval, and the electric power generated during the discharge is truly awesome – about ten times the annual consumption of electricity in the United States.”
Irrelevant for ozone in the lower stratosphere.
Important for ozone in the mesosphere.
http://www.cpc.ncep.noaa.gov/products/stratosphere/strat-trop/gif_files/time_pres_WAVE1_MEAN_OND_NH_2016.png
The mesosphere extends from the stratopause to about 53 miles (85 km) above the earth. The gases, including the oxygen molecules, continue to become thinner and thinner with height. As such, the effect of the warming by ultraviolet radiation also becomes less and less leading to a decrease in temperature with height. On average, temperature decreases from about 5°F (-15°C) to as low as -184°F (-120°C) at the mesopause. However, the gases in the mesosphere are thick enough to slow down meteorites hurtling into the atmosphere, where they burn up, leaving fiery trails in the night sky.
MESOSPHERIC BORE (IT’S NOT WHAT YOU THINK): This month, a lot is happening in the mesosphere. The mesosphere is a layer of Earth’s atmosphere above the stratosphere; it is the realm of sprites, noctilucent clouds (NLCs), and airglow. Starting on Nov. 17th, NASA’s AIM spacecraft spotted bright noctilucent clouds forming in the mesosphere above Antarctica. Then, in an apparently unrelated development on Nov. 24th, the normal dome of airglow over China split in two. Xiao Shuai photographed the event from Mount Balang in Sichuan:
http://www.spaceweather.com/archive.php?view=1&day=30&month=11&year=2016
Just eliminate the sun in an Einstein mind experiment. Who needs it? The models certainly don’t need it.
When the ratio of the impact of El Ninos to La Ninas is > 1 you have warming and whenever they are < 1 you have cooling . Since the 1850's, these alternate warming and cooling periods have each lasted roughly 30 years. [Note that these warming and cooling phases are superimposed upon longer term trends in the World temperature that could be due to a number of causes, including AGW].
I contend that the onset of El Nino events is primarily driven by Luna tidal effects. These tidal effects also influence the strength of the sub-topical zonal winds – and hence the cooling efficiency of the climate system through meridional energy and momentum transport from the tropics to the poles. The overall tidal cycle is ~ 60 years (specifically a mixed of the 59.75 year and 62.0 year seasonal tidal cycles) and these changes are reflected in the ~ 60 year cyclical trend in the strength of the global trade winds that are observed going back 400-500 years.
The sub-centennial lunar tidal effect upon the Earth's ability to warm and cool only accounts for about ~ 0.2 – 0.4 C to the observed temperature changes and so they can only serve to moderate factors [which may themselves also include additional tidal effects] that influence warming and cooing on longer centennial time scales.
I will stick my neck out here [meaning I could be way off the mark] and assert that the appearance of some form of long term solar affect upon climate is just that – an appearance. It is actually the luni-solar tides that is doing most of the work and the effects of these tides upon the Earth's climate just happened to be synchronised with overall solar activity i.e. the periodicities observed in the lunar tides match those seen in the long-term variations of solar activity because both are being driven by the same underlying cause at centennial to millennial time scales.
https://www.nasa.gov/vision/earth/lookingatearth/29dec_magneticfield.html
I find the movement of the north pole striking and the movement of all that molten iron more towards the NH must have an effect on warmth of the earth there [in the NH]? Here is SA, and indeed most of the whole of the SH, there never was any warming.
https://www.nasa.gov/vision/earth/lookingatearth/29dec_magneticfield.html
I find the movement of the north pole striking and the movement of all that molten iron more towards the NH must have an effect on warmth of the earth there [in the NH]? Here in SA, and indeed most of the whole of the SH, there never was any warming.
When the ratio of the impact of El Ninos to La Ninas is > 1 you have warming and whenever they are < 1 you have cooling . Since the 1850's, these alternate warming and cooling periods have each lasted roughly 30 years. [Note that these warming and cooling phases are superimposed upon longer term trends in the World temperature that could be due to a number of causes, including AGW].
I contend that the onset of El Nino events is primarily driven by Luna tidal effects. These tidal effects also influence the strength of the sub-topical zonal winds – and hence the cooling efficiency of the climate system through meridional energy and momentum transport from the tropics to the poles. The overall tidal cycle is ~ 60 years (specifically a mixed of the 59.75 year and 62.0 year seasonal tidal cycles) and these changes are reflected in the ~ 60 year cyclical trend in the strength of the global trade winds that are observed going back 400-500 years.
The sub-centennial lunar tidal effect upon the Earth's ability to warm and cool only accounts for about ~ 0.2 – 0.4 C to the observed temperature changes and so they can only serve to moderate factors [which may themselves also include additional tidal effects] that influence warming and cooing on longer centennial time scales.
I will stick my neck out here [meaning I could be way off the mark] and assert that the appearance of some form of long term solar affect upon climate is just that – an appearance. It is actually the luni-solar tides that is doing most of the work and the effects of these tides upon the Earth's climate just happened to be synchronised with overall solar activity i.e. the periodicities observed in the lunar tides match those seen in the long-term variations of solar activity because both are being driven by the same underlying cause at centennial to millennial time scales.
And the GISS et al temperature reconstructions are believable….why? Of which all this predication depends on?
To Javier:
You comment the following:
“””””The sunspot group series starts in 1625. It cannot tell you anything about
long before 1645, Joachim. But before we had the Spörer minimum in
cosmogenic and auroral records, together with volcanic eruptions that
help understand why the LIA was so cold at times”””””””
A.) Forget the volcanic effects…Willis wrote a top analysis about 3 years
ago and now the new SIGL VOLCANOE paper with every significant
global eruption for 2500 years, quantified, is out…. volcanoe
supereruptions have a maximum effect of 10 years and
if there were any before 1645, check with the Sigl-paper…..
B.) The sunspots were high 1625-45, more or less (there are years missing in records, none reported – the 30-years war was on and, I am sure, the catholic LIGA murdered
the protestant sunspot counters……but temps were LOW inspite of HIGH sunspot count…..therefore a sunspot caused temp low is “possible” only after 1645 and Wanner
bend the curve down too EARLY, before 1645…. after all Wanner is an entrenched Swiss
AGW whip, bad to quote him…..
C.) The Spörer minimum also does not fit, this was 150-100 years earlier…..The
temp drop started with the cosmic Mahuika impact at 1438 (see GISP2 data),
produced an impact caused temp decline until 1507, and followed by the obligatory
temp rebounce to much HIGER than at impact date (Z-shaped temp pattern) in 1540,
declining thereafter to 1437 levels…. Knowing this temp decline, the “Spörer minimum”
of 1438 – 1520 was fabricated….more details on this, in my Holocene pattern Recognition paper, part 7 on 500 AD to 2100 AD, soon to appear. JS.
TO WELTKLIMA – Javier has presented evidence that refutes everything you say as does the historical climatic record.
You are trying to fine tune the temperatures of the climate, it does not work that way the temperatures go up and down depending on a myriad of factors. What matters is the general trend in temperatures and without exception during times of prolonged solar minimums the global temperature trend has been always down.
Sure it had some up counter trends but those were always in an overall downward temperature trend when prolonged minimum solar conditions prevailed.
The Little Ice Age 1350 -1850 corresponding to overall prolonged minimum solar conditions, which of course had periods of time when temperatures rose.
There will always be counter trends within an overall trend.
Salvadore:
Sunspots were HIGH 1625-1645, which means there was NO MAUNDER MINIMUM in those 2 decades. Maunder started only in 1645……My question was: Why are Maunder Minimum low sunspots responsable and back-acting for LOW Temps BEFORE it, the Maunder Minimum started in 1645?
…. Javier pointed to volcanoes and to Spörer, both arguments are not correct… which leaves the back-acting of the missing Maunder minimum sunspots still unanswered…. ..
Joachim,
It is more like a couple of decades according to temperature proxies, but I agree that the effect is limited. I disagree in that we can forget the volcanic effects. The LIA was punctuated by very cold periods and warmer periods. Volcanic forcing was important in determining some of the coldest ones.
As cosmogenic records agree quite well with auroral records and sunspot records, we don’t need to depend on murdered protestant sunspot counters. Solar activity fits reasonably well with temperatures over the LIA. Volcanic activity complements solar forcing and can help explain why it was so cold prior to the Maunder minimum. There were 3 significant eruptions between 1590 and 1650.
Wanner’s figure contains numerous temperature reconstructions that have been published. I don’t see how his opinions can affect the data.
Possible, but speculative. The Spörer minimum is real.
Leif if solar activity is at or below all of my criteria and the temperatures go down I am going to say I am correct. If the temperatures do not go down I will be wrong.
No, that is false reasoning. It is like flipping a coin once: I think the Great Pumpkin controls coin-flipping and that it is now time for heads as the wind is out of the East. If my prediction comes out right, you would say that my theory is correct and credit the Great Pumpkin. This is nonsense, as is your faith in the correctness of your thoughts just because the prediction came true. Without a reason for why your particular scheme should be true, it has no predictive value, and does not add to our knowledge.
I gave all of the reasons you do not choose to embrace them.
Maybe he has better reasons than you do.
I must have missed them. Tell me again the reasons that make your list of parameters worth considering.
Salvatore is brave enough to have specified a list of solar criteria that in his opinion represent the approximate level at which various solar effects taken together would begin to push the Earth’s climate system into warming or cooling mode.
Leif is correct to suggest that a single correlation does not constitute causation but Salvatore has chosen his criteria to match past times when the sun might well have had an influence on net warming or net cooling for the Earth.
If the Earth does experience a change in temperature trend once Salvatore’s criteria are satisfied then it would be foolish not to then try and tease out a potential mechanism. I have suggested the most likely one in my opinion.
If a change to cooling happens in the near future at a time of quiet sun then Salvatore is entitled to pull all similar past such changes into the frame as well in order to support the causation proposal.
Simply ignoring it as a mere ‘concidence’ would not be a sound scientific approach.
I have suggested the most likely one in my opinion.
Vague hand waving about ‘wavelength and particles’ that actually do not influence the ozone in the stratosphere:
http://www.esrl.noaa.gov/csd/assessments/ozone/2010/twentyquestions/Q2.pdf
“In the stratosphere, the process begins with an oxygen molecule (O2 ) being broken apart by ultraviolet radiation from the Sun”
Anthony Watts, I am curious about the US weather stations but gallery.surfacestations.org is down. Can you please tell me, what to do about?
What is missing here is the Donald effect. It will alter everything.
I don’t know if solar cycles are internal or external to the Sun, nor I care much. It is not my job to find out what causes them. I care that they do exist and they do affect the climate, because that is what the proxies say.
Javier says in the above which means you do not know what the sun is going to do going forward.
You are guessing.
you do not know what the sun is going to do going forward.
That is right. And neither do you or Javier or anybody else. Only when we have measured the solar polar fields can we estimate the next cycle. The current polar fields suggest that Cycle 25 will be a bit stronger than Cycle 24. And we have no idea what 26 or 27 will be. Statistically weak cycles occur in bunches as do strong cycles, but that is like saying that a given old man will be farsighted, just because many old men are. But that is not actionable intelligence.
“you do not know what the sun is going to do going forward.”
I have heard this before – and I think we can do better. There are clear patterns (yes, cycles come in bunches), we can learn a lot from the past. The great majority of solar physcists prognose a deep solar minimum for the coming decades. We can pretend that we know nothing, and there is always a chance of an outlier or unexpected development, but when we argue with probabilities, there is a high probability of a developing deep solar minimum. See:
http://notrickszone.com/2016/10/18/current-solar-cycle-fades-continues-to-be-weakest-in-200-years-likely-foretelling-global-cooling/#sthash.g4ALlVjL.dpbs
The great majority of solar physicists prognose a deep solar minimum for the coming decades
It all depends on what you mean by ‘deep’. Perhaps a minimum like what we have a century ago, but probably not another Maunder type minimum [which was ‘deep’]. Currently it looks like cycle 25 will be stronger than cycle 24.
When your aim is to make it look like the climate is continually warming, you are on a winner when your data source is constantly adjusted to cool the past and adjust the present upward. If the adjustments were in the opposite direction, you would have to cut off their funding before they did severe damage to the Faith.
Nicholas Schroeder November 28, 2016 at 10:21 am
“Forgot to mention”? I wrote a whole post about this variation between aphelion and perihelion.
w.
Sebastian Luening November 30, 2016 at 1:13 am
lsvalgaard November 30, 2016 at 1:21 am
Sebastian, Leif brings up a hugely important point.The more places you look, the more outliers you’ll find, and the less significant they are.
This is adjusted for by the “Bonferroni Correction”. Here’s an example. Suppose you set your level of statistical significance at a p-value of less that 0.05. If you divide your dataset into five subsets, in order for one of them to be statistically significant it has to have a p-value less that 0.05 divided by the number of subsets. This is 0.05 / 5 = 0.01.
So, if we divide the planet into latitude zones, say tropical, temperate, and polar north and south. That’s six subsets. Then we go by season, four seasons. In total we will be looking for an anomaly in no less than six latitude bands times four seasons equals 24 subsets.
And at that point, for something to be considered statistically significant it needs to have a p-value of less than 0.05 / 24 = .002 … and in climate, that’s very hard to find.
Now … care to guess how many of the dozens and dozens of solar studies that I’ve looked at have even discussed the Bonferroni Correction, much less implemented it?
None.
Well said. You’d sure think it would drive a stake through the general cosmic ray idea. As you point out, since about 1950 the sunspot cycles have been weakening. This has led to an observed and measured increase in cosmic rays.
And according to the Svensmark theory, the earth should have been cooling for half a century now … not.
w.
I will never cease to be astonished by the obfuscations and point scoring of Leif and Willis.
Whatever rational points they are given they simply ignore them and just repeat, repeat, repeat the same old same old.
It is perfectly clear that system thermal inertia within the oceans will affect any thermal response of the Earth system for periods well beyond the past 60 years. There are multiple ocean cycles in play overlying a 1000 to 1500 year thermohaline circulation.
TSI is not the issue but they keep implying that it is via a complete denial of a climate influence from any other solar based process.
As for the assertion that over the past 60 years temperatures have ‘soared’ I find that distinctly weird given the findings of Anthony’s own weather station analysis showing the real extent of the UHI effect and the well known evidence of data tampering plus the observation that temperatures changed just as much if not more in the 1930s.
The warming stopped around 2000 as the level of solar activity decreased thereby dropping below a critical level.
Now I regard cosmic rays and sunspot numbers as likely mere proxies for other elements of solar variability and so unlikely to have any climate effect in themselves but the evidence is all over the literature in multiple disciplines that solar changes do have an effect on the underlying global climate zone distribution.
That effect then involves cloudiness and albedo changes that can affect global temperatures which are then heavily modulated by the oceans.
Continued refusal to consider such matters realistically simply blocks progress towards a fuller understanding. That is not a scientific approach.
proxies for other elements of solar variability
What other elements? and how do the affect the ozone in the stratosphere?
Wavelength and particle variations either directly or indirectly have an impact on the ozone creation / destruction balance. Not just EUV.
Wavelength and particle variations
http://www.esrl.noaa.gov/csd/assessments/ozone/2010/twentyquestions/Q2.pdf
“In the stratosphere, the process begins with an oxygen molecule (O2 ) being broken apart by ultraviolet radiation from the Sun”
No ‘wavelength or particle variations’ there. Read the link.
I encourage readers to search for and look at a wider range of sources than those recommended by Leif. The issue of the ozone creation / destruction balance is far more complex than he is representing.
The issue of the ozone creation / destruction balance is far more complex than he is representing
The ‘mechanisms’ you were peddling don’t work [as per the NOAA links I gave you – go read them]. What else do you suggest? http://disc.sci.gsfc.nasa.gov/ozone/additional/science-focus/about-ozone/ozone_cycle.shtml
From your own link:
“Scientists are finding that ozone levels change periodically as part of regular natural cycles such as seasons, PERIODS OF SOLAR ACTIVITY, ”
if you just click through to the ozone balance section.
It is not disputed that the primary cause of the ozone layer is the UV process you refer to.
However the debate is about the fine detail at the edges between net creation and net destruction. That is where solar activity with its wavelength and particle variations comes in.
There is nothing in any of your links that disproves an effect from solar variations and I understand that many scientists are now working on it so we should soon know.
There is nothing in any of your links that disproves an effect from solar variations
There is nothing in the links that suggest any effects other than from solar radiation and man-made pollutants. Solar radiation [as I pointed out] creates [and also destroys] ozone [and its variation accounts for some 3% of the total amount of ozone].
First I want to say this site entertains all of the various view points which is why it is so good. It gives us a chance to express our thoughts and ideas maybe wrong, maybe correct.
Leif here is my reasoning, and you may not agree with it.
First I want to state my bottom line is each of my solar parameters if reached should effect the amount of radiation reaching the earth’s surface and or change the albedo, modified by the geo magnetic field of the earth..
Remember only a very small change in albedo is needed to have major climatic impacts.
SOLAR PARAMETERS VERSUS CLIMATIC IMPACT.
SOLAR IRRADIANCE – at times of prolonged solar minimums this value declines maybe as much as .2 to .4 % in extreme cases such as the Maunder Minimum . Even a .1 % drop would equate to a global temperature drop of .1c to 2c, due to less overall solar radiation reaching the earth’s surface..
UV light – the light just below the visible light wavelength does penetrate the ocean surface to considerable depths which would suggest if there is a decline in UV light that the amounts of energy penetrating the oceans would subside which should result in oceanic cooling. In addition greater sea ice extent would come about resulting in an increase in albedo.
EUV light – these wavelengths being very short which have been shown to effect not only the amounts of ozone which are created in the atmosphere but the distribution as well. This in turn has been shown to effect the atmospheric circulation by a weakening of the polar vortex which in turn effect both cloud coverage and snow coverage.
A greater meridional atmospheric circulation resulting from the above causing both global cloud coverage / snow coverage to increase which if indeed is the case would increase the albedo of the earth.
Note , once the cooling becomes established I believe the atmospheric circulation several years forward evolves to a zonal flow.
SOLAR WIND – when this becomes very low galactic cosmic rays increase and there are studies that suggest this will enable global cloud coverage to increase and if true would again cause the albedo of the earth to increase. There are also studies that suggest an increase in galactic cosmic rays combined with a very low AP index seems to correlate with an increase in major volcanic activity . If true this would cause less solar radiation to reach the surface of the earth and in turn cause periods of rapid cooling.
AP INDEX – a measure of geo magnetic activity if very low months on end if interrupted with a sudden spike studies have shown this could trigger an increase in geological activity(volcanic) which again would cause cooling. The strength of the geo magnetic field in general being a factor in that the weaker that field is the greater will be the impacts of given solar events.
SOLAR FLUX – which measures the energy being emitted from sun if below 90 has a climatic cooling effect which is in evidenced during past prolonged solar minimum periods when this value was sub 90 and general global cooling took place.
To sum it up I came up with solar parameters which are at or just below typical solar lulls in the 11 year sunspot cycle and reasoned if they persist as is the case with a prolonged solar minimum periods of time would cause the earth to cool because this is what the historical climatic record indicates.
The geo magnetic field being a relevant player in present times because it is in sync with the weakening solar magnetic field which should cause given solar effects to be magnified to some degree.
I gave the reasons as to why my solar parameters would effect the climate. You may not agree with what I have suggested but that does not take away from the fact that I gave the reasons and in addition I have come up with specific solar parameter values which I think are needed to accomplish this , along with a duration of time.
SOLAR IRRADIANCE – at times of prolonged solar minimums this value declines maybe as much as .2 to .4 % in extreme cases such as the Maunder Minimum . Even a .1 % drop would equate to a global temperature drop of .1c to 2c, due to less overall solar radiation reaching the earth’s surface..
Just to pick one: a 0.1% drop in TSI equates to a 0.025% drop in temperatures or 0.07 degrees.
None of the others are quantitative and thus cannot be evaluated.
And there is no evidence that TSI could drop 0.2-0.4% during a grand minimum. In fact there is good evidence that TSI during the Maunder Minimum was on par with the minimum in 2008:
http://www.leif.org/EOS/2011GL046658.pdf
“the best estimate of magnetic activity, and presumably TSI, for the least‐active Maunder Minimum phases appears to be provided by direct measurement in 2008–2009.”
I do not believe the latest estimates on TSI changes. I say it is more.
The reason why I do not believe it , is because AGW theory is being pushed upon the public at all cost by the mainstream scientific community at large. That is sad but true and there are so many examples of false information that are being presented to the public when it comes to climate change.
So I say I would take the latest mainstream view of TSI changes with a grain of salt.
In addition the measuring of TSI leaves much to be desired/. So many revisions.
In addition the measuring of TSI leaves much to be desired/. So many revisions
Revisions are good. They assure that flaws and errors and improvements are found and done.
That you don’t want to believe what actual measurements show just shows your bias.
Common sense tells me if the sun had a period of very little sunspot activity for decades (maunder minimum )chances are solar irradiance would be lower then the .1% it drops during a normal 11 year type of sunspot cycle.
Why would the solar irradiance stop at just .1% when it goes down to that level that fast when the sun is in a normal sunspot period of time? It does not make sense since the lack of sunspots during the normal 11 year sunspot cycle which last a year or two would bring solar irradiance down by .1% in such a short time. Why if this condition persisted would the effect level off at a mere .1%?
I just do not think the sun with all the turmoil it has going on within in it and on it’s surface could be that stable when it varies from a prolonged very active to inactive state..
Why be surprised after all AGW theory is trying to convince us that a mere 100 parts per million increase in CO2 would be able to govern the entire climatic system. Sure.
Why would the solar irradiance stop at just .1% when it goes down to that level that fast when the sun is in a normal sunspot period of time? It does not make sense since the lack of sunspots during the normal 11 year sunspot cycle which last a year or two would bring solar irradiance down by .1% in such a short time. Why if this condition persisted would the effect level off at a mere .1%?
You obviously didn’t bother even looking at the paper I linked to. At least have the decency to do so.
Here it is again: http://www.leif.org/EOS/2011GL046658.pdf
Study it carefully.
…… TSI clearly peanuts, as this 2011 papers proves….. the only sensible alternative
for enhancing/decreasing Insulation, received on Earth, are the Oscillations of the Earth Orbit from its elliptical path around the Sun, see http://www.knowledgeminer.eu/climate-papers.html …… 92 W/m2 in case of a 5 Million deviation, 18 Watt/m2 of only 1 mio km
oscillation range and 9 W/m2 for a half mio km change (for a distance of 150 mio km between Sun and Earth – quite a small oscillation ), thus a little oscillation is sufficient to produce a hugh temp change on Earth.