Guest essay by Andy May and Javier
The evidence for a persistent irregular climate cycle with a period of 2400 ±200 years is strong. There is compelling evidence of a solar cycle of about the same length and phase; suggesting that the solar cycle might be causing the climate cycle. We will present a summary of the evidence, beginning with the original paleontological evidence, followed by the cosmogenic radionuclide (10Be or Beryllium-10 and 14C or Carbon-14) evidence. For more information, a bibliography of many papers discussing topics relevant to the Bray (Hallstatt) cycle can be found here. Only a small portion of the relevant papers are mentioned in this summary post.
In the November 16, 1968 issue of Nature, James R. Bray first proposed the idea of a 2600-year solar-driven climate cycle based primarily upon evidence of Holocene global glacier advances and retreats. We prefer to call this period the Bray Cycle after him, but the same cycle is often called the Hallstatt Cycle. In this post, we will use both names interchangeably to refer both to the climate cycle and the solar cycle. Bray only considered the maximum advance of a glacier field or a major re-advance that reached the near vicinity of the maximum. He used glacier fields in North America, Greenland, Eurasia, New Zealand and South America in the study. The glacial advances were dated using tree rings, lichenometry and radiocarbon dating. Glacial events for the last 13,700 years suggested an optimum interval of 2600 years. He used a “solar index,” based upon sunspots, sunspot cycle length and auroral records that covered the period from 700BC to the present day to show the cause might be a solar cycle. Over this period, the chi-square statistictied the glacial events to solar activity with a score of 28.6 (P<0.001).
While the use of changes in the rate of 14C production as a quantitative indicator of solar activity had not matured in 1968, Bray does mention that glacier records and 14C measurements correlate. He recognizes that 14C increases in periods of low solar activity and decreases in periods of high solar activity. Later researchers take advantage of this relationship to provide more evidence for the Bray cycle and to better estimate its length.
In 1988, Pestiaux, et al. found a strong 2500-year statistically significant cycle in the δ18O (delta-Oxygen-18, an indicator of air temperature) concentration in three deep sea cores taken in the Indian Ocean. Vasiliev and Dergachev (2002) reviewed the available evidence for a ~2400-year climate cycle and summarized (note the dates of the cold periods are all a bit later than the dates we use in this post):
“There are many data confirming the cyclical nature of the Earth’s climate. The study of the δ18O concentration in ice core (Dansgaard et al., 1984) showed a ∼2500-year climatic cycle to exist. A ∼2400-year quasiperiod was observed in the δ18O concentration of deep sea core with high sedimentation rates (Pestiaux et al., 1988). Similar periodic behaviour has been found in GRIP2 and GISP ice cores over the last 12 000 years. Glaciological time series indicate that the Holocene was punctuated by a series of ∼2500-year events (O’Brien et al., 1995). The Middle Europe oak dendroclimatology demonstrates that the Little Ice Age (1500–1800 yr. AD), the Hallstattzeit cold epoch (750–400 yr. BC) and the earlier cold epoch (3200–2800 yr. BC) are separated by 2200–2500 years (see Damon and Sonett, 1992, p. 378). The time positions of these epochs are correlated with the periods of large 14C fluctuations …”
O’Brien, et al. in the December 22, 1995 issue of Science describe their geochemical analysis of the Summit Greenland ice cores. The data demonstrates that cooler climates occur at roughly 2600-year intervals in the Holocene. The oldest of these events is the Younger Dryas period cooling event (12,800BP) and the most recent is the Little Ice Age (roughly 700BP to 130BP). We will use BP as years before 1950 in this post. O’Brien continues:
“Cold events identified in our [ice core] glacio-chemical series correspond in timing to records of worldwide Holocene glacier advances and to cold events in paleoclimate records from Europe, North America, and the Southern Hemisphere, as determined by combining glacier advance, oxygen isotope (δ18O), pollen count, tree ring width, and ice core data.”
A plethora of climatic proxy evidence supports a well-established ~2400 year climatic cycle. Even in 1995, using 14C as a climate and/or solar activity proxy was controversial. But, O’Brien continues:
“Although a Δ14C -climate link is controversial, a Holocene climate quasi-cycle of ~2500 years (close to our quasi-2600-year pattern), in phase with Δ14C variations, has been identified by a number of researchers examining glacial moraines, δ18O records from ice cores, and temperature-sensitive tree ring widths.”
Van Geel, et al. (1998) discusses the dramatic rise in 14C during the Little Ice Age (1300AD-1850AD) and during the Greek Dark Age (roughly 1100BC to 800BC). The history of these cooler periods is fairly well known, so they can provide evidence of the link between 14C concentrations and climate. Van Geel discusses techniques of matching 14C reconstructions with historical and paleontological evidence, like the moss species composition of peat bogs. He also provides archaeological, paleontological and geological evidence that climate change around 850BC occurred simultaneously in both hemispheres. To this point, the 14C and 10Be radionuclide concentrations in the Earth’s carbon cycle and in ice cores, respectively, have mostly been used in a qualitative way. It was difficult to use them to estimate solar activity or climate quantitatively due to problems in determining the computational parameters. For 14C, the problems are removing the long-term geomagnetic variation and estimating the total amount of carbon in the system at the time the 14C was created by cosmic rays. For 10Be, also created by cosmic rays, it is knowing the precipitation rate in the area where the ice core was cut and how it varies over time. Steinhilber, et al., 2012, explain it well, see Figure 1:

Figure 1 (Steinhilber, et al., 2012)
Steinhilber, et al. explain the problems:
“14C enters the global carbon cycle, and therefore fluctuations of the atmospheric 14C concentration … measured as Δ14C in tree rings are damped, smoothed, and delayed relative to the 14C production. The effect of the carbon cycle can be removed by inverse carbon cycle modeling. The resulting 14C production rate … is a better measure of the cosmic radiation, but it still contains a climate signal component due to unknown temporal changes of the carbon cycle … In contrast to 14C, aerosol-borne 10Be is removed from the atmosphere relatively fast, within a few years, and stored in natural archives such as polar ice sheets. Because of its short atmospheric residence time, 10Be directly reflects cosmic ray intensity variations with almost no attenuation and a delay of 1–2 y. Uncertainties are introduced mainly on annual time scales by atmospheric mixing processes and wet and dry deposition from the atmosphere to the ice.”
Steinhilber, et al. use 14C concentrations from tree rings and 10Be ice core records from both Greenland and Antarctica. Since both are created by cosmic rays, but suffer from different environmental effects, they use principal component analysis to extract the cosmic ray effect. They found that the first principal component explained 69% of the total variance and used it to model the total radionuclide production rate.
The Bray cycle appears to be closely tied to tight clusters of grand solar maxima and minima. The Little Ice Age Wolf, Spörer, Maunder and Dalton grand minima are the best example of a solar grand minima cluster and they fall in a Bray low. The Greek Dark Age and the Homer grand minimum also fall in a Bray low. Significant historical events that fall in Bray lows are labeled in figure 2. A more complete picture of these events can be found here. The Little Ice Age (LIA) is a well-known cold period filled with plagues and suffering due to cold, for more details see here and in Dr. Wolfgang Behringer’s excellent book. The period labelled “GDA” is the Greek Dark Ages, during this Bray low the Late Bronze Age ended and after a period of civilization collapse, the Early Iron Age started. The “Uruk” Bray low event corresponds with the expansion of the Uruk civilization and the growth of some of the world’s first cities. Near the end of the Uruk Bray low, the Middle East transitions from the Copper Age to the Early Bronze Age and cuneiform writing appears.
The earliest Bray low shown corresponds with the beginning of the “LBK” or the Linear Pottery Culture along the Danube River in Europe. This period marks the beginning of the end of the hunter-gatherer culture in Europe and the beginning of the growth of an agricultural economy. We are not certain the LBK and Uruk historical events were determined by Bray lows, we just mention them to position the lows in terms of human history. However, the more recent Greek Dark Ages and the Little Ice Age are well established colder periods with numerous historical climatic crises.
It is interesting that each Bray low corresponds to a major cultural transition. The LBK is roughly the end of the Early Neolithic in Europe, when agriculture started to spread. The Uruk period is when the Middle East transitions from the Copper Age to the Early Bronze Age. The GDA occurs as the Middle East moves from the Bronze Age to the Iron Age and the LIA occurs when humans transition from the Pre-industrial era to the Industrial era. Other cultural transitions have been identified in different parts of the world for these periods. Cooler and more difficult climates times do stimulate innovation. This evidence has led some archaeologists, like Weninger et al., 2009, or Roberts et al., 2011, to develop the theory that climate caused environmental stress is an engine to societal change, and they both point to the lows of the Bray cycle as some of the best examples.
Usoskin, et al. (2016, Astronomy and Astrophysics) performed a spectral decomposition of 14C and 10Be curves to 7,000 BC. Once the first component was removed a very strong, in phase, 2400-year cycle was uncovered in both curves as shown in Figure 2. The blue curve is 14C and the red is 10Be, the vertical scale is a computed “sunspot index number.” Solar grand maxima are shown as red stars and solar grand minima are shown as open blue circles. We have historical records establishing the grand minima after 1500BC, the earlier ones are based on a model of 14C and 10Be curves.

Figure 2 (after Usoskin, et al.)
Steinhilber, et al. found that using the first component of a principal component analysis eliminated terrestrial effects from the curves and resulted in a 2200-year cycle. Usoskin, et al. used a related but different statistical technique to remove terrestrial effects and extracted a 2400-year cycle from the data. Usoskin’s Pearson’s coefficient between the 10Be and 14C records was 0.77 which is highly significant (p<10-5). Usoskin notes:
“This Hallstatt cycle has so far either been ascribed to climate variability (Vasiliev & Dergachev 2002) or to geomagnetic fluctuations, particularly geomagnetic pole migration (Vasiliev et al. 2012). However, the fact that the signal we found is in phase and of the same magnitude in the two cosmogenic isotope reconstruction implies that it can hardly be of climatic origin. As already pointed out, 14C and 10Be respond differently to climate changes. In particular, 14C is mostly affected by the ocean ventilation and mixing, while 10Be (in particular, its deposition in central Greenland) is mainly affected by large-scale atmospheric circulation, particularly in the North Atlantic region (Field et al.2006; Heikkila et al. 2009). … We thus conclude that the ≈2400-yr Hallstatt cycle is most likely a property of long-term solar activity.”
McCracken, et al., 2013, also looked at the 10Be data and the 14C data together and separately. He provides the figure below showing how well they match each other at about 2300 years. In this Fourier amplitude spectrum, the 10Be and 14C Bray cycle peaks only differ by 20 years. They also match the cosmic ray modulation function (“Ф”) quite well. The modulation function is described by Gleeson and Axford, 1968.

Figure 3 (McCracken, et al., 2013)
Neither the Bray cycle nor the pattern of clustered grand solar minima are perfectly timed. Both, largely vary around a 2400-year cycle by about 200 years each way. Allowing for this, the Bray cycle lows and the clustered grand solar minima do correspond with major historical cold periods as shown in figure 2. Although the 10Be and 14C records suggest a regular pattern of solar and cosmic ray intensity, the grand solar minima and maxima effects on the Earth’s climate do not depict a dominant periodic behavior. The minima and maxima appear to be modified by other climatic factors that may, in part, be chaotic. That said, there is a tendency for the grand minima to cluster in Bray lows. Usoskin has investigated this and presents a probability function of the tendency, we show this in figure 4. Grand solar minima do occur outside Bray lows, but almost half occur within 250 years of a Bray low.

Figure 4, after Usoskin, 2016
The evidence herein and in the bibliography provided, supports the existence of both a climatic cycle and cosmogenic radionuclide cycle of ~2400 ±200 years that are in phase. The lows of the cosmogenic cycle have a high probability of containing grand solar minima of the Spörer and Maunder type. There are only two possible explanations for this evidence. Either the climate variations are responsible for the changes in cosmogenic isotopes 14C and 10Be, or the solar variability is responsible for the changes in the rate of production of both isotopes and is having a strong effect on the centennial to millennial climatic variability of the planet. The latter explanation is supported by two lines of evidence. For the period of time for which we have records of solar activity, the rate of cosmogenic isotope production correlates with solar activity, as figure 5 shows. Also, the lows of the Bray cycle represent the periods of highest cosmogenic isotope production and are marked by about half of the solar grand minima on record, including the Wolf, Spörer, Maunder and Dalton minima. To claim the isotopes represent a climatic contamination is akin to a claim that the cosmogenic isotopes do not represent a solar proxy at all. Given that cosmogenic isotopes are well established as a proxy for solar activity, that claim requires strong evidence that so far does not exist.

Figure 5 (References here and here)
Summary and Conclusions
The Bray cycle was first proposed as a climate cycle driven by a solar cycle of the same length and phase by James Bray in 1968. He correlated glacial advances (representing colder periods) around the world to a sunspot index and concluded that the solar cycle and the cold periods were linked. This was the same conclusion reached, with far more data in 1990 by Hood and Jirikowic, and in 2016 by Usoskin, et al.
At each Bray cycle low, beginning with the Little Ice Age and ending with the Younger Dryas period, there are significant historical and archeological events indicating a colder climate. In addition, Usoskin has shown that grand solar minima tend to cluster in Bray cycle lows. The Bray cycle varies between 2200 and 2600 years from peak to peak, with a most common length of 2300 to 2400 years. The cycle may be much more regular than that, the variation in length could be caused by two other problems. First, our ability to date events in the past is not very accurate, errors of 100 years or more are very common. Second, existing climatic conditions going into a Bray low and the state of other cycles (for example the 1000-year Eddy cycle and the 208-year de Vries cycle) help to determine the Bray cycle effect. A Bray low during a glacial period will be different than a Bray low today. So, the fact that we cannot be precise about the Bray cycle length does not invalidate the cycle.
While the cause of the solar cycle of Bray length is currently unknown, Scafetta, et al. (2016) have suggested that the orbits of the larger planets have a repeating pattern of 2318 years that might be the cause. Proof is elusive, but this is a fascinating area of study.
The Bray cycle has been recognized in glacier advances and re-advances, ice raft data, peat bog studies, δO18 data, and in 10Be and 14C records for almost 50 years. It is supported by historical accounts from Bray lows and archeological data. There is little doubt that the cycle exists, but its exact length and its ultimate cause are unknown. However, much work is being done that should bear fruit with time.
One inescapable conclusion, from the evidence presented, is that solar variability is an important cause of climate change in the centennial to millennial time frame. Therefore, it must have contributed more to recent warming since the last Bray low ended at the end of the Little Ice Age than the IPCC suggests.
This post is in response to Willis Eschenbach’s posts entitled “Sharpening a Cyclical Shovel” and “The Cosmic Problem with Rays.” His posts were in response to our previous posts on natural climate cycles: Impact of the ~ 2400 yr solar cycle on climate and human societies, Periodicities in solar variability and climate change: A simple model, and Solar variability and the Earth’s climate.
lsvalgaard November 25, 2016 at 11:24 pm Edit
Thanks as always for your prompt and detailed response, Leif. However, I don’t understand the above comment. The correlation between varve 10Be and sunspots is 0.12, the R^2 is 0.02, and the p-value is 0.23, and at times the 10Be, which normally should LAG the sunspot data by a couple years, actually LEADS it by five years, a net error of 7 years, far greater than stated uncertainty … I gotta say, Leif, you’re starting to sound like the solar folks making mountains out of molehills. How on earth can that have “great potential”? What kind of silk purse are you planning to make out of that sow’s ear?
I’m starting to despair here. The authors describe their procedure as:
Now, even a noob knows that you never do significance tests on smoothed data without a very close look at the autocorrelation, and a strong consideration of the Slutsky-Yule effect … but they have done exactly that. THIS ALONE RENDERS EVERY ONE OF THEIR RESULTS MEANINGLESS. Don’t believe me? Read what Matt Briggs, Statistician to the Stars has to say in his three part series entitled “Do not smooth time series, you hockey puck!” here, here, and here,
Did nobody in your workshop bring this up?
Then they go ahead and define their statistical significance level …
Why is the statistical confidence level set at 90%? The combination of that low level plus the smoothing virtually guarantees spurious results …

Finally, in the lowest panel of their data, they’ve used an 11-year boxcar filter on the data. This is a HORRIBLE filter to use with sunspot related data, because part of the time the sunspot period is longer than 11-years, and the rest of the time it’s shorter. Here’s an image showing what an 11-year boxcar filter does to sunspot data:
As you can see, an 11-year filter REVERSES THE PEAKS AND VALLEYS, but it only does it half the time, when the sunspot period is shorter than 11 years. The other half of the time it does NOT reverse the peaks and valleys. Net result? They’ve just turned their valid data into garbage, with half the peaks at random magically transmuted into valleys … and apparently, not one of the authors knows enough about statistics to even realize there might be a problem using a boxcar filter …
I’m sorry, amigo, but their statistical treatment of the data is a joke. They’ve used an 11-year boxcar filter, calculated significance without adjusting for autocorrelation, set the significance level at 90%, and calculated significance using smoothed data. Committing any one of those four statistical no-no’s marks them as amateurs. But committing all four of them?
Conclusions? Just one. They desperately need to hire a statistician to slap them up alongside the head, because at present their paper doesn’t pass the laugh test. It’s no better than the rest of the solar cyclomaniacal garbage I have to deal with. Sorry to be so direct, Leif, but it’s a terrible paper.
You said above that to find the signal in the 10Be data “is complicated”, but hey, it’s not that hard—all you have to do is just ignore a fistful of standard statistical procedures and there you are!
Is there a signal in the data? Perhaps there is, perhaps not … but they certainly haven’t demonstrated it either way.
w.
PS—you pointed me to the Finnish varve data. That data disagrees completely with the data that your cited study is using … go figure.
On the 14641 filter: it removes high-frequency annual noise so is very appropriate. The Tables show the correlation both with and without the filter so you can judge the effect for yourself. The 90% confidence level is derived from Monte-Carlo analysis of 10,000 realizations [described in paper 1, Owens et al. 2016].
On the 11-year running mean: we are not interested in treating anomalies, but in the actual absolute level of B. For that purpose the tiny ‘inversions’ don’t matter.
The main point is that the sunspot cycle is clearly seen in the B[GCR derived from 10Be] data, in phase with the B[SSN] and is hardly an artifact introduced by the filtering.
As I said: this paper is MAJOR progress.
Don’t waste your time. Nothing that comes out of a scientific article but doesn’t come out of his computer will ever look like progress to him.
It is never a waste of time to clarify matters.
It is a waste of time to say the same thing over and over again [cyclomania] and expect that repetition will do the trick.
lsvalgaard November 26, 2016 at 7:11 am
The tables show the correlation, but not the p-value, of the SMOOTHED datasets. You’ll have to point me to anything about any unsmoothed datasets because except for the following statement, I find nothing about unsmoothed correlation:
In other words, there are no unsmoothed time series being used. So I’ll have to ask for a more specific reference to the statistics for the unsmoothed data, I can’t find it.
The underlying problem is, they’ve taken autocorrelated data, and smoothed it, which increases the autocorrelation. Then they’ve calculated significance without taking into account the autocorrelation. These datasets are highly autocorrelated, and it plays hob with the statistics.
I saw your comment and I said Huh? Why would they use a Monte Carlo analysis without first showing the results of the standard analysis? So I looked back at the paper in question, the one your linked to (Owens 2016). It says nothing about using Monte Carlo analysis to establish significance. If they did a Monte Carlo analysis I can’t find any mention of it.
In fact, the only thing they say in the whole paper about statistical significance is:
There is no discussion of Monte Carlo, there is no mention of autocorrelation, there is no discussion of smoothing and its effects on statistics. Just that one statement.
So I’ll have to ask you for a more specific reference to your claim about Monte Carlo.
Finally, I see I was not clear. The problem I was pointing at is not how they established whether the data was significant at the 90% level, although that is a separate issue. I was referring to the choice of the 90% level in place of the almost universal 95% level … I know why I think they’ve done that. I say it’s because their results are NOT significant at 95% … or else that’s what they would have used. Makes me nervous.
I find that part of the graph very unconvincing. There is very little correlation between the changes in the “absolute level of B”. The
I gotta say, comparing the output of model A to model B doesn’t particularly impress me, Leif. What you mean is that the MODELED heliomagnetic field strength based on 10BE data is similar to the MODELED heliomagnetic strength based on SSN.
Perhaps I’m just a suspicious man, but I don’t see how one could dig an 11-year signal out of the 10Be data, when an 11-year signal is NOT present in a periodogram and it is NOT present in a CEEMD analysis. The idea that you could get an 11-year cycle out of that is absolutely possible, I could write a model to do it … but since the 11-year signal is NOT present in the 10Be data, I find it unbelievable that it is real.
As I said, the fact that two computer models agree means nothing unless they expose the nuts and bolts of their models and show how they have generated the 11-year cycle in the 10Be data. I say “generated”, because an 11-year signal is assuredly not in the 10Be data. So there must be some kind of special sauce to no only generate such a signal, but to have it correspond almost exactly with the modeled SSN results. Nature just doesn’t line up that neatly. Heck, as you pointed out above, sometimes the 10Be changes BEFORE the sunspots, and you just waved your hands and said there was always uncertainty … but the various computer models line up almost perfectly.
I find that highly improbable … about as improbable as their claim that all of their results, every single one, are statistically significant.
I’m sorry, Leif, but if I were a reviewer I’d recommend against publishing until they included the following:
1. An analysis of the unsmoothed data.
2. A discussion of autocorrelation and its effects on the results.
3. A justification for using an 11-year boxcar filter on data which varies above and below an 11-year period.
4. A justification for calculating significance using smoothed data. Once again I refer you to Matt Briggs, PhD in Statistics, who said (emphasis in original):
Which, of course is exactly what they did.
5. An explanation of how they turned a 10Be dataset which contains no trace of an 11-year cycle into something with a very strong 11-year cycle that almost exactly mimics the 11-year sunspot cycle. I don’t believe in magic, and I’m definitely the “nullius in verba” man.
6. A justification for the relaxed statistical standard of 90% rather than 95%.
7. An explanation of how they calculated their statistical significance.
Or I could just cut to the chase and suggest that they bring an actual PhD statistician on board so that once he stopped laughing, he could straighten them out … I’ve heard some journals are requiring a statistician vet any data-heavy papers, and it’s a good idea.
I’m sorry, Leif, but I’ve been fooled too many times, and the correlations in this study are far too good to be true. Every single result is claimed to be significant … sorry, not buying it. In real observations nothing is ever that neat. I’d have to get an explanation of their model before I believed it. Things too good to be true, like this kind of MAJOR progress, usually are.
My best to you, and my thanks for the continuing discussion,
w.
The story is along one and requires some effort on your part.
BTW, I’m not a co-author of those papers, partly because I’m tired of people saying that all this is my personal effort. It is not. It is a collective effort of relevant experts [check out the full list of authors].
Let me first deal with the Monte Carlo stuff.
Here is the money quote from Owens at al, 2016
[paper 1 http://www.leif.org/EOS/Owens_et_al-2016-JGR1-HMI-B.pdf%5D:
“The shaded areas show the uncertainty bands, determined as follows: We find the best geometric-mean fit [York et al., 2004] between B[LEA2013] (or B[S2014]) and B[OBS], then introduce a random error to each point, drawn from a two-sided Gaussian distribution, before refitting the data. This is performed 10,000 times and the 90% confidence interval is taken. The best estimate of B is then taken to be the median of the 10,000 fits.”
The relationship between the SSN and B is not modeled, but is an empirical fit, based on the raw [yearly data]. See e,g, Section 7 of http://www.leif.org/research/The%20IDV%20index%20-%20its%20derivation%20and%20use.pdf . Similarly, the relationship between the geomagnetic index and HMF B is shown in Section 5 of that paper. More details here: http://www.leif.org/research/Error-Scale-Values-HLS.pdf
As I said: the output of the workshop is MAJOR progress in our understanding of the long-term variation of solar activity and its manifestations in geomagnetic and cosmic ray variations.
the correlations in this study are far too good to be true. Every single result is claimed to be significant … sorry, not buying it. In real observations nothing is ever that neat.
The wondrous thing is that it really is that neat. I repeat: no models, no statistics needed. All just relying on good old data. I have working for 13+ years on this and have finally convinced the field’s experts that I was correct all along. You may find my first paper [published in 2003] on this of interest:
http://www.leif.org/research/Determination%20IMF,%20SW,%20EUV,%201890-2003.pdf
Essentially, nothing that changed. With 13 years more data, the relationships have only been shored up better. Very satisfying.
Leif,
Thanks very much for the link to Owens, et al. This is a major step forward as you say. Just the beginning of a new technique and more data is needed, but it looks very promising! I will watch for more.
Leif,
I find it curious that you would say that when the workshop proposal of which you are a co-author says:
“The ~170-yr record we obtain will be critical to the resolution of this debate. It will also help to substantiate the existence of the various cycles [Gleissberg (~90 yr), de Vries (208 yr), Eddy (960 yr), and Hallstatt (2300 yr)] that have thus far been identified in the longest-term reconstructions of B.
http://www.leif.org/research/Svalgaard_ISSI_Proposal_Base.pdf
Is this a case of you defending one thing in scientific circles and a different thing here?
Javier,
Leif does like to play the devil’s advocate. Perhaps it is a good way of gauging someone’s knowledge or intuition.You never know exactly where you stand with him, but the debate is always lively…..addictive even…
No, that was then, this is now. The precise goal of the workshop was to look into those ‘cycles’. As a result, the longest ‘cycles’ have fallen by the wayside.
Willis:
HMF B on annual scale [with its 11-yr cycle] was determined from 10Be here
http://www.leif.org/EOS/Caballero-Lopez-2004-JGR-HMF-B.pdf
See especially Figure 7 and 8.
Leif,
So you say here. But so far modern reconstructions of past solar activity based on cosmogenic isotopes have increased the signal for the longest cycles, not decreased it. So it looks like the longest cycles are getting healthier despite your opinion. 45 years of progress since the cosmogenic record was established, and the myth is getting stronger. Your side appears to be losing this one.
But so far modern reconstructions of past solar activity based on cosmogenic isotopes have increased the signal for the longest cycles, not decreased it.
[sigh]. Back in 2007 [ http://www.leif.org/EOS/McCracken-2007-JGR-HMF-B.pdf ] McCracken thought there was evidence for a 2300-yr cycle “The cosmogenic cosmic ray data exhibit a 2300-year periodicity, and it is proposed that the steadily increasing HMF since the 15th century represents the first quarter cycle of an associated 2300-year periodicity in the HMF.”
Research since then [http://www.leif.org/EOS/Owens_et_al-2016-JGR2-HMF-B.pdf] has erased that secular increase, so there is no longer evidence for the purported ‘first quarter cycle’ of a 2300-yr periodicity.
There is no need for a secular increase in the last 400 years to support the cycle. The cycle is based on the position of Grand Solar Minima. SGM had become more conspicuous in modern reconstructions, not less.
SGM had become more conspicuous in modern reconstructions, not less.
Not so: http://www.leif.org/research/McCracken-HMF-B-GCR.png
The black curve is the old cosmogenic-based SGM, the blue is the modern version.
You really have to keep up with the literature.
http://www.leif.org/research/McCracken-HMF-B-GCR.png
lsvalgaard November 26, 2016 at 9:57 pm
Ah, I see part of the problem. You’ve been referring to a paper that you didn’t mention or link to before. That helps a lot.
As to the Monte Carlo effort, that always sounds good, but I fear that the devil is in the details. I fail to see how merely introducing minor errors into a dataset even begins to explore the parameter space. To begin with, the results will depend very sensitively on the standard deviation of the errors thus introduced … if you add small errors you’ll get a small 90%CI, and if you add big errors you’ll get a big 90%CI.
Next, I’ve never once read of this type of a Monte Carlo analysis. Is there some kind of documentation or explanation of how you go about deciding how big an error you introduce?
Finally, it seems like that MC method is not asking the right question. I’d want to know, for SIMILAR datasets, how wide the CI results would be. The trick is to use the right pseudo-data. By “similar” I don’t mean that you’ve simply added a small error to each data point. I mean datasets with a similar structure (typically but not always done by using an ARMA model) which are NOT just a slightly shaken version of the original.
Thanks for that clarification, that helps a lot.
I’m going through the links, and replicating their results. More to follow.
As always, thanks for your assistance in all of this.
w.
McCracken and Beer describe their annual 10Be data in this paper:
http://www.leif.org/EOS/McCracken-Beer-2016-Cosmic-Rays.png
Their data can be found here:
http://www.leif.org/research/McCracken-Beer-2016-Data.xls
A teaser graph:
http://www.leif.org/research/McCracken-Graph.png
Note, the clear 11-year modulation
Arghhh…
http://www.leif.org/EOS/McCracken-Beer-2016-Cosmic-Rays.pdf
It is late…
http://www.leif.org/EOS/McCracken-Beer-2015-Cosmic-Rays.pdf
Paper here:
http://www.leif.org/EOS/McCracken-Beer-2015-Cosmic-Rays.pdf
And the data:
http://www.leif.org/research/McCracken-Beer-2015-Data.xls
Leif, thanks so much for the two links, one to the McCracken paper and the other to their dataset. It is a fascinating study, and so far at least, I’m able to replicate their results.
One preliminary question. They seem to be using 10Be concentration data in lieu of 10Be flux data … any thoughts on why? My understanding was that the flux data reflected the actual changes in the GCRs, but I’ve been wrong before …
All the best,
w.
The Concentration is the real raw data [what is actually measured]. The Flux is after trying to correct for differences in snowfall, assumed to be reflected in the thickness of the layers.
Willis,
I think something has gone wrong with your running mean plot. In places, eg 1930, 1970, the running mean is below the minimum value of the curve in nearby (±11 years) times.
Leif says
Nobody assumes that solar variability is zero. That you say things like that casts doubt on your sincerity.
Henry says
Must say it took me some time to get through all the comments, but I do remember Willis saying somewhere that the variation in TSI is so small so as to be almost zero [was it to Stefana?], hence solar variability must be close to zero.
In fact, of all the solar data, I least trust the TSI as I donot think there is any material that can withstand the most harmful rays from the sun and still measure correctly. Hence we are now in TSI version? Anyway, that degradation must be the same problem as the satellites are having [also many new versions]. I suspect there must be calibration problems with the materials and instruments in those satellites.
When looking at the sun it is best to look at the magnetic field strengths. I find it the best proxy for global max and min T.
[if only the climate science were prepared to take their eyes off T (means) as it carries too many ‘earthly factors and errors’]
http://www.leif.org/research/Solar-Polar-Fields-1966-now.png
First of all, note with me that you can draw a parabola and a hyperbole from 1970 to 2014 that would represent the average solar polar field strengths. Note the small circles that ended in 1971 and 2014. Strictly speaking, IMHO, those circles are individual solar cycles, however small they might be. Clearly a ‘circle’ cycle was formed. This is then also the reason for the relatively smaller strength of SC20 and SC24. Hence, what we are seeing in the graph is the gradual and predictable decline of the solar polar magnetic field strengths. We can take this back further with SSN another 50 years,
http://www.woodfortrees.org/plot/sidc-ssn/from:1970/to:2015/offset:5/trend/plot/sidc-ssn/from:1927/to:2015/plot/sidc-ssn/from:1927/to:1970/trend/plot/sidc-ssn/from:1927/to:2015/trend
note my linear approximation of the SSN hyperbola. Clearly there was a dead end stop around 1970.
The mechanism:
less solar polar fieldstrengths => more of the most energetic particles able to escape from the sun.
more of the most energetic particles released from the sun => more ozone, peroxides and nitrous oxides formed TOA [to protect us and protect life – [ OT: bad idea going to Mars without first creating an atmosphere….]
more ozone, peroxides and nitrous oxides => less UV radiation coming through
less UV radiation coming through => less heat into the oceans.
less heat into the oceans => it is globally cooling…..
Thanks, very interesting.
Thanks Andy.
Perhaps just to add: once you have a plausible mechanism, as proposed by me, to explain the climate variations from solar cycles, you can think for yourself of amplifications within the weather system prevalent on earth. I think Stephen is right with his thinking there.
hence, it continues
less heat into the oceans => it is globally cooling…..so the differential T between the equator and poles must be increasing.
the differential T’s between the equator and poles are increasing => basic physics [yes?]: statistically there will be more clouds and rain in around the equator and less clouds at the higher latitudes.
more clouds in around the equator => less energy into earth [remember the distribution of energy coming into earth]
so there you go: you don’t need a Svensmark theory to explain things: it is just that the position of the [most] clouds do affect the incoming energy.
IOW there are simple explanations for the amplification of warming/cooling processes.
After 60 years study of weather and climate I like to keep things as simple as possible but no simpler.
I have noted a wide variety of actual observations and sought to create a scenario that accommodates all those observations.
Whether that scenario ultimately fits long term cycles such those of Bray et al remains to be seen.
At base it is all very simple and elegant.
To change global cloudiness one must first alter the length of the lines of air mass mixing between the existing established climate Zones. By definition those zones contain air of differing characteristics from surrounding zones.
Meridional jet stream tracks are required to increase global cloudiness and such meridionality is associated with low solar activity.
Meridionality can only increase if one alters the gradient of tropopause height between equator and poles.
Tropopause height is greatly influenced by ozone in the lower stratosphere.
To achieve the observed climate variations it must follow that solar effects on the ozone creation/destruction balance in the lower stratosphere are influencing global cloudiness.
It is likely that such effects are indeed the cause of the cycles noted by Javier and Andy.
Is this comment from stephen wilde?
Yes
I’m using my iPhone which uses a different ID
Stephen Wilde: This is one possible mechanism. It cannot be ruled out with any evidence I’ve seen preparing this post. It has also been discussed a lot by Isaac Held and others. Could be. Thanks for bringing it up.
Stephen,
I also think that is the most reasonable explanation so far. The search for a mechanism that can explain climate response to solar variability is progressing along those lines, while the cosmic-ray/cloud mechanism looks like a dead end to me.
Thanks, good to have some support.
I’ve carefully gone through multiple possible solar amplification possibilities and the only scenario that draws together all the real world observations that I am aware of is the top down solar influence on ozone aspect which then alters global cloudiness and albedo.
I formed that view around 2008 and started getting articles to that effect published from around 2010.
I least trust the TSI as I donot think there is any material that can withstand the most harmful rays from the sun and still measure correctly.
Henry, scientists are not morons. We measure the degradation. How: by having multiple sensors open to the sun’s damaging rays for different lengths of time. Take the simplest case: one sensor [the main one] is open all the time. Another sensor is only open 5 minutes every day, so degrades a lot less. The difference between the two sensors is a measure of the degradation of the main sensor.
Strictly speaking, IMHO, those circles are individual solar cycles, however small they might be
No, they are artifacts stemming from the two hemispheres not always being in perfect antiphase.
Leif, you honestly want me to believe that climate scientists are not morons?
ehhhh
it is all just money and politics
must I really give you examples of this?
People measuring TSI are not Climate Scientists and are, indeed, not morons. Some commenters here are.
@Leif
You are always such an unpleasant person. You like to be nasty?
may I remind you again that we are in a PUBLIC classroom and that we are all teachers and students to each other. Refrain from being insulting, please? It reveals your mental aberrations.
For argument’s sake, for this minute, let me agree with you that TSI is fine and that everything is oki doki.
Now, the energy coming from the sun has a chi-square distribution. The question is: where does the distribution begin, exactly, and where does it end? If this were pure stats on earth, it must have a beginning and an end. My point it that the distribution is probably dynamic. IOW: it shifts left or right, as directed by the strengths of the solar polar magnetic fields which in turn, as determined by myself, is probably determined by planetary and intergalactic movement… . The area below i.e. the integral, i.e TSI may stay more or less the same but, nonetheless, there is a change in the amount of the most energetic particles being released over time.
just think about it.
Refrain from being insulting, please
But you have no problem calling Climate Scientists morons, or worse…
just think about it
Which I have done for half a century by now.
Now, the energy coming from the sun has a chi-square distribution.
No, not at all. Perhaps I’m not too far off on the moron question…
Do not forget the geo magnetic field strength which is now in sync with the solar magnetic field in that they are both weakening has a role..
I am pretty sure VERY weak magnetic fields will result in cooling because it will move the terrestrial items which influence the climate toward a cooling mode.
TERRESTRAIL ITEMS
global snow coverage
global cloud coverage
atmospheric circulation changes
sea surface temperatures
major volcanic activity
This time is a good time to test this since both solar and geo magnetic fields are weak and getting weaker.
Do not forget the geomagnetic field strength which is now in sync with the solar magnetic field in that they are both weakening has a role
The two fields have nothing to do with each other and there is no role for them to play being ‘in sync’. So, please do forget that notion.
Don’t put your trust in so-called global data sets, especially global means.
Don’t put your trust in ‘climate scientists’ like Al Gore, Michael Mann, Joe Romm etc.
Put your trust in the amount of snow and ice measured at the front of your door and when you measured it.
http://www.onenewspage.com/video/20161125/6129951/Early-snow-in-Tokyo-Japan.htm
Weather is not climate.
@leif
as usual, you ignored the [scientific] question being put to you
https://wattsupwiththat.com/2016/11/24/the-bray-hallstatt-cycle/#comment-2352607
whatever the name is of the distribution of the energy coming from the sun.
The question was meaningless [i.e. not scientific], but in my role as teacher I’ll note that TSI measures ALL there is, from zero wavelength to infinite wavelength or from infinite energy to no energy. There is no ‘beginning’ nor ‘end’ in the sense of defining a specific interval.
Many just do not have an understanding of how the climate works. They do not understand that run of the mill solar changes are not going to show up as far as showing a correlation between the two. Especially when the sun is in an 11 year sunspot cycle which in effect cancels any given effects solar activity may have upon the climate.
Many have no appreciation of the evidence of prolonged minimum solar events and the climate correlation which is shown very clearly in the historical climatic record without exception.
Many are in complete dismiss of solar secondary effects upon the climate even though there is much scientific evidence to suggest otherwise.
If one looks at the solar activity last century versus solar activity post 2005 or during the Maunder Minimum or Dolton Minimum one will see the sun was much more active last century as opposed to those other periods of time and that the temperatures corresponded.
The fact that temperatures are quite high in relative terms now , is what I would expect given the solar activity from 1840-2005. Only post 2005 has this begun to change and lag times have to be taken into consideration.
The geo magnetic field, along with Milankovitch Cycles, land /ocean arrangements sometimes work in concert with solar activity while at other times they oppose solar activity .
Lastly this fact remains, which is the sun is the main driver of the climate therefore if it changes enough it will translate to a change in the climate. I have stated many times the solar criteria which I think is needed to have an impact upon the climate.
SOLAR CRITERIA
SOLAR FLUX SUB 90
COSMIC RAY COUNT 6500 OR HIGHER
SOLAR WIND 350 KM SEC OR LOWER
AP INDEX 5 OR LOWER
IMF 4.2 NT OR LOWER
EUV LIGHT 100 UNITS OR LESS
SOLAR IRRADIANCE OFF BY .15% OR MORE
the sun was much more active last century
No, not so:
http://www.leif.org/research/Comparison-GSN-14C-Modulation.png
Looks as if the 20th century comes in a close second to the 18th century, with the 19th trailing, and not just because of the Dalton Minimum, but from a lower high as well, and the Maunder Minimum-dominated 17th century a distant last.
This solar activity mirrors the CET, which shows the recovery from the MM in the early 18th century to have warmed more rapidly and for longer than the late 20th century warming.
Yes it was more active last century COMPARED to the Maunder Minimum and Dalton Minimum and from 2005 to present. That is all I am saying I do not care about the other times.
Honest people WOULD care about the other times, instead of just cherry-picking what they like.
During the Maunder Minimum there were no sunspot to drag TSI dow, but there was a strong magnetic field anyway. We know that from the strong cosmic ray modulation during the M.M. and from the fact that there was a strong solar wind. We know that from the fact that comets were observed to have long, straight tails [dragged out by the solar wind]. So with magnetic fields still present [which increases TSI], but no spots [which decreases TSI], it is entirely possible that TSI during the M.M. was HIGHER than today. So the solar influence [if real] should have produced higher temperatures back then, contrary to observations…
1700 to 1800 was also a warming period.
When the geo magnetic field is weak along with the solar magnetic field weak this will compound given solar effects.
On the other point I do not think the solar magnetic field strength has anything to do with the geo magnetic strength they are independent of one another.
It is just coincidence that they are both weakening at the same time presently.
The thing about Leif is he does address everyone and I he believes what he says. I rather have someone disagree with me then agree because you get the whole picture, although I may strongly oppose that view point..
I will defend my position until proven wrong by the data , not what someone else may or may not say.
The climate arena is very complex and almost any argument even AGW can be made to look correct.
I hope data going forward will clarify more the various theories we all have.
Plausibility and the null hypothesis rule here.
Your proposed driver must be capable of this: To change a climate regime from cool to warm, or warm to cool, would take an energy source quite large and capable of variability all on its own. Weather tells me that. Simply scrubbing out an entrenched atmospheric pressure system parked off the West Coast is no easy feat. Now extend that to a climate regime shift and the energy required to keep it there beyond long term weather changes. If your mechanism depends on an amplifier (and all solar ideas depend on an amplifier, as does the anthropogenic CO2 proposal), because you have chosen a driver so small as to be a needle in the haystack, the plausibility of your premise is so weakened as to send it to the round bin of pure conjecture. The source of the significant on-the-ground energy change required to move weather into a climate regime shift must be, by design, very, very large, and the energy changes very, very large. While the Sun is large, its variation in energy on-the-ground is very, very small.
Your proposed driver must be capable of ruling against the null hypothesis. Why? Because natural intrinsic variability (the planet is highly variable in its own right) is King and must be ruled out as the intrinsic driver at greater than a 50/50 chance. Specifically, you must rule out the ocean’s capacity, teleconnected to the atmosphere, for heat storage and release over extensively long time scales. After all it is a very, very large source of stored energy, and its variation in on-the-ground energy released/stored, is very, very large.
Not ONE solar driven climate post has provided plausibility or refuted the null hypothesis so I dismiss the conjecture out of hand without the need for critique of methods or results.
Jack Eddy came to the same conclusion late in life, as he told us at a dinner-talk at a meeting in Sonoma in 2003.
Maybe the millennial cyclic uptake and release of ocean-stored energy that plausibly has driven the past 800,000 years of stadial/interstadial periods should be called the Eddy Cycle.
The ‘Eddy Minimum’ is already [by the Solar Division of the AAS] reserved for the coming centennial minimum, so having two Eddy-things might be confusing…
Or go the whole hog and rename the North Atlantic Gyre the Eddy Eddy, too.
Too bad it is going to be such an unremarkable solar minimum, so far from a Solar Grand Minimum.
since 1600 we have only had one Grand Minimum, the Maunder.
Your opinion which is fine.
Pam according to you, many others do not agree.
Speaking only for myself, I agree. The 2400-year Bray climate cycle exists and it is there for all to see (except for Willis, of course) in multiple lines of data. It is also global (again multiple lines of data), thus the idea that the cause is extraterrestrial. But, is it the sun? Or something else? Could it be a natural cycle on the Earth that is global? Is it an orbital variation? You are correct, it has to be powerful, what ever it is. It is hard to imagine it being very subtle with the large, recorded effects. I suspect we will figure out the cause with time, I hope I live to see it. Some say it is a small solar change that occurs over a very long period of time and oceans store the extra heat and the cycle is actually an ocean cycle. Not sure how that works.
I’m sorry, my previous post was for Pamela Gray. My bad.
leif says
but in my role as teacher I’ll note that TSI measures ALL there is, from zero wavelength
henry says
there is no humility there\\
neither is there zero wave length//
but I still take it that you agree with me that the beginning and end of the [chi-square] distribution of energy coming from the sun is defined by nature [God]
Of course there is zero wavelength when you define an interval, e.g. from 0 nanometer to 400 nanometer is the region with smaller wavelength than visible light. The shape of the distribution was found by Max Planck in 1900: http://hyperphysics.phy-astr.gsu.edu/hbase/mod6.html#c4
and has nothing to do with gods, but can be derived from simple physical considerations:
https://en.wikipedia.org/wiki/Planck's_law#Derivation
Leif
You did not answer the question. Again.
What question? Always refer to what you are commenting on.
P.S. Some ‘questions’ are meaningless, what is yours?
never mind
no mind
Javier November 26, 2016 at 5:39 am Edit
And yet you are unwilling to provide a link to the study and the data of even one of them …
More random claims with no links and no dataset, and a graphic with nothing but wiggle-matching. However, I figure this might be the best I’ll get, so I tracked down your paper. It is NOT an analysis, it is a meta-analysis of a variety of claims. So you’re not even quoting the original source of your graph.

I figured I’d take a look at a sampling of the claims in your linked paper. Here are the results of six investigators, showing the times that they claim are the cold phase of the Bray cycle …
Each horizontal line shows the claims of a single study, with the principal investigators name. The black lines are the intervals identified by that investigator as being the cold part of their own personal putative “Bray Cycle”.
The beauty part of their results is that no matter what date you pick, it fits with somebody’s “Bray Cycle” somewhere. Given those claims, everything is a Bray cycle.
Not only that, but they have not done even the simplest investigation of previous claims. If a paper made it through peer-review, as far as these good folks are concerned, it’s 100% gold …
Nor have they seemed to notice this kind of thing (quotes from your link, emphasis mine):
and
and
So they’ve conclusively demonstrated a Bray cycle with a period that can vary from 1500 years to 2500 years … how on earth is this a) useful, or b) science? Something that varies from 1500 years to 2500 years is not a cycle, it’s a variable signal generator.
Gotta say, Javier, if this is a sample of the junk you are basing your belief on, I can see why whenever I ask for two links to your solidest evidence for the Bray cycle, you get real nervous ..
Oh, you poor fellow! You refuse to submit your claims to examination because you’re gonna melt under the heat of the questions, or because someone might be less than laudatory about your work, or because I said mean things … really? Do you want a “safe space” to discuss this, like the college kids who couldn’t face the election results, complete with comfort puppies and chocolate? (NB: some US Colleges actually provided this for their students after the election, including the puppies …)
Javier, science is a blood sport. One man is trying to falsify another man’s ideas, ideas which may form the basis of the other man’s entire scientific life’s work, or may be crucial to his continued employment. The idea that you will find this process pleasant is a dream. There is nothing “nice” about a debate when a man’s life work may hang in the balance.
I’ve explained before why I do it this way, Javier. It’s because if I just grab some random study about the “Bray Cycle” and I demonstrate that it is junk, you’ll just say oh, that’s not the real study that shows the cycle. So I started asking people directly, “What is at the basis of what you believe?”. That way, when they point to whatever is their strongest evidence for their belief, we can test the strength of their evidence directly.
I’m sorry, but in 2016, anyone who blindly and stubbornly rests his claims on the “peer reviewed published scientific literature” is a fool. Read Ioannides.
But in any case, Javier, all I’m asking is WHICH PEER REVIEWED PUBLISHED SCIENTIFIC RESEARCH is at the basis of your belief. I’m not trying to change how you “back up your claims”. I’m trying to see if the scientific study you depend on the most, the study that you consider the best of the best, is made of sand.
Leif Svalgaard was willing to put his claims out into the open by providing a link to what he thought was one of the best studies of 10Be. That’s what scientists do. They answer questions about their beliefs. They don’t whine about how people will treat them if they reveal the studies upon which they rest their claims. They don’t wave their hands and point to fifty documents and say “It’s in there somewhere”.
They back up their beliefs and claims by identifying the study that supports them. That’s what scientists do, and that’s what you are unwilling to do.
As to whether plenty of people think I have an “appalling lack of knowledge”, somehow the Editors and the peer reviewers at Nature magazine didn’t think so … you’ll excuse me if I take their word over the word of some anonymous internet poster …
Look, Javier, it’s not rocket science. I’ve asked you to back up your claims. You refuse to do so. Not only is that not rocket science … its not science at all.
Sadly,
w.
Willis, we have provided ample “back up” for our claims. Just because you refuse to read the papers in the bibliography (our “back up”) does not mean we didn’t provide it. As to data, in my experience if you email the first author they will send you their data or provide you with a link. Sorry, we will not do your emailing and secretarial work for you. If you want the data, write your own emails. That entire bibliography was made with you in mind. If you don’t like it, I’m very sorry I spent the time on it that I did. But, it is our back up and it is all we will do. You need to do some work yourself and back up your claim that there is no Bray climate cycle. To the best of my knowledge you are the only person to make such a claim and I’ve been through almost 50 years of papers on the subject! One can easily dispute a connection between the sun and the Bray climate cycle – I will not contest that, not enough data to make that link. But, the existence of the Bray climate cycle is not in dispute as far as I know, except by you. I think we’ve answered all of your queries, perhaps not to your satisfaction, but we have provided answers and abundant “back up.”
No Willis. I refuse because this is what you do with the data:
https://wattsupwiththat.com/2016/04/27/steinhilber-2009/
There’s 9360 years of data in the original file that I gave you the link. You took only 250 years and plotted them at a scale that makes it impossible to detect solar variability. You call that your analysis. I am not stupid enough to play twice by your rules. You cheat.
You are heavily biased and it shows. You like to play with the data without doing the hard work of knowing the science, and when challenged you want people to play by your rules that you then manipulate to your advantage. And when someone points how ignorant you are of the things you like to talk, your response is usually ad hominem attacks and insults. Your strategy might be good enough for a place like WUWT where most people know even less than you do, but to science you are absolutely irrelevant. You claim you want to make a lasting contribution to scientific issues and as usual what you are doing is just the opposite. it would be best for everybody if you just limited yourself to write about the things you know best, the sea and yourself.
Javier November 26, 2016 at 2:40 pm Edit
Ah, I see. You’re falling back on the tried-and-true Phil Jones excuse: “Why should I give you the data when all you’ll do is find fault with it”.
Didn’t work for Phil. In fact, it has ruined his reputation as a scientist.
Doesn’t work for you either, and it’s not doing your scientific reputation any good. What I might or might not do with the data is immaterial. I might use it for bumwad, but that doesn’t matter.
Science is transparent or it is not science at all. Transparency means YOU GIVE YOUR DATA AND INFORMATION FREELY TO YOUR WORST OPPONENTS, regardless of what they might do with it. If they can’t find problems with it, you’re likely home free. I’m sorry to be the bearer of bad news, Javier, but a scientist can’t just give his results to his friends so they can tell him how brilliant he is …
Plus which, you’re hugely misrepresenting what I did. I did NOT just post the one graphic you show above. I also posted a closeup of the same data.
I provided those two of what I called “first cut graphs”, a closeup view and a view from a distance. I didn’t even comment on the graphs, because I was heading out the door for the South Pacific. Nor did I call it an “analysis”, it was just a couple graphs.
So I figured I’d put up the two graphs and let people discuss them. That way, I figured I couldn’t be accused of affecting the discussion. I just provided a couple of views of the data, and left for Fiji.
To claim that me posting two graphs and asking people to discuss them is “heavily biased” and makes me “a cheat” is simply a measure of your desperation. Posting two graphs and asking people to discuss them is not scientific malfeasance of any kind. It’s not cheating, it’s not biased, IT”S SIMPLY A CLOSEUP AND A DISTANCE VIEW OF SOME DATA.
Sheesh … no pleasing some people.
And you making that pathetic excuse the reason you’re running away from simply telling me what you think is the one best piece of evidence in your bibliography?
Sadly … in your case, that’s just typical.
You do know that you can end this at any time by simply giving me the two links, right? So … why not do it, and get rid of me?
The world wonders …
w.
What a silly argument. I have exactly the same access to data that you do. I am as much an outsider to solar and climate research as you. Therefore i am not refusing any data to you. The only one here that has privileged access to data here is Dr. Leif Svalgaard, so if you need something that is not available ask him.
Andy May November 26, 2016 at 11:49 am
I thank you for your hard work, but I didn’t ask for a bibliography. I asked for what you consider to be the best study. You see, if I pick one out of your bibliography and point out that it is not meaningful, you’ll just say oh, I didn’t look at the right one.
As evidence of this, I did look at one. It had NOTHING TO DO WITH BRAY, didn’t mention it once. What did you tell me in reply? Oh, that wasn’t the right one …
Andy, I don’t want to “really dig into the subject”. I want to see what you consider to be the single best evidence for the Bray cycle, not the fifty top contenders.
Yeah, I just took a look at that above. The investigators of a mere six of those gave dates for Bray minimums that cover the entire period back ten thousand years … not impressed.
Providing evidence for your claims is not my “homework”, Andy … it’s yours.
You have not given me one damn link to one scrap of data, Andy, so don’t try the moral high ground on me. I asked for TWO SIMPLE LINKS, one to the study you think is best, and one to the data used in the study.
It’s a bozo-simple request, Andy, for you to back up your claims with whatever study you think is best. If you’ve got it, you could shut me up easily by just posting it … so it is a mystery to me why you are wriggling so hard to get out of doing that simple thing.
Why not get me out of your hair by simply linking to the best study you know of and its data? What is so damn hard about that?
In mystery,
w.
Again Willis, the bibliography and our posts are the back up.
I know that, Andy, but thats not what I asked. I asked which one of the 93 studies in the bibliography is the strongest in your opinion? I’m shocked that you are refusing to answer, it’s a very simple question.
w.
Willis,
It is the wrong question and it demonstrates that you don’t understand how science works. It is the accumulated knowledge from many studies what makes such a strong case for both the ~ 2400 year solar and climate cycles. That work is integrated in review articles. But you complain the review articles do not contain data but pretty images.
This is your problem, not ours, to solve. Your claims that there is no evidence for both the ~ 2400 year solar and climate cycles are based on your ignorance of the evidence. If it is important to you educate yourself. If it is not, admit that you don’t know, or at the very least do not write articles about what you don’t know to confuse people.
Willis, Javier is exactly right. This is scientific research in progress. If it could be summed up in one dataset or one paper, we would not be doing this work. It would be in textbooks and done. Our summation post is the best one paper summary you will get at this time. Otherwise you have to read all 90+ papers. The data we used covers many disciplines, history, paleontology, sedimentology, geology, physics, archaeology. The work on climate and solar cycles is still new and fresh. If you have trouble finding pdf’s of any of the papers email me and I will send them to you, I have pdf’s of all of them. I shouldn’t post them on my web site, I’d get into trouble with some of them. But, it is legit to email the pdf’s to one person. That is the best I can do. You are asking for a simple grade school solution that doesn’t exist for this problem. Stop pestering us for one simple paper. The paper does not exist, you need to do more reading and less commenting and complaining.
This is scientific research in progress
A hallmark of scientific research is that you also present opposing views and data [if any] and not just the papers that support your claim. So, have you found any papers that do not agree with your suggestion?
Leif, I didn’t find any. Maybe Javier did. Do you know of any that try and disprove the Bray climate cycle? Obviously, the solar cycle is debatable, so is the link between the two.
I haven’t looked closely [as cycles are not my cup-of-tea], but it is a bit suspect that you haven’t found any. Perhaps some confirmation bias has crept in? The closest I can come to debunking the cycle is McCracken’s paper I linked to, where in 2007 he thought he saw the 2300-year cycle, but the reconstruction back then was flawed, and in his latest paper, the 2300-yr cycle is gone. Now, I grant that scientists usually don’t dwell on past failures, so perhaps that explains the dearth of opposing papers that you find.
“Again Willis, the bibliography and our posts are the back up.”
This reminds me of the types of answers Phil Jones gave to Willis.
Luckily Willis could FOIA Jones and fight to get the supporting information.
Also, this reminds me of Steve McIntyre;s fights to get the Papers the IPCC relied on entered
into the TSR.. In the end the IPCC had to make all the papers available.
But this is blog science ( Popper and Feynman would roll over in their graves”
In Blog science you never have to supply the supporting details.
Its worst than a high school science fair
So you had 95 papers?
Please supply the data you checked when writing about those papers…
Oh… you didnt check the data or the code of those 95 papers.
Castles in the sand….
Mosher has a point, if Javier wants to claim 95 papers he wrote, but won’t reveal the papers because he wants to protect his anonymity, then perhaps it’s time I do so. Javier can’t have it both ways.
Well, I’m open to reading any paper that presents arguments that the cycle doesn’t exist. But, since it seems to be present in all subject areas Javier and I looked at, I will assume it is there. I think we all should.
Steve Mosher and Anthony Watts: There is no data that I’m aware of. This post was and always has been a summary of the Bray cycle 48 year history in the literature. Javier and I read many more than 93 papers to prepare the summary post, but did no, repeat no, original research. Javier may have requested data from the authors, but I did not. His other posts present some original figures and data, but not this post. You can contact him about the data in his other posts, which were not posted on WUWT. This post is, and always was, a summary of the literature on the subject.
Then, I carefully culled the papers to select only the most important and built a bibliography. The bibliography IS the data and it is there for all to see and read. Most, if not all, of the papers are available in the public domain through google scholar. Any paper that either of you or Willis cannot find, I will email you. Obviously, due to copyright laws I cannot post them on my web site, but I think it is legitimate to email them to individuals for research purposes.
Anthony – Javier has not claimed he wrote 95 papers on this subject. He (and I) claim we read 95 papers and we have summarized them in this post. That is all of our data that I know of. To the best of my knowledge there is no paper out there that provides any evidence that the Bray climate cycle does not exist. If you or anyone else knows of one, I will read it and let you know what I think about it. As far as I know, this whole Kurfuffle is because Willis does not want to read the papers in the bibliography. I repeat, THERE IS NO OTHER DATA! Everything in this post is published in the papers in the bibliography and fully explained in those papers. This has been stated in comments previously by both Javier and myself. No one has presented any evidence otherwise.
Good enough for me.
Leif,
As far as I am aware everybody that has published data analysis on the Hallstatt cycle in cosmogenic records claims it is there. I suppose if someone did not find it, they didn’t publish it.
I have no access to any data that is not within the publications or linked in the publications or in the main data repositories. I have not asked anybody for data on this issue. So whatever data I have access, Willis and Mosher also have it.
While everybody is aware of the climatic contamination issue that you raise, Willis position that the cycle is not present in 14C data is, again to my knowledge, not defended in the scientific literature. This is a well established fact since Damon’s times.
All the data discussed is in the papers. Your suggestion that to talk about a paper it is necessary to check its data is ludicrous. What a waste of time. Science is auto-correcting and bad data is constantly substituted by better data. When one talks about papers that are 60 years old, as we do, that have been confirmed many times over the years there is little need to waste time checking its data.
By the way, the bibliography has 39 papers in it, culled from roughly 95 that we have read. I can supply addition bibliographies that contain the other papers if anyone wants to see them. But, so far we are having trouble getting anyone to read the 39!
Willis is quite correct to show how stable the Sun is. There is no evidence whatsoever that suggest that the curve would be any different several thousand years before the data shown. There is good evidence that even the Maunder Minimum wouldn’t show up on this plot, e.g. that the minimum in 2009 was on par with the Maunder Minimum values [Schrijver et al., 2011].
Only your opinion which is fine but many see it different.
So, have a different opinion.
Opinions are not science.
“opinions are not science”
Yes, he’s got you there.
The question is not how stable the Sun is. If it wasn’t we wouldn’t be here. The question is the influence on the climate of the small changes in solar output that we know happen. You cannot get out of that question by pointing that the Sun is very stable. It is a travesty of analysis. A joke.
Very true
@javier\
sorry, I was in the middle of doing our barbecue, so I could not elaborate on my comment,
but you were hitting at the truth. E#ssentially, this was also my question to Leif. But I [think I] can answer the question myself:
Obviously, if [on the issue of light/energy coming from the sun] we move away from the wavelength theory to the particle theory, then there is no zero wavelength. Every particle coming from the sun must have some size. We also know that the lowest size particles carry the most energy. So, what I am saying is, that even if TSI were to be completely correct and trustworthy, [which I doubt due to a variety of reasons]
it is possible and it seems plausible to me that the [chi-square] distribution of energy [as seen coming from the sun TOA by the satellite] may shift a bit to the left or to right, depending on a number of factors;
it may look like there is no change in the amount of energy measured [i.e. the integral of area below the curve is still more or less the same], yet there has been a change.
if it shifts left [in a time of cooling] like now, it actually feels like the sun is hotter. That, to me, was the main paradox: sun is hotter but now earth will be getting cooler?
go figure
[it is always amazing to me seeing God at work in nature- there must be a plan\]
I think if the sun reaches my criteria global temperatures will go down and if they do the ones that disagree will have to explain and prove why this is not so. At that point of time I will be very confident and really push my thoughts to the public and I will have the proof I said it before it happened. which matters very much.
You have to say it before it happens.
if the sun reaches my criteria global temperatures will go down
Even if they do, that is not evidence that you are correct. There could well be other reasons for the drop.
Apparently “confounding factor” is not a term in Salvatore’s present research variables lexicon.
The Sun moves through the surrounding interstellar cloud at a relative velocity of ∼ 5 AU per year.
In 12,000 years, the solar system has traveled nearly a light year. wow
In that period of time we could suppose there were periods of changes with respect to:
direction of interstellar wind impacting the heliosphere
varying strengths of Interstellar magnetic fields
varying strengths of GCR and densities of GCR and accompanying dust
varying densities of other elements O H He Ne etc.
Wonder what shape the heliosphere would have if the Interstellar wind was coming from the tail direction? The wind on our backs so to speak. Instead of it being a headwind.
Sun in free fall with an interstellar wind pushing us along, no resistance, no compression? hmm just a thought that conjures up a weird solar cycle.
Wonder what shape the heliosphere would have if the Interstellar wind was coming from the tail direction?
No need to wonder as it is the interstellar wind that creates the tail. So the tail will ALWAYS be in the direction the interstellar wind blows.
lsvalgaard November 26, 2016 at 7:38 pm
Wonder what shape the heliosphere would have if the Interstellar wind was coming from the tail direction?
No need to wonder as it is the interstellar wind that creates the tail. So the tail will ALWAYS be in the direction the interstellar wind blows.
————————————————————–
Thanks Dr. S. I considered what you said and agree but, don’t you think there would be 2? An outer tail created by the interstellar wind in one direction and an inner tail created by the solar free fall motion in the opposite direction.
This condition would exist if the interstellar wind direction and solar motion direction were the same. Instead of opposed.
Fuel for my bias below…lol
lsvalgaard November 26, 2016 at 1:25 pm
”’It is pretty well generally accepted that there is a climate signal in the 10Be data, check out the discussion in the Varve-paper I linked to, and the Owens paper on heliospheric magnetic field determination, referred to earlier. Or the papers by Webber and higbie that I have referred you to in earlier posts. This last paper has had problems with publication because it exposes an inconvenient truth [the climate signal in the cosmic ray proxies].”
Those pesky cosmic rays.
Are cosmic ray spallations occurring in the satellite environment where TSI i measured?
Cosmic rays as a modulator, just a thought.
inner tail created by the solar free fall motion in the opposite direction.
No, as the solar wind moves with the Sun. The sun [and its wind] is orbiting the center of the Galaxy, just like the Earth is orbiting the Sun. You probably mean something else by ‘free fall’ than is usual in physics: a body is in free fall if only acted upon by gravity. The interstellar medium is also in free fall.
Nir Shaviv wondered what happens when the sun moves through a spiral arm of the galaxy where GCRs are very high. And what he found out from the geological record was at those points in time the earth is an ice house.
That’s a very interesting explanation for the ~ 150 million year cycle in Ice Ages.
Oh boy another CYCLE! I’m starting to feel like George Carlin when he did is skit on STUFF! Just get more STUFF! Or add another CYCLE!
I remember Shaviv saying that it takes about 250 million years for the sun to orbit the galaxy. And if you look at a “representation” of where the sun in the galaxy is, it’s orbit, and where the spiral arms are, it would not cross all four arms exactly at 62 years or so. And then there is a spur (or mini-fifth arm) that the sun crosses as well. So you would not get exact periodicities.
But the evidence from meteors is very compelling (convinced my PhD biophysics brother) that there is major bombardment from GHCs at certain points of time.
I couldn’t think of the geologists name who teamed up with Shaviv when I wrote this post but I recall it now. Jan Viser is his name. You might look them up. I am not a scientist. Just a lawyer who lurks and finds the sun fascinating. But to a layman Shaviv made me think Svensmark was on to something with GHCs.
Everybody is so sure that they are correct. Guess what no one knows who is correct and who isn’t but maybe going forward we might find out.
One can be correct for the wrong reasons. So, only when someone comes up with a mechanism that explains quantitatively [with numbers] why (s)he is correct will we know. So far, it doesn’t look like anybody is even trying.
Leif I have come up with the numbers and a prediction. I have said if solar criteria reaches my low average values the climate will respond by cooling.
In addition I am saying this is happening now and that the solar effects are being enhanced by a weakening geo magnetic field.
Now if the low solar average values come about and the climate does cool I am going to have a very strong case that what I have been saying is correct. Especially if the terrestrial items I keep mentioning that would be influenced move in the direction I predicted.
If this occurs all of those who see it differently will have the burden to say why this is not correct.
I say the global temperature trend is already in the process of a reversal.
I think I have been quite clear and definitive and not saying oh someday this will happen because of this or that or try to spin it by manipulating the data or trying to make the data fit into my theory, or changing my criteria.
I have stayed steadfast on my criteria and the expected result.
Unlike so many others who never will call a turn but instead put anything that may happen way off to the future which to me is meaningless and leaves so much wiggle room to spin and modify, I am saying now, today.
I think at least I have stated my case ,made my call and now am prepared to live with the result.
My only requirement being all the solar parameters I have called for must come about and have a duration of at least six months or greater, following at least 10 years of sub solar activity in general which we have now had.
The sun being much less active post 2005 and I think a Dalton Minimum is possible which would put solar criteria at the values I have called for, for a very long time.
Those are not “numbers” in the sense Leif, I think, is referring to. He is asking for energy needed/energy supplied for any climate regime shift hypothesis. You have stated neither.
Pamela. Svensmark’s theory does not rely on energy changes from the sun. It is based upon how many GCR’s hit the earth. Nir Shaviv has purportedly shown in the geological record, that when the sun moves through the spiral arms of the galaxy where GCRs are extremely high, the earth freezes up and becomes an icehouse for millions of years at a time. That would require no energy change from the sun. The spiral arms are the extreme cases of GCR bombardment. But if they significantly change climate in extreme cases, then the obvious question is what happens when the case of bombardment is not extreme.
I watched years of research go up in flames my dog and everything I own. it seems like everyone wants to put the boot in… I’ll remember “it doesn’t look like anybody is even trying” remark, btw I ran into a burning building 3 times in a futile effort to save my hound…
Pay attention Lief…
…… indeed, the Sun is STABLE in OUTPUT, one point for Isvalgaard,
solar variations are peanuts:
3 – 4 Watts on/off the 1361 Watt/m2 mean value received on a hypothetical
1 m2 size “surface frame”, hanging perpendically in space, the top of
the atmosphere. which further has to be divided by 4 to obtain the
Watts per 1 m2 frame on the Earthen surface, from which 30% albedo
(reemission back into space) has to be subtracted……what remains left
are the peanuts of max. 0.7 Watts solar change received on the Earth
surface…..
WHEREAS the Earth Orbital Changes produce hugh Watt-differences
betwwen 1320 and 1407 Watts within the year, thus 90 Watts variations-
not the peanuts as pointed out above- The Earth Orbital Changes do
the job of global warming and global cooling…
see http://www.knowledgeminer.eu/climate-papers.html…With the
Earth orbit a couple of million miles further out in space around the
sun (3%), as encyclopedic values.explain (only at both ends of
the minor axis, the major axis is a constant) we will not get
only to the Little Ice Age but into the Great Ice Age as well, and all
talk of a Maunder sunspot great minimum (starting 1645) is futile,
because the real cold started already 1602… with the Agyptian Nile
and the Bosporus solidly frozen in 1622 BEFORE the sunspot started
to go down.
For this reason, the Earth orbit has to be scrutinized: The orbital line
is a spiral, which winds around the elliptical advance line (known,
measured by Issak Newton, Leibniz and Carl Gauss. Gauss measured
4 years in order to derive a spiral Earth advance formula, failed, but
through his calculations, invented the least squares method)
….. This classical knowledge is still being suppressed by “climate
scientists” in order to “STEAL” global warming/cooling from the spiral
orbit and “DONATE” it to atmospheric physicists..The worst are the
guys from Louvain, Belgium (von Yperselen, Cruzifix, Berger and all
those who deal with Milankovitch… who achieved to suppress the
spiral Earth movement by means of their papers) ..
Even Willis fell for this astronomical scam, reckoning that there is an
atmospheric “godly thermometer based on tropical storms” to produce globalwarming/cooling…..
…… as the Sun/C-14, Be-10, TSI only produce meagre proof, bad
luck for Javier,…..Time is right now to scutinize the Earth orbit. JS
The change in total w/m2 calculated from orbital changes is not enough to shift climate regimes. See my post further up on that issue.
It’s albedo changes Pam, as a result of all the various items I brought up. You and others if it turns out the way I am saying will have to prove me wrong.
Pamela…..those calculations done by Berger, Cruzifix, Loutre
and all the others from Louvain DO NOT include the SPIRAL MOVEMENTS..
.Their calculations are wrong because they OMIT the true spiral 3-D orbital
advance of Earth around the Sun…..
Read their papers again…..they deal ONLY with the elliptical flight line
WITHOUT the spiral component….
THE EARTH´S ADVANCE IS A SPIRAL ADVANCE, which is omitted on
purpose by the Louvain guys….. you want me to sing this out?
Please check out: (1) The Earth´s flight is a SPIRAL, (2) this spiral is NOT
considered (thus left out) by those Milankovitch-followers, because
Milankovitch himself left this spiral flight line OUT and they have not
brought it in in order to remain with Milankovitch pure and not contradicting
him in respect to the dynamics of ice ages…..
For this reason, the warming/cooling caused by the spiral advance (so-called
OSCULATION Movement) ….[Osculation – correct] remains largely hidden today,
achieving the atttribution of climate change to tropospherical causes..or to
the man-made CO2..the AGW crowd refuses to look into the Earth orbit,
because orbital calculations would reveal the 5 true climate drivers, which are of astronomical origin….
Orbital indices cause summer and winter. when did you become a Moron
weltklima November 26, 2016 at 8:02 pm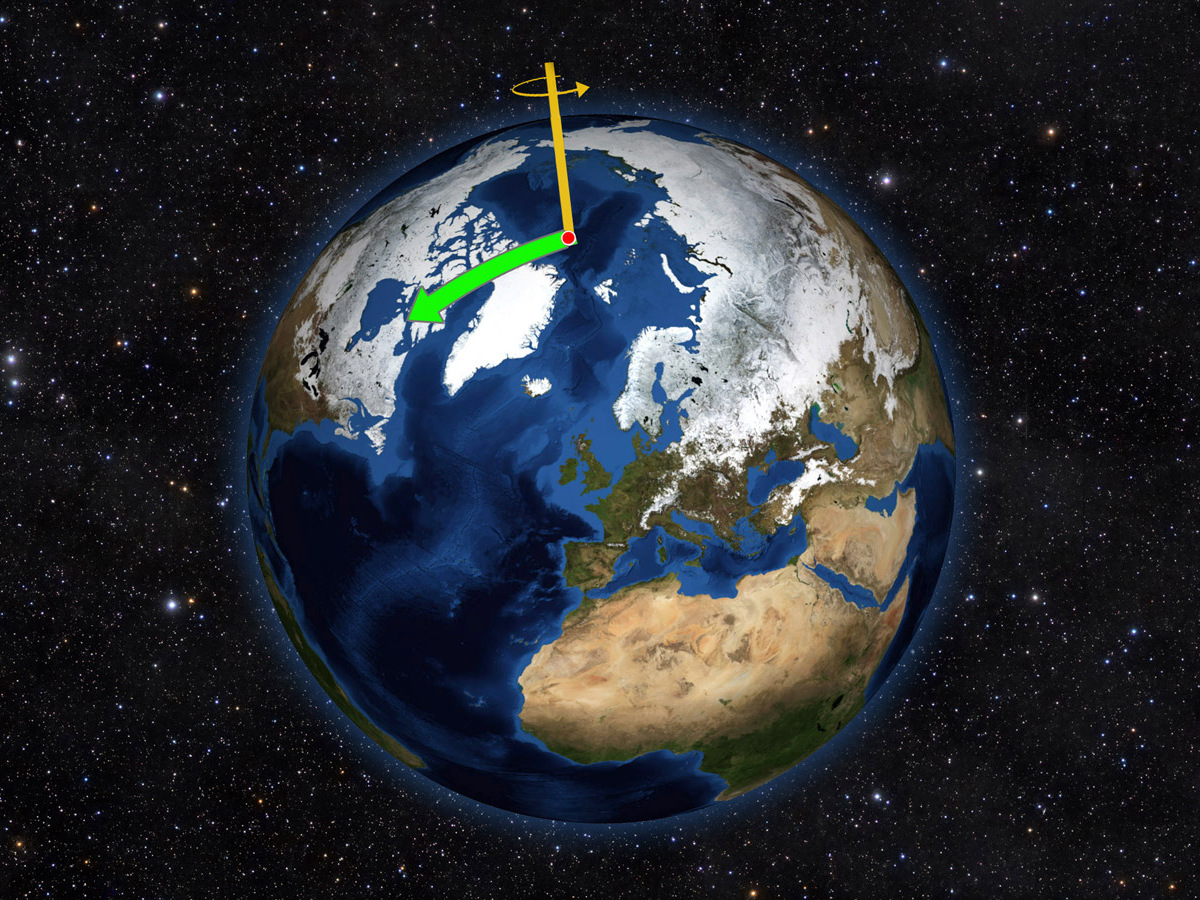
——————————————————–
have you googled to see what or if the current studies are reporting concerning minor orbital changes.
If maybe there is a solar component as suggested in some studies related to Earth rotation.
Rotate faster you might have a tighter more concentric orbit.
Rotate slower and become more eliptical and wobbly.
This could produce changes in rotational axis angle.
Earth does not always spin on an axis running through its poles. Instead, it wobbles irregularly over time, drifting toward North America throughout most of the 20th Century (green arrow). Around the year 2000, our planet’s spin axis took an abrupt turn to the east and is now drifting toward the Britsh Isles at a rate of almost 17 centimetres a year. This is due to changes in water mass on Earth. Illustration credits: NASA/JPL-Caltech.
Andy May November 26, 2016 at 5:16 am
Are you allergic to links? I am NOT going to root around in 93 papers hoping to find the one that shows that longer sunspot cycles affect climate that you are referring to. Nor am I going to believe you without such a link. Nullius in verba, remember? I provide links all the time, cheerfully and without comment, and if I forget, when someone reminds me I don’t whine and protest like you and Javier. I provide the link graciously. Why is it such a pain in the okole to get you and Javier to do the same?
It’s up to you to support your own arguments, Andy. Saying that the answer is somewhere in the 93 documents over there is obstructive, insulting, anti-scientific, and ultimately damaging to your reputation. You’re a better scientist than that, or at least I think you are, so CITE YOUR CLAIMS, your word is meaningless here.
Nullius in verba,
w.
Javier, I took a look for the study you cited. I couldn’t find a copy that wasn’t paywalled. So for second best, I digitized the data. Here’s your graph:


Here’s the bizarre part. See the orange line up in the first panel (a) that is the 10Be flux? I thought it looked awfully regular compared to the 10Be flux values I’d seen before. So after I digitized the data, I ran a periodogram on it, and to my great surprise, here’s what I got:
Now, that is truly hilarious. The data that you are depending on to prove the existence of a 2300-year cycle ONLY CONTAINS CYCLES WITH PERIODS FROM 150 TO 500 YEARS! The dang data has been subjected to a bandpass filter that has totally and completely removed any periods longer than 500 years.
Too funny. Javier—you’ve been using data that’s band-passed to throw away the Bray Cycle, in order to prove that the Bray cycle is real.
Are you starting to understand why I say you can’t just grab a peer-reviewed paper and think it is gold? Are you starting to understand that when I turn over the rocks in solar studies I find all kinds of snakes crawling out? I find no mention in the text that they’ve band-passed their data so only cycles from 150 to 500 years remain … go figure.
w.
What a waste of time.
You didn’t look well enough. Google Scholar gave me one in 10 seconds:
https://www.researchgate.net/profile/Anders_Svensson3/publication/267105475_Persistent_link_between_solar_activity_and_Greenland_climate_during_the_Last_Glacial_Maximum/links/5450ac820cf24e8f7374dd2f.pdf
The Methods part is very clear:
“Methods
Normalization of production rates. Following ref. 20 we normalize the 14C production rates and 10Be concentrations and fluxes by dividing each record by its low-pass-filtered copy (PLP500, cutoff 1/500yr-1). Before this, each record is low-pass-filtered (PLP150, cutoff 1/150 yr-1) to reduce noise and increase comparability between the 14C and 10Be records arising from their different and irregular sampling resolution. This normalization is summarized in equation (1):
Pnormalized = PLP150/PLP500 (1)
where P is the production rate (that is, 10Be concentrations or fluxes, or 14C production rates).”
You have not been paying attention. The 205-yr de Vries cycle is not independent of the ~ 2400-yr Bray cycle. The evidence shows that the amplitude of the 205-yr de Vries cycle signal is highest at the lows of the Bray cycle and lowest at the heights. Run an amplitude test on the data that you have digitized and it will show you the ~ 2400 yr periodicity. That is if you are interested in finding the truth rather than confirmation of your bias.
The amplitude test has to be run on the 205-yr de Vries band pass obviously. In the article they suggest 180-230 yr band.
Cycles are made to be broken.
weather is not climate
@leif
here you can see that there has been no global warming for the past 20 years. {the oceans make 70% of the earth}
http://www.woodfortrees.org/plot/hadsst2gl/from:1987/to:2017/plot/hadsst2gl/from:1998/to:2017/trend/plot/esrl-amo/from:1998/to:2017/trend/plot/esrl-amo/from:1987/to:2017
“past 20 years” – if you pick an obsolete data set that conveniently happens to end in April 2014. Here is HADSST3 which actually runs to present. Trend over 20 years, 1.16°C/Century.
thanks
I was wodering what had happened to the latest data.
http://www.woodfortrees.org/plot/hadsst3gl/from:1987/to:2017/plot/hadsst3gl/from:1998/to:2017/trend/plot/esrl-amo/from:1998/to:2017/trend/plot/esrl-amo/from:1987/to:2017
AMO looks straight to. Wonder why the difference?
anyway, my actual purpose of making that graph
http://www.woodfortrees.org/plot/hadsst3gl/from:1987/to:2017/plot/hadsst3gl/from:1998/to:2017/trend/plot/esrl-amo/from:1998/to:2017/trend/plot/esrl-amo/from:1987/to:2017
was to figure out [for myself] if the correlation with ozone concentration holds. Note that ozone is one of only many substances formed TOA by the most energetic particles released from the sun.
indeed, it looks to me that exactly when ozone shows a peak, the amo index shows a sharp drop e.g. 2013, 2010 and when amo rises sharply, ozone shows a drop, e.g. 1999, 1996.
go figure
@ur momisugly Andy May
I wonder if you also looked at this paper? It mentions Hallstatt [as a given that it exists]
http://www.nonlin-processes-geophys.net/17/585/2010/npg-17-585-2010.html
[I can only see the abstract. Must say the given 86.5 years for the GB is spot, going by my own results]
Why people that discuss science don’t use Google Scholar is still very surprising to me.
http://www.nonlin-processes-geophys.net/17/585/2010/npg-17-585-2010.pdf
This article is an example on how one can get lost due to a mathematical coincidence that is not supported by empirical evidence. The Dansgaard-Oeschger cycle is not solar. We know a lot about it. The numerical relationship with solar cycles is as far as we know spurious. If cycles are not very well grounded in empirical evidence the risk of cyclomania is extreme, because one can find cycles of any length to support any wild hypothesis.
heeh..
I am just a retired old chemist trying to put my spare time to some good use, not up to date with all modern internet stuff.
in my hay days I helped develop a product [since that time many times copied] to stop having to use Freon solvents to clean PC boards after soldering. This would greatly help to ” preserve our ozone layer’. I still can find the pictures of articles showing you this great advance in science.
I am now so disappointed to find that it was all a hoax. Imagine all of the clowns that call themselves climate scientists discovering the so-called “ozone hole” and signing a treaty that would only cost all of us a lot of money and benefited only a few. Same as the developing CO2 story. I hope Trump throws the Paris treaty in the dustbin where it belongs.
– unfortunately- those clowns include lsvalgaard- unless he is now willing to admit [to us] that the ozone hole story was a hoax. I doubt it. His daughter was working on it, creating certain papers, no doubt coached by him.
The tragedy is that nobody ever measured the peroxide concentration inside the ‘hole’.
those clowns include lsvalgaard- unless he is now willing to admit [to us] that the ozone hole story was a hoax. I doubt it. His daughter was working on it, creating certain papers, no doubt coached by him.
You have no evidence for this [false] accusation.
@leif
true enough. I have no proof about you coaching your daughter.
actually,you are a ‘God’ [good] person, always willing to help, even me,
but you just have to make up your mind on the ozone hole theory….
as with the CO2: obviously there also big holes in the CO2 warming theory as Salvatore will tell you
so tell us exactly where you stand on these issues?
I have no real opinion on the Ozone hole. I listen to my Daughter-in-law, she is the expert. Some years ago she published an article in Nature [and made the front page, too] on the Ozone. She is now the State Geologist of Denmark.
AGW: clearly CO2 plays a role. Not a big one, though. The Sun too, also not a big one. Ocean circulation is probably important. My view can be found here:
http://www.leif.org/research/Climate-Change-My-View.pdf
give this some thought
https://stevengoddard.wordpress.com/2016/04/08/global-temperature-record-is-a-smoking-gun-of-collusion-and-fraud/#comment-587987
henryp,
Gail is wrong about everything she says in that comment:
– The Dansgaard-Oeschger cycle is not a solar cycle. No solar cycle of ~ 1500 yr has been reliably found. Cosmogenic isotope records prior to the Holocene cannot be reliably trusted to give a proper account of solar variability, but if there was a ~ 1500 yr solar cycle we would know from the past 11,000 years.
– There maybe a 100,000 yr cycle in the geomagnetic field, I don’t know, but even if there is one, the glacial cycle does not have a 100,000 yr periodicity. It is an artifact from the methodology. See:
https://judithcurry.com/2016/10/24/nature-unbound-i-the-glacial-cycle
Therefore, that geomagnetic field, if it exists, does not produce a climatic effect.
– The Greenland ice-core record does not show any recognizable evidence of the 1470-yr Dansgaard-Oeschger cycle. The cycle labelled in that figure is a 1150-yr periodicity that nobody knows where it is coming from and that is specific of Greenland, as it is not evident in proxies from elsewhere.
@Javier
@Andy
let us see on what we actually do agree on?
Schwabe 11 yrs
Hale-Nicholson 23 years
Gleissberg 87 years
The above cycles I can prove from my own results on Tmax and Tmin and rainfall; what I found essentially is that the GB has a sine wave consisting of 43 years of warming followed by 43 years of cooling.
There are 4 quadrants in a sine wave. Each quadrant equals one full Hale cycle.
We also know that the exact length of the above three cycles is strongly correlated with the known positions of certain planets.
Now, according to most reports, including the one I have just read as promised to Andy, there is also the De Vries-Suess (DV) of ca. 207 years and Hallstatt of ca 2300 years.
I cannot verify myself but I agree that the evidence from all the reports is overwhelming. Anyone who does not agree must be a clown played by someone or money/
The paper I just read holds that Braun et al (2005) were correct in thinking that a solar forcing driven by GB and DV could be responsible for the transitions called DO events 1470 years and they carry on working on this hypothesis, apparently confirming this. Do you agree with it?
btw my various analyses show there is no man made global warming caused by an increase in CO2. Hopefully we can also agree on that.
henryp,
Gail is wrong about almost everything she says in that comment:
– The Dansgaard-Oeschger cycle is not a solar cycle. No solar cycle of ~ 1500 yr has been reliably found. Cosmogenic isotope records prior to the Holocene cannot be reliably trusted to give a proper account of solar variability, but if there was a ~ 1500 yr solar cycle we would know from the past 11,000 years.
– There maybe a 100,000 yr cycle in the geomagnetic field, I don’t know, but even if there is one, the glacial cycle does not have a 100,000 yr periodicity. It is an artifact from the methodology. See:
https://judithcurry.com/2016/10/24/nature-unbound-i-the-glacial-cycle
Therefore, that geomagnetic field, if it exists, does not produce a climatic effect.
– The Greenland ice-core record does not show any recognizable evidence of the 1470-yr Dansgaard-Oeschger cycle for the last 12,000 years. The cycle labelled in that figure is a 1150-yr periodicity that nobody knows where it is coming from and that is specific of Greenland, as it is not evident in proxies from elsewhere.
I don’t know why my comment above came twice.
Henry,
Schwabe yes.
Hale, this one appears to be magnetic only.
Gleissberg. I don’t think this one is reliable. I haven’t studied it much, but its duration and effect on climate appears very variable. It is clearly not one of the solid cycles.
de Vries absolutely. One of the most clear cycles with a clear effect on climate.
Bray (hallstatt) also very clear. But my calculations say it is ~ 2460 years from 18,000 years of data (7 cycles in 17200 years), so it cannot be 2300 yr. Frequency analysis tend to have a problem with the irregularity of the cycle and interference from the ~ 1000 yr Eddy cycle.
Eddy cycle, also very real. About 975 years.
Absolutely not. The interstadial phase of a D-O oscillation is triggered by the abrupt mixing of ocean layers of different temperatures in the Nordic Seas, probably below sea ice. The evidence presented by Dokken et al., 2013 is quite clear, and other groups are seeing the same. The cause is not solar, and there is no ~ 1500 yr solar cycle during the Holocene. The 1500 year cycle is oceanic as most authors propose.
No sorry. It is my opinion that the increase in CO2 has produced some warming. We have gone back several thousand years in glaciers and small permanent ice patches, essentially undoing the entire Neoglacial period in that aspect. That is why Ötzi, that is 5100 years old, was found recently. The sun alone cannot have done that as it goes way beyond previous trend. Glaciers are very sensitive to CO2 because the air above them is very dry and has less competence from H2O, and glaciers have receded about 5000 years of advances.
Hale, this one appears to be magnetic only.
Is not really a physical cycle as its two 11-yr cycles are progressing rather independently.
henryp, No I missed that paper in my research, thanks very much for the link. I found the full text on google scholar, here is the link: http://www.nonlin-processes-geophys.net/17/585/2010/npg-17-585-2010.pdf
They found a Bray (Hallstatt) cycle of 2276 years using a non-linear technique. I’m familiar with the idea of the Earth’s climate having two stable states (warm and cold) and switching back and forth between them. Perhaps there is something to that.
thx
have not yet read the paper
but I will make a point on my list getting to read it.
I meant “spot on”
typo again.
What baffles me as far as AGW theory is the basic premise the theory is based on which is the lower tropospheric hot spot has failed to materialize and yet the theory lives on, not to mention the atmospheric circulation the theory predicted has been dead wrong. The theory stated as time went by the AO would evolve into a more positive mode as a consequence of global man made warming and the reality is the opposite has been occurring.
Then there is the question of OLR which this theory said would decrease with time which also does not seem to be taken place.
If the basic premises a theory is based on are wrong do you not think the theory must be wrong. I do.
yes. there you got it. AGW theory is that heat is trapped on earth, meaning an increase in minima pushing up means. It is not happening. Minima are decreasing, hence AGW is only what the clowns want you to believe. Nice job if you can make people believe that they should pay the government for air and sunshine.
” If cycles are not very well grounded in empirical evidence
the risk of cyclomania is extreme, ”
. . . . . . . . . . . . . . . . . . . . . . . . . . . . . Javier
So true, and that is why it is so important that a cyclical event
such as the 2402 year Charvatova cycle is supported by existing
physical mechanisms.
We can physically see the ~2402 year disorder in the sun’s orbit:
. . Charvatova, I., 2000. The Cycle of 2402 Years in Solar Motion
. . . and its Response in Proxy Records. Geolines 11, 12-14.
We can also see the earth’s precession of ~25772 years:
. . Hilton, J.L., et al., 2006. Report of the International Astronomical
. . . Union Division I Working Group on Precession and the Ecliptic.
. . . Celestial Mechanics and Dynamical Astronomy 94, 351-367.
And thirdly, we can see the rotation of the sun’s outwardly directed
acceleration that takes place every ~2649.63 years:
. . ” Fibonacci and Climate” . . at Weathercycles.wordpress
When we combine all three of these physical events we begin to
see that it is the acceleration of a massive sun that generates force
in our solar system.
Notice how these three physical mechanisms combine to form the beat:
2649.63 x 2402.616 / ( 2649.63 – 2402.616 ) = 25772 years
yes, but where does the beat come from/
Fertile imagination.
Whatever cycle that has been found and named, in itself it is utterly useless, I have explained how the planets regulate the sun’s polarity and it is the polarity of the sun that causes all of the interaction of energy highs and lows measured on Earth and any other planet in our solar system…
Again theoretically, if the suns polarities remained at their geographical poles, how long before an Ice age was produced on Earth?
Regular Ice ages are caused by the planets slowly changing orbits effecting the sun, it’s where a solar-system wide equilibrium naturally occurs and our star is no longer interacting with the planets to the extent that its polarities remain stationary on its geographical poles, facing away from the plane of the planets…
problem discussed elsewhere
https://wattsupwiththat.com/2016/11/28/record-heat-despite-a-cold-sun/#comment-2360934
The planets control the suns polarity reversal. The planets have an imbalance in time that is equivalent to our sun’s polarity reversal, scientific astronomical fact, it has been proven… yes by me
Also found the correlation between gleissberg and position saturn and uranus. I was also thinking of polarity change as we seem to have dead end stops for solar magnetic field strengths 1971 and 2014. Consequently also one 1927.
Not sure yet if the correlation is caused or causal.
An interesting note about the suns polarity reversal and Uranus which I discovered a few years back, Uranus poles reverse at the same rate as the suns, it takes approximately 22 years for the suns Poles to make a complete geographical rotation, for example, if the southern polarity of the sun is at the southern geographical pole it will take approximately 22 years for it to travel to the geographical north pole and return to the geographical south pole. This in my opinion is no coincidence that Uranus’s north pole facing the sun takes approximately 22 years to rotate away from the sun and back again, it’s like Uranus and the suns polarity reversal is interlocked.
I’m surprised only one scientific paper (that I know of) has mentioned this discovery since I first published details of it…
Smells like professional jealousy as I’m “only” an engineer doing detailed lengthy research in my own spare time 😉
Whatever cycle that has been found and named, in itself it is utterly useless, I have explained how the planets regulate the sun’s polarity and it is the polarity of the sun that causes all of the interaction of energy highs and lows measured on Earth and any other planet in our solar system…
Again theoretically, if the suns polarities remained at their geographical poles, how long before an Ice age was produced on Earth?
Regular Ice ages are caused by the planets slowly changing orbits effecting the sun, it’s where a solar-system wide equilibrium naturally occurs and our star is no longer interacting with the planets to the extent that its polarities remain stationary on its geographical poles, facing away from the plane of the planets…
henryp
An interesting note about the suns polarity reversal and Uranus which I discovered a few years back, Uranus poles reverse at the same rate as the suns, it takes approximately 22 years for the suns polarity to make a complete geographical rotation, for example, if the southern polarity of the sun is at the southern geographical pole it will take approximately 22 years for it to travel to the geographical north pole and return to the geographical south pole. This in my opinion is no coincidence that Uranus’s north pole facing the sun takes approximately 22 years to rotate away from the sun and back again, it’s like Uranus and the suns polarity reversal is interlocked.
I’m surprised only one scientific paper (that I know of) has mentioned this discovery since I first published details of it…
Smells like professional jealousy as I’m “only” an engineer doing detailed lengthy research in my own spare time 😉
Hi Spark
I only know of one paper that mentions the Uranus wiggle
and I am wondering now if indeed this wiggle is in fact not the key to the play between the sun and all the planets
i.e. if the balance of power of the SS is not there – no polarity switch-
hence a prolonged minimum (LIA) or a prolonged maximum (MEWP)
@sparks
must say that it is very striking that the average Hale Nicholson cycle is 22 years….but it does vary…
[note the Schwabe solar cycle basically is half the Hale Nicholson cycle -I thought that everyone had understood this but this does not seem to be true….]
Sparks, might I suggest that it is the gravitational effects of orbital motions acting on Earth’s very delicately balanced plate tectonic system that actually causes ice ages rather than insolation effects? Activation of plate tectonics of course involves volcanism, which can cause either warming or cooling, depending on which kind is dominant. Explosive volcanism at distal plate edges causes cooling through aerosol production, while non-explosive volcanism at proximal plate edges causes warming through halogen hydride emissions thinning the ozone layer and thus increasing solar UV-B irradiation of Earth’s surface. Note that this mechanism bypasses the problem of unequal seasonal insolation in opposite hemispheres.
Javier, Andy. Willis, lsvalgaard and others: Thanks for the interesting posts and comments. Perhaps some late comments can bridge the some differences.
There have been only four putative Bray/Hallstadt cycles between the LIA (the latest) and the Younger Dryas, and the Younger Dryas appears far more intense that any of the earlier ones and therefore may not be part of a pattern. Therefore periodicity analysis of the type WIllis insists upon hasn’t provided compelling evidence for a cycle.
Willis was unconvinced that large volcanos cause cooling. BEST/Mosher provided a superimposition of temperature surrounding about a dozen large volcanos that averaged out the noise and made the cooling more apparent.
Willis is looking for a statistically significant signal in the data from one paper, J&M are trying to “superimpose” the evidence from many papers and phenomena onto four putative Bray cycles (which partly explains why J&M don’t point to a single paper and why Willis is unhappy). It is possible – though clearly not preferable and sometimes dangerous – to combined multiple independent lines of evidence so that evidence which isn’t statistically significant in isolation becomes statistically significant in combination. So which independent lines of evidence can be combined in a convincing manner?
1) Solar activity proxies: Sunspot data is too short. C14, Be10, grand solar minimum/maxima and estimated sunspot number before 1600, and cosmic ray modulation/solar magnetic field strength are all aspects of the same phenomena, not independent lines of evidence. Based on earlier discussions, C14 becomes impractical or the cycle vanishes earlier than the Younger Dryas. That leaves only Be10 as a means of getting information about more than 4+ cycles. Aren’t there several ice cores that could provide this information? The absence of a significant earlier cycle isn’t as likely to be published as the existence of such evidence.
2) Climate proxies:
a) Civilization: IMO, the evidence of changes in civilization (Greek Dark Age, Urak, LBK) is not clearly linked to colder climate. Civilizations developed at locations with different temperatures, and the amount of temperature change produced by the LIA (less than 1 K?) is less than the difference between locations. Reliable precipitation (which varies far more than temperature) could be a more important climate variable and precipitation changes are mostly regional, not global. Confirmation bias may cause us to pick out some events that agree with hypothetical cycles and ignore others (the Dark Ages + Mayan collapse, for example). It is impossible to quantify information of this type.
b) O-18 in three ocean cores. With hundreds of cores available from which to chose, finding a 2400-year signal in a few of them isn’t meaningful. Can/has a systematic study of ocean cores uncover a 2400-year cycle?
c) Bray’s glacial advances and retreats. If comprehensive (not cherry-picked) dates of all glacial advances and retreats were superimposed on other data, this could be convincing. The paper is paywalled.
d) Ice rafting? According to Wikipedia (which isn’t always right), Bond ice rafting events occur every 1500 years and there have been seven such events since the YD. If correct, they don’t fit the Bray cycle.
There is a philosophical difference about how “science” is done. “Phenomenologists” collect observations and create hypotheses that explain them. Some can be shown to be statistically significant. Others use such hypotheses to make predictions about what related phenomena should/could be found by new experiments (ocean cores?, Be10 in ice cores). The failure to find new evidence where it might be expected could be because the signal isn’t strong enough, but even that information is meaningful. Bray’s original climate observations for a 2400-year cycle became much more interesting when a possible 2400-year solar cycle appeared, but that link contains a new hypothesis – solar variability in the 2400-year cycle is large enough to cause climate change. IMO, the Bray cycle would benefit from the latter approach.
Thanks, Frank for the summary, I agree with most of what you’ve listed, but a few comments are necessary:
You are correct about five cycles in 12,800 years not being enough for a successful statistical analysis. Trough to trough it is 12,100 years with an average period of 2420 years. The Younger Dryas is an anomaly, but the initial state for that Bray low was the end of the last glacial maximum. The initial state of a Bray low is important in determining the severity, as is the position of other cycles like the Milankovich cycles which are stronger than the Bray cycles.
Your summary of why we do not want to point to one paper or dataset is correct. It is pointless. There is no simple answer, we have strong evidence for a cycle, but no mechanism. Once the mechanism is known we may be able to satisfy Willis.
1. Yes, there is ice core 10Be data and sedimentological dO18 data prior to the YD and it shows the same Bray cycle. See Pestiaux, 1988 (in the bibliography) for the dO18 data. Adolphi, et al., 2014 (also in the bibliography) shows the cycle back to 22,000BP.
2. (a) The LIA and the GDA can be linked to colder dryer climate (Behringer’s book, Clines’s book). The earlier periods not so much. The links for the books are in the post, click on “Greek Dark Ages” and “Little Ice Age.”
(c) Send me your email and I will send you the paper.
(d) Bond identified a 1500 year oceanic cycle that is well accepted. His data also has a 2400-year cycle, see Javier’s posts for the details.
Science is a process to be sure. This post is a literature survey of numerous (not all) papers related to the historical, archaeological, paleontological, sedimentological, iceberg, glacial, geological and cosmogenic radionuclide evidence for a 2400-year Bray cycle. The bibliography lists the 39 papers we consider the minimum necessary to establish the climate cycle. Javier and I find it convincing, Willis and Leif do not. Everyone needs to make up their own mind. I agree it will only be solved when a mechanism (Solar? Orbital? TSI?, UV? Magnetic?, solar wind?) is found. It is even possible that it is a terrestrial mechanism, I find that unlikely, but it is possible.
Thanks for a very perceptive comment.
Andy: Thanks for the reply. If I were arguing with WIllis, I would have focused on the longer 10Be data (for solar activity) and the longer dO18 (for climate response) you mentioned. However, my discussions with Willis haven’t been very successful.
Here is the long 10Be record:
http://www.leif.org/research/Steinhilber-HMF-B.png
Leif, that graph says it’s the “Steinhilber HMF B nT” … is that connected to the 10Be record?
w.
Yes, the Heliospheric Magnetic Field controls the cosmic ray flux and can be derived from it using well-understood physics and is a more direct parameter of solar activity.
lsvalgaard November 30, 2016 at 2:45 am
Thanks, Leif. I understand that, but what is the relation between that and the 10Be record? AFAIK there is no continuous 10Be record covering that entire time.
w.
There is such a record: http://www.leif.org/research/Steinhilber-Us-B.xls start row 1055
Frank,
This is incorrect.
http://www.geo.arizona.edu/palynology/geos462/bondcycles.jpg
Even assuming that peaks 0, 1, 2, 3, and 4 are single peaks (they are not), there is no way the two peaks in 5 separated by 1000 years are the same event. A minimum count gives 10 events in 12,000 years, so a periodicity of 1,200 years. There is no way it can be 1,500 years.
This graph from Bond et al., 2001 article, relates ice rafting to 14C production. It is clear that most of the Bond ice rafting peaks correspond to 14C peaks, i.e. reduced solar activity, with a ~ 1000 yr periodicity. This periodicity corresponds to the Eddy cycle, that we have not discussed in the article.
http://www.euanmearns.com/wp-content/uploads/2016/05/Figure-3.png
The Bray cycle is also well represented in the Bond series. For example the 2,800 yr BP peak belongs to a Bray low.
I agree with Andy May that Frank’s comment was a good summary. The debate here was interesting again.\ truth always wins, in the end.
pity Mr Vukcevic was not present as I am sure he has some good observations on the last issue raised by Andy:
“It is even possible that it is a terrestrial mechanism, I find that unlikely”
I think he would have argued that there is a relationship somehow within the earth’s geo magnetic forces which I think relates to earth’s iron core. By my thinking it is possible, [although some outside influence from the sun must be present again]
but yes, I could imagine that earth’s inner core of hot melted iron, not completely “round” , could have turned in some way more towards the north, causing more warming in the NH than the SH
{as evident from my own results: there has been virtually no warming here in the SH}
all the best
H