From the INSTITUTE OF ATMOSPHERIC PHYSICS, CHINESE ACADEMY OF SCIENCES
How much warmer has Hong Kong’s urban area become during the past 4 decades?
Characterizing the urban temperature trend using seasonal unit root analysis: Hong Kong from 1970 to 2015
Scientists from Macao Polytechnic Institute are pioneers in exploring urban temperature in Hong Kong using seasonal econometric models. In particular, the characterization of the urban temperature trend was investigated using a seasonal unit root analysis of monthly mean air temperature data over the period of January 1970 to December 2013.
“The seasonal unit root test makes it possible to determine the stochastic trend of monthly temperatures using an autoregressive model,” says Prof. Wai Ming To. “We found that Hong Kong’s urban mean air temperature has increased by 0.169°C per 10 years over the past four decades using monthly temperature data, or 0.174°C per 10 years using annual temperature data, and the trend is likely to persist.”

The increase in Hong Kong’s urban mean air temperature was higher than the increase in global mean air temperature [0.13°C (10 yr)-1 using data from 1956 to 2005, or 0.07°C (10 yr)-1 between 1906 and 2005 due to global warming]. The model of monthly temperature obtained from the seasonal unit root analysis was able to explain 95.9%of the variance in the measured monthly data–much higher than the variance explained by the ordinary least-squares model using annual mean air temperature data and other studies alike. The model accurately predicted monthly mean air temperatures between January 2014 and December 2015, with a root-mean-square percentage error of 4.2%.
By analyzing the monthly air temperatures recorded at an urban site and a rural site, it was found that the urban heat island effect led to the urban site being on average 0.865°C warmer than the rural site over the past two decades. Besides, it was shown that the increase in annual mean air temperature was significantly associated with the increase in population, gross domestic product, urban land use, and energy use.
###
The paper: http://link.springer.com/article/10.1007%2Fs00376-016-6113-z
Characterizing the urban temperature trend using seasonal unit root analysis: Hong Kong from 1970 to 2015
Abstract
This paper explores urban temperature in Hong Kong using long-term time series. In particular, the characterization of the urban temperature trend was investigated using the seasonal unit root analysis of monthly mean air temperature data over the period January 1970 to December 2013. The seasonal unit root test makes it possible to determine the stochastic trend of monthly temperatures using an autoregressive model. The test results showed that mean air temperature has increased by 0.169◦C (10 yr)−1 over the past four decades. The model of monthly temperature obtained from the seasonal unit root analysis was able to explain 95.9% of the variance in the measured monthly data — much higher than the variance explained by the ordinary least-squares model using annual mean air temperature data and other studies alike. The model accurately predicted monthly mean air temperatures between January 2014 and December 2015 with a root-mean-square percentage error of 4.2%. The correlation between the predicted and the measured monthly mean air temperatures was 0.989. By analyzing the monthly air temperatures recorded at an urban site and a rural site, it was found that the urban heat island effect led to the urban site being on average 0.865◦C warmer than the rural site over the past two decades. Besides, the results of correlation analysis showed that the increase in annual mean air temperature was significantly associated with the increase in population, gross domestic product, urban land use, and energy use, with the R2 values ranging from 0.37 to 0.43.
well I’ll be darned…they found it….all of it
Now we know where all of global warming has been hiding…
..since no one has been able to find it anywhere else!
on average 0.865◦C
+1
i checked his work and his claimed trend of +0.0169C per decade is good. it actually goes up to +0.18 if we include 2014, 2015, and 2016. BTW, not sure why he picked 1970 as his start year. continuous temperature data are available from 1884 to 1939 (and then a war break) and again from 1947-Oct 2016. The trend drops to +0.153/decade for 1947-2016. Also, all months don’t show a warming trend. in particular the winter months (january and december) and the month of may don’t show a stat.sig. trend.
the british are fastidious data takers. so whatever they colonized has good data going back to the beginning of colonial times. weird, no? too bad they never came to thailand. oh well.
—————————————————————————————
ps: here he is
https://ipm.academia.edu/ToWaiMing
a treasure trove of weather data going back to 1884
HONG KONG DATA
http://www.hko.gov.hk/cis/climat_e.htm
typo. 0.169 per decade not 0.0169 per decade
When did the rapid urbanization around Hong Kong start?
Didn’t the BEST survey, the gold standard in science and not to be questioned, determine that the increase UHI over the last century was at most a few hundredths of a degree?
/sarc
..Me thinks this is part of the “Trump Affect”…Real scientists are now willing to state their TRUE beliefs in public…without as much worry for being prosecuted by the liberal (socialist) left…?
WRONG WRONG WRONG. Submitted weeks to months before publication yesterday. Stop try[ing] to politicize ever thread, I’m getting damn sick of your inane political comments. You’ve been warned, twice. 48 hour time out in the penalty box.
Good for you Anthony! That is what has been wrong these last 2 decades, the debate has been politicized.
Anthony, no matter how wrong he is to introduce politics into the discussion, it’s also wrong to ban him. Free speech and all that.
Marcus seems to be, long have I thought this, on a mission to discredit this blog.
Informed Consumer,
I’m getting tired of everybody trotting out the “free speech” defense at every turn. In the US, the constitution bans the government from passing any laws infringing on free speech. It does not have any effect on what business or private individuals can do. This is not a government blog, it is Anthony’s and he can bad whoever he chooses. Speech here is a privilege and if one abuses it, one can lose it. Simple as that.
Good evening all
Why do I feel I am stepping into a minefield.
Anthony Watts places these articles here for us to read and maybe learn a bit.
If Marcus had taken the time to check a few dates well ….
Submitted April 20 2016
Revised July 30, 2016
Accepted August 1 2016
Researching writing and getting accepted such a paper is a tremendous amount of work.
The intent was to identify a effect. The publication had nothing to be with US politics
this alone should have clued in anyone it had nothing to do with our politics.
INSTITUTE OF ATMOSPHERIC PHYSICS, CHINESE ACADEMY OF SCIENCES
Hope I have not offended anyone
michael
“You’ve been warned, twice. 48 hour time out in the penalty box”
love that,
If the election had gone the other way…..
I’ll bet every post and comment would be something political right now.
Probably obvious I don’t share Marcus’ political bias, I have my own already. Having said that if I were Marcus I’d be wondering what I said wrong, given some of the blatantly one-sided verbiage that Anthony apparently smiles upon.
But they are not “climate scientists”, so the green blob will ignore it.
The results of correlation analysis showed that the increase in annual mean air temperature was significantly associated with the increase in population, gross domestic product, urban land use, and energy use = Urban Island Heat effect!
How does the CO2 cause the UHI increase… I can’t see a mechanism which would’nt also impact the rural site? Asking for a friend.
Al Gore, Hillary Clinton and Barak Obama have announced that rural sites are seriously different from urban ones here in America. Trump will need to explain this difference since Al, Hill and Barry know nearly nothing about rural environments as all have spent their lives in cities.
let’s leave these kinds of comments out, shall we?
Regrettably, it is very difficult to leave politics out of things at this point. Everything is political right now.
Mike, CO2 is not causing the UHI increase…..”the results of correlation analysis showed that the increase in annual mean air temperature (UHI) was significantly associated with the increase in population, gross domestic product, urban land use, and energy use”…I stuck in the (UHI)
How does the CO2 cause the UHI increase
It doesn’t. UHI increases temps independently of CO2. That’s the point of comparing to a rural site, to figure out how much of the measured urban warming is due to UHI rather than CO2 + natural variability.
Or did I misunderstand your question?
Here is another comparison in the same region.
https://wattsupwiththat.com/2013/05/13/the-chinese-demonstrate-that-uhi-has-a-real-and-essential-effect-on-regional-climate-change/
Mike barminski, you gotta think of the UHI (urban heat island) effect as being akin to a “storage battery” that absorbs (solar, etc.) “thermal (heat) energy” …….. or generates (fossil fuel burning, etc.) “thermal (heat) energy” …… and then SLOWLY radiates its stored energy into the surrounding atmosphere as IR energy. With “SLOWLY” meaning it will take from one (1) to five or six (5/6) hours for said “heat island” to cool back down to ambient temperature. And what that means is an INCREASE in near-surface air temperature measurements that are recorded in the late afternoon and early evening.
It was originally given the name “urban” simply because the cities and towns is where the major concentrations of human infrastructure is located. But there is also “rural” heat islands such as roadways n’ highways, railroads, bridges, dams, houses, barns, cars, trucks silos, etc., etc., …… all absorbing the daytime Solar irradiance and then re-radiating it long after Sunset.
Samuel, great comment. I recall there are studies that show thermometer locations in rural and small town settings can exhibit UHI effects.
In addition to those things that absorb and release incident solar radiation there are numerous sources of heat energy within the urban district. Anything that burns fuel or uses electricity is turning those forms of energy almost entirely into heat which is released in the urban heat island.
Second line “or generates (fossil fuel burning, etc.)”
Not to mention airport paving which is relevant because many weather stations are at airports, including smaller cities and even rural areas, where they go about their daily (and nightly) business of providing skewed temperatures.
Is that Leonardo’s yacht in the photo?
I think that’s just a tender fir one of his smaller yachts 😉
His smaller yachts are still big enough to have a tender fir on them?
I wonder if his bigger yachts can handle a full grown fir?
The scatter graph also gives the impression of the 1998 El Niño. If so then there is a general trend for the time interval almost entirely explained by urban growth with short term variability likely moslty attributable that natural ocean cycles. CO2 will have to find another job!
Perhaps we can employ it to help plants grow?
Japan seems to have a pretty good temperature network, not overly affected by UHI.

From 1940-1990 it was basically dead flat (massive manufacturing expansion in Japan)
There was a slight step at between 1990 and 1998, then basically zero trend since
And it’s these sort of differences that make predictions impossible , Hong Kong up Japan steady .
Obviously nature drives the system to its own drum beat .
A lot depends on the local geography. If the hills, mountains, winds and jet stream patterns are such that winds routinely sweep through it is reasonable to expect a lower UHI effect (but not zero). If inversions are common and mixing is often non existent heat and other nasty stuff will stick around with a resultant increased UHI effect.
I suspect that it has more to do with the positioning of Japanese climate stations, and the Japanese not allowing them to be contaminated. They are a fastidious people.
Also, it is quite probable that a lot of their measurements are at or near shrines etc, and have therefore avoided most of the UHI effects.
Hong Kong is a city-state of around 1000km2. Japan is (relatively) a much larger archipelago with cities and rural areas covering a wide ranging latitude and longitude. I don’t think it’s appropriate to equate the two.
@ur momisugly Robert from oz
Now talk about “apples n’ oranges”.
Hong Kong (420 mi²) is a city in the country of China, …… Japan (145,936 mi²) is a country with the city of Tokyo.
You have to realize that Japan is a bunch of islands surrounded by ocean. Therefore, the oceans are going to have more impact on temperature than in say, Cheyenne or Novosibirsk.
Hong Kong is a peninsula and a bunch of islands surrounded by ocean.
Clyde, are you saying that the oceans haven’t warmed ? 😉
AndyG55,
No, I’m not saying that the oceans haven’t warmed. However, water has a heat capacity ~4X that of most surficial materials, so one can reasonably expect it to warm at 1/4 the rate of land. So, the proximity of water will act as a buffer on warming of islands, unlike continental interiors.
So 1/4 of the land warming of ZERO
let me see, hard maths….. you can do it. 😉
Andy,
Nice find, what is source ?
Any more interesting bits ?
http://www.data.jma.go.jp/cpdinfo/temp/list/mon_jpn.html
Have fun organising the data 😉
Thanks Andy……now I wish I hadn’t asked (:-(()
Andy says:
not overly affected by UHI.
Actual temps could have been falling & masked by UHIE.
It must be the Japanese kumi-daiko that helps Japanese weather march to its own drum beat.
Maybe it is the growing urban areas around the world that explains the slight average rise in temperature over all. If they just take rural area averages, have rural areas seen warming? Maybe it is not carbon causing warming but roads, parking lots and roof tops.
This is why we’re waiting for Anthony’s paper to be published…
We are told that aerosols cool the climate. We know China has been emitting a lot of aerosols. Where is the effect? I’ve yet to see any data that supports the claim that aerosols produce measurable cooling.
Folks, it is also possible that the PRC, as the largest emitter of CO2, would prefer that there be some other explanation for temperature increases? Just saying …
Valid suggestion but it does not hold up. Obama got the Chinese on board by letting them engage to do nothing other than what they would want to do anyway while the west engage to commit economic suicide.
Unlike in 2009 the Chinese are invested in the west continuing to believe in this scam .
Cogar, better check your scientists again…..one paper said 55 Gt CO2 emitted by termites, but the most common number is 3.5 Gt, about 1/10 of human emissions.
Try this for a reference instead of sensationalist click bait articles.
http://www.bgc-jena.mpg.de/bgc-systems/pmwiki2/uploads/Site/sanderson_1997.pdf
Cogar,
“Biomass of termites…..” study by Sanderson, Table 5, says 3.5 Gt CO2 per yr for termites, so about 1/10 of human emissions. Who are your referenced scientists? It is pretty hard to count all those termites.
Doug MacKenzie , did you read, in your cited link, ….. the “three (3) approaches they used” to ESTIMATE the annual emission of trace gases from termite colonies?
Estimate this, estimate that, multiply both by another estimate …….. and “WHOOPEEE”, …… you get actual, factual scientific results.
In actuality, things haven‘t changed much since 1982, to wit”
Cogar, has there been an increase in the amount of CO2 being produced by termites over the last 100 years? If not, then this isn’t an explanation for the steadily increasing levels of CO2 in the atmosphere.
MarkW – November 20, 2016 at 9:56 am
“No feces”, ….. MarkW, ……… so to improve your science literacy its’s best you READ MY WRITING that states, …… the steady & consistent yearly increase in atmospheric CO2 …… of an average of one (1) to three (3) ppm during each and every one of the past fifty-eight (58) years as per Mauna Loa measurements ……. is a DIRECT result of the yearly increase in the temperature of the ocean waters ……. that are recovering from the FREEZIN ASSED COLD of the Little Ice Age.
And MarkW, ……. the same as is the steady & consistent bi-yearly cycling in atmospheric CO2 …… of an average of six (6) to seven (7) ppm during each and every one of the past fifty-eight (58) years as per Mauna Loa measurements……. is a DIRECT result of the SEASONAL (winter/summer) increases/decreases in the hemispheric temperature of the ocean waters.
Given the above “steady & consistent” measurements of atmospheric CO2 ……. one HAS TO assume that said CO2 has been doing the same for many years n’ years before Charles Keeling ever started recording ppm quantities atop Mauna Loa, Hawaii.
Iffen one is not knowledgeable in/of the biology of the natural world then it is quite likely that they really don’t understand or comprehend the science that “drives” earth’s changing climate,
China is making lots of money selling solar panels and rare earth metals to make wind turbine generators.
There bread is being buttered on both sides.
It’s interesting that this study comes from Macau because the Hong Kong Observatory is so firmly welded into the CAGW myth such a study would not see the light of day. I have serious issues with the HKO, for instance, the daily temperature they quote is for the Observatory site only despite it being always one of the warmest reporting sites and the rest of Hong Kong generally exhibiting a 7-10C difference from warmest to coldest. The monthly average that is published is also based on the HKO site only and no mention of the range of uncertainty is ever mentioned.
In the 26 years I have lived here, the population has increased from just under 5 million to over 7 million today. Plus the adminstration is addicted to concrete pouring so it’s not too surprising that the study comes to the conclusion it does on the main causes of UHI.
I wonder too, whether all the warming is from UHI and not CO2. Sites I have investigated in rural South East Australia, show no warming at all from 1880 onwards. Yet Melbourne has a similar record to 1958, but 2 degrees of warming since then.
Roy Spencer has shown there is no warming in the US corn belt, nor in the Antartica.
Summer before last I attended a panel discussion on ‘Climate Change’ at a local college. One of the panel participants was the meteorologist for Wright-Patterson AFB (OH). He showed a graph of high and low temps for the last 50 years. There was no discernible trend. WPAFB has been around for a long time but, because it is an AF base, the nearby city of Dayton and other local communities have not been able to encroach on it, unlike civilian airports. It is a strong suggestion that the warming is minimal when the weather stations are not contaminated by UHI.
The Trump Effect must be spearheading a return to real Climatology and real Science already. Today Hongkong, Tomorrow, the World.
UHI is a very well known phenomena (since the early 1800s – Luke Howard). City inhabitants, which is most of the world since 2010 or so, cop it from both sides; global warming and urban heat heat island. One doesn’t negate the other.
Is the title of this post is trying to insinuate global warming is insignificant? The content of this post contradicts that completely: says warming in HK, 0.169°C / decade (since 1970), globally 0.13°C / decade (since 1956)… pretty similar trends! How is the HK UHI most of the warming? I’m actually surprised how little additional trend there is in HK.
The content of this post contradicts that completely: says warming in HK, 0.169°C / decade (since 1970), globally 0.13°C / decade (since 1956)… pretty similar trends!
Nice try Mat. But you can’t compare a trend from 1956 to a trend from 1970 and declare them similar with a wave of your hands. A plane taking off and a plane landing are at some point at “similar altitudes” which provides zero information about their relative motions. Climate data is far too variable to just grab different time periods and shrug them off as being “similar”. Besides, the abstract concludes by saying:
analysis showed that the increase in annual mean air temperature was significantly associated with the increase in population, gross domestic product, urban land use, and energy use
Which they arrived at by comparing to a rural site. You can’t take local weather from one time period and compare it to global weather from a different time period like you attempted to.
David, I’m not ‘trying’ anything – I’m using the information in this post. I agree it’s sloppy to compare trends over different periods… and yet that is what this post has done, I’m just showing that this post has negated it’s own point.
It’s also incredibly ‘sloppy’ to insinuate global trends built up of thousands of rural measurements can be negated with a single statistical study at a single site. Ever think that maybe aerosol pollution from China might be affecting the rural site?
One, thousands of measurements is about 3 orders of magnitude too small to make any declarations regarding the world’s temperature.
Two, most of the sensors are suburban to urban. There are precious few truely rural sensors.
Mat,
I think that one of the implications in the similarity in trends is that most of the weather stations in the world are in or near cities. Therefore, if HK is showing trends similar to the global trends, it is circumstantial evidence that the global record is contaminated by UHI. Even if the rural stations are showing warming, it could be because the prevailing winds bring warm air to some of the rural stations. What is difficult to reconcile is the significant warming in the Arctic.
Not really. The AMO is the biggest reason.
We don’t have a long enough record in the Arctic to say anything definitive regarding the trends up there.
We are going to have to wait until we have at a minimum one full AMO/PDO cycle under our belts before you can even start thinking about plotting trends. (3 to 4 cycles would be much better.)
What the study shows is that almost all of the warming in Hong Kong for the last 45 years is due to UHI. The “global warming” portion is miniscule at best.
The point of the article is that most of the other ground based sensors are also contaminated by UHI, as Anthony and others have demonstrated over the years. Not to mention micro-site contamination that Anthony with the help of his volunteers have also documented.
Your attempting to prove that most of the warming in Hong Kong must be CO2 related because it closely matches the global average is circular reasoning.
So how long before this paper is cited as having found ‘accelerating warming’ in Hong Kong?
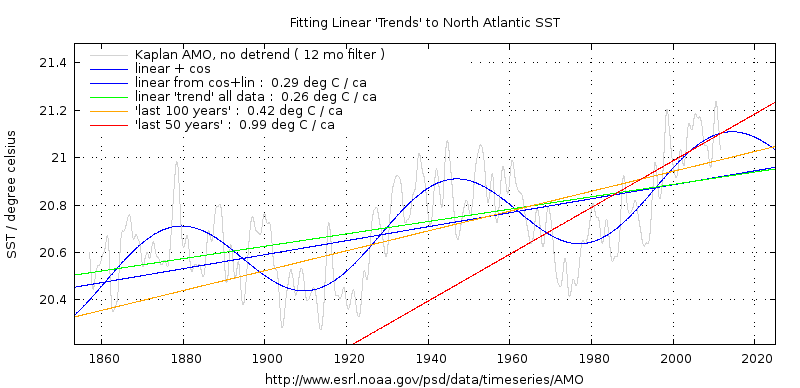
It’s the old cosine warming trick again.
https://climategrog.wordpress.com/amo_trends/
Least squares is a parameter fitting strategy not a model. Since they refer to RMS errors, I suspect that their method is also in fact using optimisation of mean squared error, just like LSQ. If they meant to say compared to fitting a linear trend, it is hardly surprising that a more complex model will explain more of the variability.
May be something got lost in the translation.
It would be interesting to see more about their “seasonal unit root analysis” but I’m not going to pay 42 eurobucks to Springer to find out.
“So how long before this paper is cited as having found ‘accelerating warming’ in Hong Kong?”
Well, it shouldn’t be. The trend, including any UHI, is less than global.
I did not use the word global. It will be cited as showing accelerating warming in HK.
http://freakonometrics.hypotheses.org/13380
Some information about seasonal unit roots for those with a strong stomach. 😉
Nick , can you explain how seasonal root is different from a seasonal cycle? The Montreal example above has a strong seasonal cycle but does not have a seasonal unit root.
Greg,
“It will be cited as showing accelerating warming in HK.”
No, the only acceleration they show (1956-2006 vs 1906-2006) is for global, and their figures are more accelerated than GISS (and why -2006?).
As to unit roots, that is just economists stuff. They are applying a random walk with drift and seasonal variation. Unphysical, but shouldn’t matter much in terms of actual trend over 40 years. They seem to think it is a big discovery to have a monthly model instead of annual, giving greater statistical power. But first, it doesn’t much, since you lose in autocorrelation a good part of the apparent gain. Second, OLS (even with auctcor) has adequate power for 40 years. And third, it’s no innovation. I use a monthly model in TempLS, with separate offsets for each month. I find no difference to the Ar(1) trends used monthly in the trend viewer.
Thanks Nick, I know this “seasonal unit root” stuff is taken from econometrics, but the root circle thing is EE Laplace transform talk isn’t it?
I don’t get the distinction between a 12 periodic annual cycle and the presence of the unit root. Can you shed some light or suggest a ref ?
Greg,
As far as I can see, they just treat the series for each month as a separate series, testing each for unit root. Which seems to mean that each month can go its own way on a random walk, which looks like a ridiculous model. But it’s a ridiculous paper. Here’s their main table of results on that stuff:
http://www.moyhu.org.s3.amazonaws.com/2016/11/hk.png
The coefficients are essentially identical for both models. I think they are claiming some tiny improvement in R^2, but the trend model has a t-value of about 5 anyway. I just can’t see how it can be taken seriously.
“But you can’t compare a trend from 1956 to a trend from 1970 and declare them similar”
Mat is right. They are similar, and certainly no proof of UHI effect. In fact, GISS global sincde 1970 has trend 0.182 °C/decade – even more than HK 0.169. So nothing screams UHI trend there. They say there is a difference to a rural site, but that can happen for various reasons, including UHI rise long ago – HK is not newly settled.
There is nothing magic about a seasonal unit root model, and it is unphysical, but economists don’t seem to care. But it just gives another estimate of trend – doesn’t say anything about cause.
GISS LOTI has been so manipulated now it’s not even worth talking about. Most of the warming in the GISS data is man made : but nothing to do with climate.
“GISS LOTI has been so manipulated now”
Untrue, of course. But OK, TempLS mesh, with unadjusted GHCN, gives a global trend from 1970 of 0.168°C. Not much different to GISS, and equal to HK.
It’s not the slightly enhanced warming trend which is the issue with LOTI, it’s that it uses the Karlised SST and has eliminated the post war cooling to be nearly flat.
He who controls the present , controls the past …. not science.
Nick Stokes November 18, 2016 at 10:20 pm
“But you can’t compare a trend from 1956 to a trend from 1970 and declare them similar”
Mat is right. They are similar
________________________
Nick, that’s priceless. If there is a comparison to be made, then compare local from 1970 to global from 1970. Choosing different start times smacks of cherry picking. You want to dispute the paper’s math, by all means go ahead. But grabbing trends from two different starting points from cyclical data and declaring them “similar” is utter nonsense.
And at end of day, comparing one spot on earth to global is also ridiculous. If I pick the right spot, I can show warming leading global temps, and if I pick another spot, I can show it lagging. More cherry picking, and more utter nonsense. Which is why the paper correctly compared to a rural location.
Not having read the paper, I will allow that the rural station would have to fall within a number of parameters to be a valid comparison, and we do not know from this abstract if that due diligence was done.
“Nick, that’s priceless. If there is a comparison to be made, then compare local from 1970 to global from 1970”
Exactly what I did. But trend is an average. It changes gradually as the intervals change.
The paper is here. Not much diligence. In fact, they are hard put to find a rural site with history at all. That is why they give a current temp comparison.
Sorry, wrong link. It’s here.
Exactly what I did
Our disagreement began when you defended Mat’s use of 1956 instead of 1970.
Sorry, wrong link. It’s here.
Excellent Nick, you gave me a link that provides exactly zero additional information without spending $40 US plus taxes.
Well, I downloaded it for free. What I did was to go to the journal page here, click on the pdf link ( of which I gave the URL), and down it came.
That’s yet another paper Nick, Ashcroft et al. If I go to the chinese paper there is not free download.
Well, I have the paper of To an Yu in front of me. I downloaded it as described, and wasn’t asked to pay. And I don’t have any special authority.
Greg. You can just scroll down a liite. Then you find the paper. Under the Ashcroft article.
Ah thanks, so the link for the paper is:
http://159.226.119.58/aas/EN/0256-1530/current.shtml#1
OK, I give up. All the PDF links on that page show the same address ( WTF? ). There must be some js object ID being passed in the onclick handler.
In short it is the 7th paper in that list and is available FOC, as Nick suggested, …. after some chasing around.
When I was in Hong Kong in 2003, I was up on the Victoria Peek lookout and I bought a picture of Hong Kong sometime in the 40’s or 50’s. Compared to 2003, there was almost nothing there! So, yes, I would say this study is a good account of UHIE.
UHI: the local UHI effect will be influenced by [lack of] wind (direction and wind speed, lift)
UHI might be enhanced by industrial cooling water. I remember to have read that power stations are supposed not to heat the river Rhine more than 2 degrees above her natural temperature. Two degrees more in the Rhine valley must have a [big] impact on regional temperatures.
But changing regional temperatures is not the same as heating up our 1.3 billion cubic kilometres (!) of ocean water – which would really mean ‘global climate change’.
theyre not measuring SST. Development of tall buildings will reduce air flow in the city and also doubtless add GW of air-con.
“Development of tall buildings will reduce air flow in the city and also doubtless add GW of air-con”
WR: It is known that UHI shows rising night temperatures. Lacking air circulation / wind can be an important factor. Lack of evaporation of trees (producing light rising air) as well. The special thing of Hong Kong is that it is surrounded by sea at at least three sides, being a peninsula and an island. Wind should easily enter and diminish the UHI. Land / mountains locked cities must have a higher UHI effect, I suppose. What about Mexico City, well known for it’s air problems because the (dirty) air stays in the City? What should the UHI effect be up there?
@ur momisugly Wim Rost. Just have a look at some modern pictures of Hong Kong. Yes, we may be surrounded by water but the curtain wall effect of very high buildings is horrendous. And the Hong Observatory site from which virtually all weather statistics are produced is far from optimum, to put it mildly.
@ur momisugly David Chappell
I visited Hong Kong several times, but never knew where the observatory was, although once my hotel was nearly in front of it. I expected the observatory to be at Hong Kong Island. Given her position, it is a perfect place for measuring the UHI effect. But still it is situated only 700 meters from the nearest water (on two sides) which shows what a tremendous impact urbanisation has on local temperatures.
Replicating the papers methods for station pairs in countries that have not experienced such rapid growth may be able to confirm this papers proposals.
Data for Australia.
Five years ago I searched for ‘pristine’ sites that could be compared with others suspected of UHI effects.
Here are the temperature properties of some 44 sites that fit the ‘pristine’ descriptor as well as being relatively free from missing data and other difficulties.
Here are the results over several Excel tabbed sheets.
http://www.geoffstuff.com/pristine_feb_2015.xls
I would be delighted if anyone uses this material to try to find some useful conclusions from it. My main conclusion was that you could not find a generalised pattern of warming when UHI was discounted. Noise dominated the data in both warming and cooling directions.
Some colleagues doing related work are concluding that significant amounts, often around 50%, of the variation in Tmax or Tmin at a given site can be accounted for by local rainfall variation. Rainfall cools. Simple physics agree. Then if you strip out the rainfall on temperature effect in the time series, much of any slope other than zero often coincides with documented changes such as site change or adoption of different thermometry gear. If you take this to conclusion, there is very little warming at many of these sites and a general conclusion that GHG are not having much effect, certainly not enough to stampeded the horses and cause coal fires electrical stations to close down. (This is before estimates of UHI are subtracted).
What a pity that the people employed to look into matters like this seem to have inconveniently kept such info quiet, or did not have the professionalism to ferret it out in the first place and come clean.
Professor Geoff Sherrington? The University of Sydney?
wow
Chaamjamal,
Sorry, wrong guy. Not me.
Geoff.
Well even if rainfall is a factor, why should this be removed? It is a part of climate, so if a change in rainfall is affecting the temp. data then, that is the way it is, it is part of what is being studied. It may be informative to study the interaction but I see no reason to remove or “correct for bias” due to rain.
It’s a bit the Karlisation issue. It had often been found that warming is more affected by milder minima than increasing maxima. The whole idea that daytime SST are “wrong” because NMAT shows more warming is just political bias and bias confirmation.
What we should be studying is WHY there is a difference and what we can learn from that about how climate functions, not trying to eliminate this information and “homogenise” all datasets to look the same.
PS thanks for the data
Greg,
Mostly, rainfall is used to plot in rainfall mode rather than in time mode, to highlight values that are anomalous for various reasons. Support, say, for a conjecture that change of thermometer housing gave a bias and so on.
Why should it be stripped out? mainly to see if the time series then goes back to zero, or to a trend that can be examined or explained further.
Besides, if you are discussing global warming as from CO2 and you can attribute a large part of a warming pattern to rainfall, then global warming severity is less, unless global warming can be shown to influence the rainfall, in a mechanistic sense.
Geoff
Thanks Geoff , but that’s the whole point. You don’t need to have a specific physical explanation of exactly how CO2 causes more rainfiall ( for the sake of argument ), you just study climate as a whole.
There is always this special pleading that temperatures need “correcting”. No, if you are studying how temperatures change you accept what they are, not what you think they should be or would be except for …. xxx which has made them warmer / cooler , whatever.
We do not understand all the interactions of climate, in fact we understand very little at all of how it all works.
If it rains more when it is warmer and that rain causes surface cooling that’s the way it is. It is probably evidence of a negative feedback and is worth investigating but there is no justification for subtracting out the supposed effects of rain to work out what temperature “really” should have been if it had not rained so much. It rained, it was cooler and that is the observation.
Greg
It is more complicated than that.
If you are working with annual data, the effect of rainfall on temperature looks rather different to that from working with daily data. You need to look at temperature changes when it rains locally, not regionally, on the day being examined, not later in the week. That way you see the detailed effects of mechanisms that could be missed in regional, monthly or annual data as more often used in GCM work.
I have always been opposed to homogenisation. The type of work I am discussing is aimed at finding more reasons why it is poor science. UHI is real and large but treated strangely silently by those paid to quantify it and its place in the trendy global warming narrative.
Geoff
Were you able to check the ratings of the sites you chose? I’m thinking of Anthony’s and his volunteers work, documenting micro-site problems with many stations. Mostly in the US.
MarkW,
Look at them on Google Earth.
There is not much to rate.
Believe me, these are rather beyond the influence of population pressure and its byproducts.
Geoff
I am neither a scientist or mathematician so I consider myself a climate laymen. But even in my ignorance I have never been able to understand why adjustments of data say for the pre 1950s has always been down and since the 1970s up. This goes against simple logic that the impact on temperature of tonnes of concrete and the reduction in meadows and pastures in the vicinity of the measuring equipment should mean the adjustments should be the other way round. Despite the inane comments by the local warmist trolls on this site the conclusions of the article makes perfect sense to me.
“I have never been able to understand why adjustments of data say for the pre 1950s has always been down and since the 1970s up”
WR: In that case, how big is the statistical chance that ALWAYS before say 1950s [many] people made mistakes that made those records were to warm and since the 1970s ALWAYS [many] people made mistakes that made those records were to cold?
I am not a statistician, but I suppose the answer must be ‘near zero’. If so, I think it is probable that somewhere [every time] ‘a choice has been made not reflecting neutrality’.
There’s always confirmation bias. One is more likely to accept without question, and adjustment that moves the data in the direction that we already believe is the proper direction. In this case, the warmistas are much more likely to accept an adjustment that increases the trend, while questioning any adjustment that would decrease the trend.
Professional scientists are supposed to work hard against this tendency. “Climate” scientists, not so much.
From the headline image it is interesting that despite UHI, there was a notable drop in temp. from 1998 to 2010, then the ramp up to 2015 El Nino high that is seen globally.
This drop is also seen in sea level data at NY Battery and in Denmark ( just two sites where I have noticed, not cherry picks, I have not made a broader study ).