From the UNIVERSITY OF EAST ANGLIA
Low growth in global carbon emissions continues for third successive year
Global carbon emissions from burning fossil fuels did not grow in 2015 and are projected to rise only slightly in 2016, marking three years of almost no growth, according to researchers at the University of East Anglia (UEA) and the Global Carbon Project.
The projected rise of only 0.2% for 2016 marks a clear break from the rapid emissions growth of 2.3% per year in the decade to 2013, with just 0.7 per cent growth seen in 2014.
The new data is published in the journal Earth System Science Data. It shows emissions growth remained below 1 per cent despite GDP growth exceeding 3 per cent.

Decreased use of coal in China is the main reason behind the 3-year slowdown.
Prof Corinne Le Quéré, Director of the Tyndall Centre at UEA who led the data analysis, said: “This third year of almost no growth in emissions is unprecedented at a time of strong economic growth. This is a great help for tackling climate change but it is not enough. Global emissions now need to decrease rapidly, not just stop growing.”
China – the biggest emitter of CO2 at 29 per cent – saw emissions decrease by 0.7 per cent in 2015, compared to growth of more than 5 percent per year the previous decade. A further reduction of 0.5 per cent is projected for 2016, though with large uncertainties.
The USA, the second biggest emitter of CO2 at 15 per cent, also reduced its coal use while increasing its oil and gas consumption and saw emissions decrease 2.6 per cent last year. USA emissions are projected to decrease by 1.7 per cent in 2016.
The EU’s 28 member states are the third largest emitter causing 10 per cent of emissions. The EU’s CO2 emissions went up 1.4 percent in 2015, in contrast with longer term decreases.
India contributed 6.3 per cent of all global CO2 emissions, with their emissions increasing 5.2 percent, in 2015 continuing a period of strong growth.
Although the break in emissions rise ties in with the pledges by countries to decrease emissions until 2030, it falls short of the reductions needed to limit climate change well below 2 degrees Celsius.
Prof Le Quéré said: “If climate negotiators in Marrakesh can build momentum for further cuts in emissions, we could be making a serious start to addressing climate change.”
The Global Carbon Budget analysis also shows that, in spite of a lack of growth in emissions, the growth in atmospheric CO2 concentration was a record-high in 2015, and could be a record again in 2016 due to weak carbon sinks.
Prof Le Quéré said: “Part of the CO2 emissions are absorbed by the ocean and by trees. With temperatures soaring in 2015 and 2016, less CO2 was absorbed by trees because of the hot and dry conditions related to the El Niño event. Atmospheric CO2 levels have exceeded 400 parts per million (ppm) and will continue to rise and cause the planet to warm until emissions are cut down to near zero.”
The Global Carbon Project’s estimation of global CO2 emissions and their fate in the atmosphere, land and ocean is a major effort by the research community to bring together measurements, statistics on human activities, with analysis of model results.
Prof Le Quéré stressed the need for reporting such as the Global Carbon Budget to inform decisions and actions on how to respond to climate change.
Dr Glen Peters of the Center for International Climate and Environmental Research in Norway, who co-authored the analysis, said: “Emissions growth in the next few years will depend on whether energy and climate policies can lock in the new trends, and importantly, raise the ambition of emission pledges to be more consistent with the temperature goals of the Paris Agreement.”
###
One thing that should be considered is that the EU and the UK are still in something of a recession.
Two factors seem to affect year to year power demand. The economy and weather.
The year I moved from California, California lost 5000 jobs. Conservation was credited for the decrease in demand.
The year after the the rolling blackouts, the new governor, Schwarzenegger, took credit for conservation when he did not have order rolling blackout on a very hot day. By my count from reading the news, 2 million were without power because of equipment failures. There was no evidence of voluntary conservation.
I like the part of the report that states
Where will that stand when China creates an additional 20% increase in power production by increasing coal use? It isn’t like China NEEDS all that additional surplus energy
Is that decreased use of coal based on China’s statistics? If so, it should be verified by that satellite that monitors CO2 emissions.
Retired Kit Phigher:
“The year I moved from California, California lost 5000 jobs.”
Better you had stayed there…
The US still hasn’t fully recovered from the recession of 2008.
Very true, in fact we are far worse off, the problems are all still there, in spades, just covered up.
The shale revolution accounted for most of the economic growth in the entire nation from 2010-2015, but now we are back to being stagnant.
Hopefully the world will move on from the social media boom onto something more substantial, i.e. the graphene age. If the feds directed all climate change funding into material science funding who knows what could be achieved.
Real US GDP (chained 2009 $ in trillions) and the EU. Growth is higher in nominal $ with inflation. In Euros, European grown is better, but the Euro has fallen compared with the dollar.
2006 14.61
2007 14.87
2008 14.83 (EU 19.03 US$T 2015)
2009 14.42
2010 14.78
2011 15.02 (first year to beat 2007)
2012 15.35
2013 15.61
2014 15.98
2015 16.40 (EU 16.23 US$T 2015)
2016 16.60 (based on Q1-3)
Stop listening to Donald Trump about America’s lack of greatness. It hasn’t been a great recovery in the US, but most of the world is doing worse.
http://www.bea.gov/national/xls/gdplev.xls
http://data.worldbank.org/region/european-union
Most of the rest of the world, Europe especially, is backing the Low Carbon meme which equates to high cost
Frank: I’ll bet you’re one of those people who would tell a kid hospitalized with MRSA that it could be worse, he could have cancer, and he should cheer up.
The total number of people working is still less than it was before Obama took office.
MARKW says: “The total number of people working is still less than it was before Obama took office.”
…
However, the facts says he’s wrong:
..
http://data.bls.gov/pdq/SurveyOutputServlet?request_action=wh&graph_name=CE_cesbref1
Reality Check: While I haven’t told a kid with MRSA to cheer up because he might have cancer, I have a family member with a disability. I do remind him about the others who have even more severe problems. If we spend all of our time focused on what is wrong with our world, we won’t make an effort to make things better. And the differences between fair, poor and failing are much more important than the differences between fair, good and excellent; both in our circumstances and in our attitude. We are surrounded by negativism. Negative ads win elections, negative news brings in advertising, and even the Weather Channel thrives on fear-casting. Hollywood and the left disdain our country. Trump’s “Make America Great Again” sickens me; give me Matt Ridley’s “The Rational Optimist”. Those who have been left behind by the last recession are likely to be disillusioned by what Trump can do to help them. Those who are thankful they don’t live in the EU, Japan, India or almost anywhere else in the world might also be help themselves.
GC and others: In terms of GDP, our economy has recovered from the Great Recession. The story is mixed in terms of employment. The data below is year, millions of jobs, % of total working age population with jobs, and % unemployed (ie actively seeking work)
2005 141.7 62.7% 5.1%
2006 144.4 63.1% 4.6%
2007 146.0 63.0% 4.6%
2008 145.4 62.2% 5.8%
2009 139.9 59.3% 9.3%
2010 139.0 58.5% 9.6%
2011 139.9 58.4% 8.9%
2012 142.5 58.6% 8.1%
2013 143.9 58.6% 7.4%
2014 146.3 59.0% 6.2%
2015 148.8 59.3% 5.3%
So we had about the same number of American jobs in 2014 as before the Great Recession, about 3 million more jobs in 2015 and further improvement in 2016. However, about 3% fewer of the Labor Department’s estimate of the potential civilian work force still don’t have jobs. This is a tragedy – both for those people who have left the labor force (possibly permanently) and for our nation’s fiscal health. Perhaps 1% of this 3% is due to an aging population and increasing numbers of people in school. IIRC, the Labor Department’s old-fashioned definition of the working population is everyone over 18. I’d really like to know how many people are their prime working years (say 25-62) and what fraction of them are employed.
For comparison, here are the averages for 1990-2004 and the best and worst years during that period. To get back to 63% of working age people having jobs, we need another 9 million jobs, about as many have been created since 2010. Taking into account demographic changes, maybe 5 million more jobs. Today’s low unemployment rate and record high number of jobs.
1990-2004 128.8 63.0% 6.0%
2000 133.5 64.4% 4.0%
1992 118.5 61.5% 7.5%
gallopingcamel, thanx for the graph… should be interesting to see how things pan out with trump going forward. At issue is his vision of high growth verses the federal reserves policy now of slowing down the economy. The unemployment rate just edged down below 5% and it’s time now for the fed to be getting nervous. (were bernanke still in charge it would be time for him to get “cranky”) My prediction is that if trump doesn’t yank janet yellen as fed chair for some one vastly more compatible with his vision then we are likely to see a one term president. If he doesn’t deliver economically, i don’t think republican’s have the needed demographics to carry trump over for a second term. Trump may be a smart business man, but if he’s as dumb about economics as all his predecessors then he’ll be in for a bumpy short ride as potus. So, keep your eye on the big fight, “trump vs the fed”. Whoever wins that one will determine the fate of the 45th presidency…
The labor participation rate is lower than it has been since Carter’s malaise. The unemployment rate does not measure those who have given up looking. The middle class has been substantially hollowed out. And, Obama is the first US President in history never to have seen 3% annual growth. The litany of failure is extensive.
Hey, Bart, see my reply way down below to your other comment to me. There i recap our discussion a while back on economics. Interested to hear what you have to say. These are (very) interesting times…
India sure isn’t. They’re easily the fastest growing CO2 source.
If they ever decide to stop being poor and follow the Chinese model for rapid economic growth, every CO2 reduction plan will be moot.
The two big carbon sinks are expanding capacity, namely the oceans and the plants.
Recently here on WUWT I think there was an article about the planet recently greening an area the equivalent of two United States. And if the oceans, over all, are cooling, that may account for any reduction.
Look for Snowball Earth coming to an election cycle near you soon.
To quote something I read in a WUWT comment thread long ago: three words: net primary production.
Okay, a few more words. What if the oceans are beginning to cool and absorbing more CO2? I’m not saying this is true, only raising the question. God knows the climate scientists we’ve all heard of won’t raise it.
What goes up can rapidly come down. If the oceans cool due to low sun activity while we humans increase agricultural production to feed yet more of us (this is going up exponentially) then we will reach a point when CO2 in the atmosphere starts to go down. If it falls below 150 ppm (and it can) all life on our planet starts to suffocate, big plants and animals first. They become extinct over a short period. The bones to be rediscovered thousands of years later.
No doubt at 200 ppm we will have many Gaian zealots still maintaining that CO2 is toxic.
Unfortunately, you can’t burn your food if you wish to eat something later. Hopefully a volcanic period, comet or meteor strike on a big forest etc will save life on our planet once again, decimation of Gaians not a requirement.
Forgot to mention the coral reefs. They will do very nicely. The Zooplankton which produce sugar via photosynthesis for the coral polyps need CO2. So a massive expansion of coral reef (assuming other things are relatively stable) is a sure sign ocean temperatures are falling and there is a lot more available dissolved CO2. This produces lots of dissolved oxygen around a coral reef. This makes other life more possible. A slow contraction of coral reefs may have caused our ancestors to crawl onto shore to continue breathing.
Unfortunately, our Gaians are direct descendants of this very long crawl. A flood event is engraved in their genes.
UK in recession? Who told you that?
“Britain will be fastest growing G7 economy this year, says IMF”
The UK has not been in recession since 2010! http://www.tradingeconomics.com/united-kingdom/gdp-growth-annual
Most of the ‘recovery’ in the UK that leads to the impression of growth is that it is fictional “wealth” created by re-inflating the housing bubble.
Cameron’s govt. provided state backed loan guarantees to low income private buyers, this allowed banks to create more loans. More available money pushes up prices of existing housing stock: simple supply and demand effects.
Does this sound a little like sub-prime lending, well it is. They were warned but needed to pull the country out of recession.
Now none of this fictional “wealth” has anything to do CO2 emissions because it is not real economic activity. So yes, Hugh, on paper the economy has not been recession. All we need to do now is to keep blowing and blowing and wait until the next time we get gum all over our faces.
The fastest dead horse in the field.
Well perhaps. With forecasts, one always has to wait and see.
But the issue is industrial growth. The UK economy is heavily swayed towards the financial services sector, and that sector is not a big CO2 emitted. The UK has been in industrial decline since the 1960s, and remains in such decline.
Let’s hope that the UK opens up its fracking, switching energy from coal to gas, and producing cheaper energy to help its industrial competitiveness.
So, when John Kerry said at the Paris accords that if the US started biking to school, carpooling to work, using solar for all our household needs, in fact he said that if the US stopped greenhouse gas emissions completely or 100% that it would not make a difference because of the rest of the world. Was anyone at all listening to what he said? The video I watched of him was from Western Journalism. Don’t know how to upload video or I would.
Th3o, just copy the links ( in the search bar at the top where it shows what you are looking at) paste them into your replies and others could add the videos. But I think once you copy and paste the addresses the vids are included in the links.
asybot, that did not work because the place it was not the place where it was from and the links had been severed. Fortunately the message queue broke through and the guy who had posted it got back to me. A couple of ministeps later and I am back here again. (need to remember not to clipboard something else interesting when coming back to a site to post) the addy is: https://www.youtube.com/watch?v=CMpd9Z8Uugg and thank you asybot for your help.
That’s not the case across the EU
this decrease as is clearly stated has taken place while there has been economic growth.
Forget about any recessions as the cause, their claims about fossil fuel burning is FUBAR
And how do you suppose those brilliant college employees figured out there was no increase in the “burning of fossil fuels”?
Well “DUH”, …… with the Mauna Loa mid-May CO2 data it wasn’t very “tuff” figuring it out.
NOAA’s Mona Loa CO2 ppm data
2012 …. 396.78 ppm
2013 …. 399.76 ppm + 2.98
2014 …. 401.88 ppm + 2.12
2015 …. 403.96 ppm + 2.08
2016 …. 407.70 ppm + 3.74
But it was really, really ….. dastardly devious and dishonest to blame any of the above noted Mauna Loa CO2 increases on emissions from fossil fuel burning.
Maximum to Minimum yearly CO2 ppm data – 1979 thru 2016
Source: NOAA’s Mauna Loa Monthly Mean CO2 data base
@ur momisugly ftp://aftp.cmdl.noaa.gov/products/trends/co2/co2_mm_mlo.txt
CO2 “Max” ppm Fiscal Year – mid-May to mid-May
year mth “Max” _ yearly increase ____ mth “Min” ppm ___ Bi-yearly ppm cycle
1979 _ 6 _ 339.20 …. + …… __________ 9 … 333.93 _____ 79/80 = -5.27 — +7.54
1980 _ 5 _ 341.47 …. +2.27 _________ 10 … 336.05 _____ 80/81 = -5.42 — +6.96
1981 _ 5 _ 343.01 …. +1.54 __________ 9 … 336.92 _____ 81/82 = -6.09 — +7.75
1982 _ 5 _ 344.67 …. +1.66 __________ 9 … 338.32
1983 _ 5 _ 345.96 …. +1.29 __________ 9 … 340.17
1984 _ 5 _ 347.55 …. +1.59 __________ 9 … 341.35
1985 _ 5 _ 348.92 …. +1.37 _________ 10 … 343.08
1986 _ 5 _ 350.53 …. +1.61 _________ 10 … 344.47
1987 _ 5 _ 352.14 …. +1.61 __________ 9 … 346.52
1988 _ 5 _ 354.18 …. +2.04 __________ 9 … 349.03
1989 _ 5 _ 355.89 …. +1.71 __________ 9 … 350.02
1990 _ 5 _ 357.29 …. +1.40 __________ 9 … 351.28
1991 _ 5 _ 359.09 …. +1.80 __________ 9 … 352.30
1992 _ 5 _ 359.55 …. +0.46 Pinatubo _ 9 … 352.93
1993 _ 5 _ 360.19 …. +0.64 __________ 9 … 354.10
1994 _ 5 _ 361.68 …. +1.49 __________ 9 … 355.63
1995 _ 5 _ 363.77 …. +2.09 _________ 10 … 357.97
1996 _ 5 _ 365.16 …. +1.39 _________ 10 … 359.54
1997 _ 5 _ 366.69 …. +1.53 __________ 9 … 360.31
1998 _ 5 _ 369.49 …. +2.80 El Niño __ 9 … 364.01
1999 _ 4 _ 370.96 …. +1.47 __________ 9 … 364.94
2000 _ 4 _ 371.82 …. +0.86 __________ 9 … 366.91
2001 _ 5 _ 373.82 …. +2.00 __________ 9 … 368.16
2002 _ 5 _ 375.65 …. +1.83 _________ 10 … 370.51
2003 _ 5 _ 378.50 …. +2.85 _________ 10 … 373.10
2004 _ 5 _ 380.63 …. +2.13 __________ 9 … 374.11
2005 _ 5 _ 382.47 …. +1.84 __________ 9 … 376.66
2006 _ 5 _ 384.98 …. +2.51 __________ 9 … 378.92
2007 _ 5 _ 386.58 …. +1.60 __________ 9 … 380.90
2008 _ 5 _ 388.50 …. +1.92 _________ 10 … 382.99
2009 _ 5 _ 390.19 …. +1.65 _________ 10 … 384.39
2010 _ 5 _ 393.04 …. +2.85 __________ 9 … 386.83
2011 _ 5 _ 394.21 …. +1.17 _________ 10 … 388.96
2012 _ 5 _ 396.78 …. +2.58 _________ 10 … 391.01
2013 _ 5 _ 399.76 …. +2.98 __________ 9 … 393.51
2014 _ 5 _ 401.88 …. +2.12 __________ 9 … 395.35
2015 _ 5 _ 403.94 …. +2.06 __________ 9 … 397.63
2016 _ 5 _ 407.70 …. +3.76 El Niño __ 9 …
The “Max” CO2 occurred at mid-May (5) of each year … with the exception of three (3) outliers, one (1) being in June 79’ and the other two (2) being in April 99’ and 2000.
The “Min” CO2 occurred at the very end of September (9) of each year … with the exception of eleven (11) outliers, all of which occurred within the first 7 days of October.
I’ll believe the atmospheric measurement of CO2 over the UEA compilations anytime. The CO2 increase will be dampened by increasing biomass consumption and oceanic deep-sinking. Does UEA have credibility anymore? As long as Phil Jones and crew are there, they’re probably issuing politically-motivated statistics.
I reviewed the CO2 page on WUWT. If human released CO2 had an affect on global CO2 levels and human CO2 emission have dropped to near zero, then you could see the drop on the Mauna Loa CO2 graph. I do not see a change in the graph. Either there is no affect, or the effect is so small it cannot be measured because it is smaller than the error in measurement. Either way, our reduction has no affect on global CO2 levels and the amount we were generating had no affect either. Therefore, Human released CO2 has no affect on global CO2 level, and any climate effect caused by CO2 is not affected by our release of CO2. Where am I wrong?
Right on Jeff.
Please re-read the article. It did not say that CO2 emissions have dropped to zero, it said that the growth in CO2 in the atmosphere has dropped to zero (or near zero) That is, the level of CO2 is constant. Neither growing nor shrinking.
Mark W
“That is, the level of CO2 EMMISIONS is constant.”
Yes, but they keep telling us that all the increases in the Global CO2 is due to the increases in Human Emissions, when it clearly isn’t.
AC Osborn,
If the rate of CO2 entering the atmosphere remains constant, that means that the total amount of CO2 in the atmosphere is increasing at a constant rate. It does not mean that the total amount of CO2 will cease to increase.
Jeff,
The natural sinks which absorb CO2 above the ocean-atmosphere (dynamic) equilibrium per Herny’s law are quite linear in ratio to the extra CO2 pressure in the atmosphere. Human emissions were – until recently – increasing every year, with as result that only about half the emissions were absorbed by plants and (deep) oceans. Net result: ever increasing CO2 levels in the atmosphere, be it with a large year by year variability due to the influence of temperature variations (especially El Niño) on (tropical) vegetation uptake rate.
If the emissions remain constant (which I suppose will not be the case when the economic crisis ends…), CO2 levels in the atmosphere will increase until CO2 emissions and net sink rate are equal. If we ever reduce our CO2 emissions – thanks to fusion – the CO2 levels will drop again until the old equilibrium (around 290 ppmv for the current average ocean temperature) is reached again…
Ferdinand,
If emissions remain constant, and natural sinks continue increasing, which is quite possible as we are far from equilibrium, the rate of increase in atmospheric CO2 will go down. This should reduce the urgency of any problem that might come due to high CO2 levels, whether real or imaginary.
Best regards.
Ferdi: “CO2 levels in the atmosphere will increase until CO2 emissions and net sink rate are equal.”
So you are agreed with me. Le Quere is talking crap. Emissions do not need to drop to zero in order for atm CO2 to stop rising. They need to drop to about half the current annual rate at which point they will equal the current sink rate.
Ferdinand is right. Emissions are higher than the natural sink rates, and they won’t match up until many years out. But …
If keep emissions right at this level, CO2 levels will stabilize at about 480 ppm in about 40 years. If we cut our emissions by about 35% gradually, we can stabilize CO2 at about 450 ppm in about 30 years.
The Greens all think we have to cut to emissions to near-Zero, but they do not understand basic math so why would one believe them about any number, let alone what CO2 emissions should be.
Natural gas combined cycle power plants are the key to the current slow-down in emissions and the eventual stabilization of CO2. They are the reason for the slow-down.
But in reality we do not need to cut them at all, a doubling would actually be better for the world.
I agree with A C Osborn. Really good point. A doubled CO2 to 560 ppm would probably be a better target. We could then decide to put it higher if this was even more beneficial.
And “warming” has only been half of what the non show THEORY projected!
I’m pretty sure green groups will consider that achievement of global climate change related policies having some effect and will ask for their continuation. I guess it needs careful analysis why it occurred first.
From my point of view, though, constant emissions still mean constant rate of increase of “human produced” CO2 in atmosphere so if the task is to stabilize or lower atmospheric CO2 concentrations, it’s not achieving anything.
It is hard to increase atmospheric CO2 when there is no economic growth.
Yet the paper clearly states that there has been economic growth, so I don’t see the point of your comment
As always, models trump reality.
I predict the atmospheric levels of CO2 are recovering from the abnormal ice age low, towards more normal levels. And human activity has a negligible influence.
See http://www.geocraft.com/WVFossils/stomata.html and http://www.geocraft.com/WVFossils/Carboniferous_climate.html
Two interesting references. Thank you.
Nothing to see here — yet:
http://www.climate4you.com/images/CO2%20MaunaLoa%20MonthlySince1958.gif
Can it be that the human contribution is not as significant as claimed?
Chris I do not know who has been doing the claiming but EPA/DOE annual reports on anthropocentric sources of ghg has always been a small fraction (10% IIRC) compared to the natural flux.
I have long maintained focusing on natural is a good way to reduce ghg emissions and produce energy. The coal bed methane program is an example.
Retired Kit,
Most of the natural fluxes are bidirectional over the seasons, while the human contribution is ~9 GtC/year (~4.5 ppmv/year) one-way addition. The net result is ~4.5 +/- 3 GtC/year increase. Thus the natural cycle is a net sink for about half the human emissions of CO2, both in the oceans and vegetation, and also the year by year variability (Pinatubo, El Niño) is only half human emissions.
The claim du jour is that emissions were flat in the past 3 years.
http://news.trust.org/item/20161114000455-vw85r/
Somebody forgot to tell the atmosphere. As the blue line above shows, CO2 in the atmosphere continued to behave just like it did in earlier years, when emissions were increasing.
This is another example of the disconnect between emissions vs how much CO2 is in the atmosphere.
Whoops!
Jurgen,
Emissions were flat, not zero and as the sinks are only about half the emissions, CO2 levels in the atmosphere continue to increase, be it at a lower speed…
Nothing to see at Mauna Loa?
Do you know who funds and runs this facility?
I am so suspicious that I am thinking of acquiring my own equipment.
Although to measure parts ppm of co2 used to be to difficult except for hugely expensive scientific equipment, there seems to be a number of commercial sensors that can handle the minute amounts and changes needed.
Here is one that is close.
http://www.vaisala.com/Vaisala%20Documents/Brochures%20and%20Datasheets/CEN-G-GMP252-Datasheet-B211567EN.pdf
There are more.
Cheers
Roger
http://www.rogerfromnewzealand.wordpress.com
Roger,
NOAA runs some 10 base stations, some 60 others are run by different groups most of them from different countries. Scripps still does take their own samples at Mauna Loa, since they lost the supervision there. If NOAA would even try to cheat with a few tenths of a ppmv, they would have to explain that to the rest of a critical scientific world while all measurement equipment is continuosly cross examined with calibration mixtures.
I only can hope one day that measuring temperature was done with the same rigor as CO2 levels are measured and continuously controlled on accuracy…
O/T Roger, how are things in Christchurch? We are all understandably upset by what happened, can you keep us posted for a day or so on this thread, I tried finding your site but with no luck.
Asybot,
thanks for your concern.
Fortunately for us, in spite having been rocked firmly in bed for more than 100 seconds and being kept awake all night by the tsunami warning, we are not directly affected by the earthquake. There has been no report of damage in Christchurch to my knowledge although a coastal bay unfortunately directly facing North had its only house written off. (tsunami)
This is because this huge seismic event occurred about 2 hours drive north of our city.
Although the epicenter and the fault movements were generlly in low populated areas, the town of Kaikoura is not only cut off but appears to be completely flattened. The army and other contractors are engaged in flying out stranded tourists and a navy ship is on its way there.
The coast road, which you may have seen on TV, looks a write off as well. Huge slips that look impossible to repair. This is a main highway and is a serious economic loss.
The quake has also wrought damage in Wellington, with at least several CBD building evacuated and some residental damage. A Wellington acquaintance who fled Christchurch when her house was written off there sustained reasonably severe damage to her Wellington home.
So all in all a bit messy north of here. Unfortunately there were two casualties, I believe they were in Kaikoura, and a miracle that no one was killed in the slips on the main highway.
Not sure why you couldnt find my website. the address is http://www.thedemiseofchristchurch.com
However if you google “rogerthesurf” quite a lot of stuff comes up.
Thanks for your query.
Feel free to seek further information as you wish. Pref on my website though.
Cheers
Roger
Here is the data from the study plotted as change in the annual rate.
Here is the rate of change at MLO compared to Le Quere’s emissions data: Note the units are scaled for comparison of form.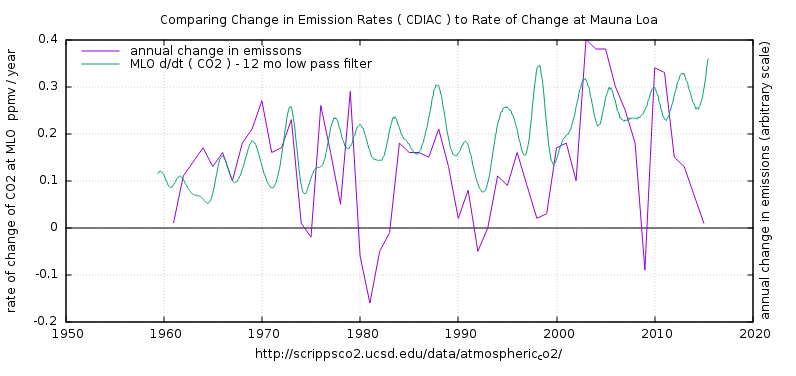
Now if CO2 emissions are supposed to be the control knob of temperature via radiative forcing, wouldn’t it at least have to be controlling the atmospheric concentration first ?
So why will annual emissions generally dropping since 2002, why has d/dt(CO2) in the atmosphere been generally rising over the same period. I don’t see a lot of correlation there.
Greg,
It is not because the year by year temperature variability has a huge influence on the CO2 rate of change variability that the emissions are not the cause of the increase in the atmosphere, neither that CO2 has no influence on temperature. The latter is very modest: some 1.1 K for 2xCO2, based on physics. The rest of the panic is based on failed climate models.
Near all of the increase is human caused, as only about half the human emissions remain (as mass) in the atmosphere. Temperature has a small influence over longer periods: about 16 ppmv/K. Maximum 16 ppmv of the 110 ppmv rise since the LIA. That is all.
Why should I believe a site that can’t even accurately identify what it is measuring?
Rhoda R,
Please, most of what is measured at Mauna Loa has passed thousands of km over the oceans and presents the average CO2 level over the NH. If they see that the wind blows from uphill the volcano, they mark the values and don’t use these for daily to yearly averages. The same for upwind conditions (slightly depleted values) from the valley. Incuding or excluding the marked values doesn’t influence the average and trend with more than 0.1 ppmv/year.
If you don’t like the Mauna Loa data, there are some 70 other stations available for your convinience…
I prefer the South Pole station, as that has no volcano or vegetation for 1000s km in the neighborhood and started a year earlier than Mauna Loa, but lacks a few years of continuosu data, which were infilled with 14-day flask samples, which are as good, as there is hardly a seasonal change at the South Pole (and most of the SH).
See: http://www.esrl.noaa.gov/gmd/dv/iadv/
Why are we discussing CO2 levels here at all? CO2 may be controlled by the big factors (ocean uptake, biomass growth, insects) or diddled by the minor stuff (industrial growth, power consumption, land-use change) – – BUT NONE OF THIS IMPACTS GLOBAL TEMPERATURES (aka “Climate Change”)
As the Mauna Loa graph shows, atmospheric CO2 has been steadily rising (yearly average) since measurements began in the 50s. Yet, global temps cooled significantly to the mid 70s, then rose about 1F to the late 90s – – then no change/nothing/niente/nichts/nada/bupkis to today
Those facts alone are sufficient to conclude CO2 has NO EFFECT on global temperatures
Thus, anything that impacts global CO2 is also immaterial to “global warming/climate change”, etc.
Let’s talk about how to get more cheap, reliable energy to the world’s poor
GeologyJim,
You can’t prove from the varaibility around the trend that CO2 has zero effect, only that it has a small effect. Natural factors (PDO and other ocean ascillations, clouds,…) may mask that, but overall there is some warming and thus maybe some (small) effect…
FE says – –
“You can’t prove from the varaibility around the trend that CO2 has zero effect, only that it has a small effect. Natural factors (PDO and other ocean ascillations, clouds,…) may mask that, but overall there is some warming and thus maybe some (small) effect…”
I was purposefully dogmatic when I said “CO2 has NO EFFECT”, because I’m not quibbling over “small effect’ vs “no effect”. To quote the former Dem presidential candidate, “At this point, what difference does it make!!”
The advocates of man-caused catastrophic global warming must be required to demonstrate the plausible truth of their assertion. Otherwise, their hypothesis is bogus.
ll empirical evidence indicates that human influences are miniscule.
Yes quite. I suspect these papers more than most. I mentioned in another comment yesterday that the “slowdown” was one of the lead items on the BBC radio news a couple of days ago
” The big El Nino of 2015-16 led to a smaller uptake of CO2 by plants.” How does that work? Especially since observations from satellite have shown a 14% increase in ” greening.” How do the plants do that while taking up less CO2?
James,
The problem is mainly in the mature forests of the Amazon: While in general quite neutral in uptake, during a strong El Niño the increase in temperature is over the top for many plants and the parallel change in rain patterns dries large parts out. The net result is temporarely more CO2 release than uptake. That reverses with a La Niña and/or restoring of the rain patterns. For the 1998 the result could be measured by the opposite CO2 and δ13C (a measure for the 13C/12C ratio in CO2) changes. If the CO2 changes were mainly from warming oceans, CO2 and δ13C changes would parallel each other. See:
http://www.bowdoin.edu/~mbattle/papers_posters_and_talks/BenderGBC2005.pdf
While the year by year varibaility in uptake is huge, most levels out to zero within 1-3 years and over longer periods vegetation is a small, but increasing, sink for CO2…
@FE- If that were true we would have seen an increase in atmospheric CO2 levels commensurate with the reduced plant uptake- so this sounds like more b.s. modelling to me.
John,
At the same time that plants overall were a net source, the oceans remained a net sink, be it also reduced by the higher ocean temperatures during an El Niño. Total effect in 1998 was that the uptake by plants + oceans was very small and that near all human emissions (as mass, not the original molecules) remained in the atmosphere.
In 1999 the El Niño was followed by a strong La Niña where the Amazon recovered and the oceans cooled, absorbing ~2 ppmv from the ~3 ppm emitted:
http://www.ferdinand-engelbeen.be/klimaat/klim_img/dco2_em2.jpg
As you can see on that graph, the Pinatubo eruption too had a large effect: not only by a small temperature drop but also by increasing photosynthesis, as many leaves normally part of the day in the shadow of other leaves were receiving scattered light from the particles in the stratosphere…
Isn’t it just following temperatures – ie the Pause – with a bit of a lag………
There was no pause and CO2 does not lag…
Griff
If there was no pause why did last 5th IPCC report reference it and why did so many climate scientists write papers attempting to explain something that you say did not exist?
“Nothing to see here — yet:”
https://scripps.ucsd.edu/programs/keelingcurve/2016/05/23/why-has-a-drop-in-global-co2-emissions-not-caused-co2-levels-in-the-atmosphere-to-stabilize/
“Note: Readers have asked why there has been no stabilization in the measured levels of the greenhouse gas carbon dioxide in the atmosphere when reported emissions of CO2 have fallen. Scripps CO2 Group Director Ralph Keeling gave this response:
There’s a pretty simple reason why the recent stabilization in global emissions hasn’t caused CO2 levels to stabilize. The ocean and land sinks for CO2 currently offset only about 50 percent of the emissions. So the equivalent of 50 percent of the emissions is still accumulating in the atmosphere, even with stable emissions. To stabilize CO2 levels would require roughly an immediate roughly 50 percent cut in emissions, at which point the remaining emissions would be fully offset by the sinks, at least for a while.
Eventually, additional emissions cuts would be required because the sinks will slowly lose their efficiency as the land and ocean start to saturate. A permanent stabilization at current levels therefore requires both an immediate 50-percent cut as well as a slow tapering thereafter, eventually approaching zero emissions. The recent stabilization in emissions might be viewed as a very small first step toward the required cuts.”
That sounds convincing but it’s really an example of policy based fact making.
The carbon cycle isn’t nearly as well understood as the IPCC would have us believe.
CommieBob,
Both Segalstad and the IPCC are wrong. Segalstad uses the residence time, which indeed is around 5 years, that is how long an individual CO2 molecule resides in the atmosphere before being swapped with a CO2 molecule from another reservoir. That does say next to nothing about how long it takes to remove an extra shot CO2 (as mass), whatever the source, out of the atmosphere.
That is like the difference between the turnover of capital and goods in a factory (= residence time) and what the factory makes as gain (or loss) at the end of a fiscal year. Although related, knowing the turnover says nothing about gain or loss…
The IPCC uses the Bern model, which assumes a saturation of the sinks at a certain level. That is only true for the ocean surface, still far away for the deep oceans and unlimited for vegetation. The real sink rate, unchanged over the past 55+ years, has a half life time of ~35 years.
I would not trust anything the University of East Anglia said. They are in the business of advocacy, not accurate science. They’ll be some new scheme or strategy behind this announcement.
Then you must examine their science and refute it using science.
Otherwise your statement is merely advocacy for the other viewpoint…
so what’s wrong with their methodology?
I’m trying to decide if that statement is more hypocrisy, or irony.
As a former member of UEA’s Environmental Science School, but a aAGW sceptic, I would suggest you separate your distrust of UEA’s advocacy from the basic science and data it produces. The measurement of human emissions of CO2 and other GHGs is basic evidence that advocates on all sides of the climate argument use. Corinne and her colleagues organize the collection of emission data worldwide. The information that emission rates have slowed come from them (and is being used by both warmists and sceptics alike). If you dismiss this data because it comes from UEA (actually it comes from the Tyndall Centre which is only partially based at UEA, and the data itself comes from worldwide sources), you have no data to use whatever.
The usual practice in science is not to dispute even an opponent’s raw data. Interpretation of that data (including evaluations of its value), especially if it includes advocacy, is fair game however.
well…..there’s nothing like moving production to China
China – the biggest emitter of CO2 at 29 per cent
The USA, the second biggest emitter of CO2 at 15 per cent,
…………. USA emissions are projected to decrease by 1.7 per cent in 2016.
But hey…it’s not a problem…we’ll just retrain everyone
…so we can stop importing people from Mexico to do the jobs they are not trained to do now
Something happened around 2000, the measured atmospheric CO2 growth plateaued.
The article,
http://www.nature.com/articles/ncomms13428#f1
recession……I know, it’s wiki
https://en.wikipedia.org/wiki/Early_2000s_recession
According to the GCP, around 2000, that’s when China’s emissions increased. Global emission rate increase after 2003, yet the atmospheric rate plateaued. Interesting findings…..
http://cdiac.ornl.gov/GCP/images/global_co2_emissions.jpg
What happened was SST plateaued.
So how come you can’t see it in the Mauna Loa graph above?
A C OSborn,
Because a growth rate of 2 ppmv/year still is a growth… If you plot the Mauna Loa data against its linear trend, you will see that it is in general a slightly quadratic curve, while in recent years it is more linear.
More than just “recent years”, Ferdinand. The rate of growth in atmospheric CO2 has been roughly constant ever since the temperature “pause”, while emissions have been accelerating in that time. I expect they still are accelerating, but someone recognized that, that just didn’t fit the data anymore. So, time for a fudge.
How would fudging emissions downwards in a way which does NOT match MLO be desirable. I’m not saying they are beyond rigging the data, that’s the “new normal” but try to be a bit logical in your claims.
If emissions have come to a standstill and atm CO2 is still rising at 2ppmv /year , it makes it look even less likely that emissions are the main cause of rising CO2 and thus temp increase or any other aspect of the 10.000 things that CO2 is supposed to be doing.
Greg – Atmospheric concentration is rising at a steady rate. That is what MLO data show. What they are doing here is claiming emissions are now leveling off, which would mean accumulated emissions would be rising at a steady rate, too.
But, the leveling off of the rate of change of atmospheric concentration started almost two decades ago, when temperatures entered a hiatus. So, they’re a day late and a dollar short.
Bart,
Besides the large monthly or year by year fluctuations, the response of the sinks to the increase of CO2 in the atmosphere still is completely in ratio to the extra CO2 pressure above the dynamic equilibrium (“steady state”) between oceans and atmosphere, according to Henry’s law:
http://www.ferdinand-engelbeen.be/klimaat/klim_img/dco2_em6.jpg
At constant emissions, the “airborne fraction”, what remains in the atmosphere, drops with still increasing CO2 pressure until emissions and sinks get equal.
“Something happened”
It’s called Temperature.
It became more or less constant.
So why is there no flattening of the steady rise shown at Mauna Low?
Yes, something happened around 2000…Al Gore lost.
British media has gone nuts about 2016 being the warmest year ever. All the experts are making big deal of already being 1.2C above pre-industrial level..
On plus side, as far as I see it, we are 1.2C further away from the new ice age, at least for the time being. We should count ourselves lucky since the global temperature could have swung the other way by 1.2C.
Little to no mention that .8 degrees of that happened before 1950 when industrialization took off.
Even less mention of the LIA.
Considering increasing temperatures worldwide the last decade(s), are there any valid figures of the consequent increases in soil-bound carbondioxide (from non human activity) and methane, anyone?
My Maple trees took care of most of it.
My exact feeling – technology and, believe it or not, simple economics will result in huge decreases in carbon emissions : molten salt nuclear reactors will become, at production costs less than 2 cents per kWhr, universally desirable and can be built in factories, and require very little site preparation, adding up to very rapid deployment. And, of course, electric cars are not far off.
Battery prices below $150 per kWhr and will drop further via automation. Electrics are intrinsically cheaper to build when battery prices are near $100, require less upkeep and maintenance and are more reliable. Evangelizing lower carbon via conservation, etc is nonsensical and unecessary.
Sheesh, isn’t that almost “too cheap to meter”?
Arthur says: ” molten salt nuclear reactors will become, at production costs less than 2 cents per kWhr,”
…
Since there are NO operating MSR’s as of today, how do you know what the productions costs really are?
C’mon folks, make some carbon! This global cooling is accelerating~!
You could reduce industrial CO2 emissions to zero and Mother Nature would still control 96% of World CO2 emissions. CO2 levels would continue to rise still. The good or bad news is that the cutting of industrial CO2 would not affect temperature as it is temperature that affects CO2 level..
Nicholas,
I don’;t think your bookkeeper would agree, you forgot to coiunt the other side of the balance: Mother Nature also controls 98% of the World CO2 sinks, that is a net loss of 2% (~2 ppmv) per year…
CO2 has no effect on world temperatures so who cares if it goes down or up?
Eugene WR Gallun
no kidding. why adopt this orphaned narrative? people who talk about co2 as if it mattered are furthering the agenda 21 fable, it’s not a refutation; it’s an endorsement.
I just have no idea why going from .23 millibars of CO2 in 1850 to .4 millibars today out of 1013 would change temps a lot. What about water vapor/ocean feedback effects? Land use change (check out NASA view of Earth at night) is another story. When it’s 50 degrees in the countryside and 60 a few miles away, in the lot area that says something.
I would propose a Global “Hold Your Breath Day” where all those who believe that Human Emissions of CO2 is bad for the world should Hold their breath for a minimum of 1 hour. Call it Earth CO2 awareness hour.
Prof Le Quéré said: “Atmospheric CO2 levels have exceeded 400 parts per million (ppm) and will continue to rise and cause the planet to warm until emissions are cut down to near zero.”
Crap, half of current emissions are getting absorbed by the biosphere. We are supposedly about 43% above the natural equilibrium, so if emissions were zero it would be plunging. If our emissions were about half current levels then atmospheric CO2 would be about stable since if is the deviation from assumed equilibrium which drives the re-absorption. . Assuming, as I’m they are assuming, that the “natural” equilibrium is still what it “should be” 280 ppmv, then zero growth would be achieved with about half the current output, not zero.
If Le Quéré does not understand physical processes better than that she should probably refrain from making ignorant, misleading claims and stick to her carbon bean counting.
Perhaps someone can explain where I am wrong about the following thought…
Since 1850 (or 1750 by some Church of AGW accounts) the ppm has risen from ~280 to 400. A rise of 120 ppm in 166 years. Humans are supposed to be adding 4% to the total CO2 in the atmosphere.
Now it is highly unlikely we have been adding 4% since the beginning of the Industrial era and likely it’s only been since circa 1950 after we ramped up manufacturing after WW2, but let’s ignore that and suppose that, from day 1 we have been adding 4%.
Near as I can figure, that means we have added 4.8 ppm in 166 years to the total CO2 content.
So where has the other 115.2 ppm come from?
Another thought I had is that we know from the ice cores that CO2 follows temps by approx 800 years or so. 800 years prior to either 1850 or 1750 we had the MWP, which lasted a couple of hundred years before declining into the LIA.
And CO2 began rising around 800 years later…
Mark, my post below was meant as a reply to yours, which I totally agree with.
MarkMcD,
The error in your reasoning is that the 4% is one-way additional to a natural cycle of 96% that is simply going in and out every year, mainly ovr the seasons. That cycle itself doesn’t change one gram of CO2 as mass in the atmosphere, as long as the natural ins and outs are equal. At this moment, the additional pressure of CO2 in the atmosphere removes about half of human emissions out of the atmosphere, as there is slightly more sink than source in the natural cycle, thus the other half still accumulates in the atmosphere. That was in average the case for the years since 1850 and certainly for every year since Mauna Loa (and the South Pole) started measuring.
Since 1850 humans have emitted some 400 GtC as CO2 (~200 ppmv), the measured increase is ~110 ppmv (plus ~10 ppmv from ocean warming)…
“And CO2 began rising around 800 years later…”
Which implies that ocean circulation is involved. This is order-of-magnitude the time it takes for an element of ocean water to travel from an absorption area (northern or southern) to an emission area (equatorial).
pochas94,
Yes, but the drop of CO2 between MWP and LIA was only ~6 ppmv for a drop of ~0.8 K. If we may assume that the MWP was as warm to warmer than the current times, that gives only 6 ppmv increase caused by warmer ocean temperatures. Not the 110 ppmv we measure above equilibrium per Henry’s law…
Thanks for your reply. Long time lags are involved. The change in CO2 level is unrelated to what is going on at present. Let me indulge. It’s about sea ice. Whatever causes these Bond events (perhaps astronomical), more sea ice means less CO2 absorption which means less emissions 800 years later. Conversely, less sea ice means more CO2 absorption which means more emissions 800 years later. Equatorial ocean temperatures are stable compared to those in the polar regions, so emissions depends only on the chemistry of the upwelling ocean water. Pure speculation, I admit.
It would be nice if we could calculate mortgage interest payments that way but unfortunately not!
Say we’ve been adding 4%/year for the last 50 years, that would mean that the level would now be
1.04^50 = ~7
In other words 7 times what we started with!
About 1%/year would yield about 1.6X the starting value.