Interesting climate sensitivity analysis: Do variations in CO2 actually cause significant global warming?

Guest essay by David Bennett Laing

In 1900, Knut Ångström concluded from a famous experiment that very little warming results from a doubling of atmospheric CO2. Although no similar experiment has been performed since, there is a simple and accurate way to tell by observing hard data from the real world. My approach in this is synthetic and not analytic, and I feel strongly that the integration of a variety of empirical data from the Earth system is essential for a good understanding of how things actually work in Nature.

Here in figure 1 is the Keeling curve, showing the steady increase in CO2 from 1959 to the present, as measured at the observatory on Mauna Loa, Hawaii:

clip_image002
Figure1 – The Keeling curve of atmospheric CO2, Mauna Loa, HI

Notice that there is an annual cycle (small squiggles) superimposed on the general increasing trend. If you average the monthly records for these cycles for each year, you wind up with the curve in the inset, which shows that, on the average, CO2 reaches a maximum concentration in the month of May in the northern hemisphere, when the CO2 from the winter’s decaying vegetation has warmed up and can enter the atmosphere, and a minimum in September-October, when photosynthesis during the summer has used up some of the CO2 in the atmosphere. The difference between the maxima and the minima is about 6 parts per million (ppm).

I have reproduced this inset curve for CO2, peaking in May, in the following graph as figure 2 (blue curve, all values in percent):

clip_image004
Figure 2 Mean monthly value comparison of temperature, ozone, and carbon dioxide from 1975-1998

I took the NOAA record of northern hemisphere temperature anomalies (red curve, above) and gave it the same treatment for the 24-year period 1975 to 1998, when the globe warmed dramatically by nearly one degree centigrade. Notice that the temperature anomaly has its maximum value in March, two months before the maximum of the CO2 curve.

Now, if variations in the concentration of CO2 in the atmosphere had any effect on temperature, you would expect that the peak in CO2 would occur with or before the peak in temperature, but it actually occurs two months afterward, which shows that variations in atmospheric CO2 cannot possibly have a significant effect on temperature. Notice, however, that there is a very small up-tick in the temperature anomaly in June, showing that in fact CO2 actually does have a slight effect on temperature, but not a significant one.

What does the green curve represent? I gave the same treatment to the record of ozone depletion from Arosa Switzerland, for the same 1975 to 1998 period of rapid warming. Notice that it peaks in March, the same month in which temperature peaks. Both these peaks are sharp, suggesting a strong relationship between the two (the correlation coefficient between the red and green curves is 0.92, i.e., very high).

This means that there is a strong probability that it is ozone depletion, rather than CO2, that is really responsible for global warming. The interval 1975 to 1998 also happens to be the period during which chlorofluorocarbons (CFCs) were introduced to the atmosphere by spray cans and leaky refrigerators, as is shown by the graph below (effective chlorine means all anthropogenic sources of chorine and bromine):

clip_image006
Figure 3 – Montreal Protocol

As is well known, CFCs break down in March (in the northern hemisphere) on polar stratospheric clouds, and the chlorine and bromine thus released cause ozone depletion, including the ozone hole. The Montreal Protocol took effect in the ’90s and stopped the ongoing destruction of ozone, but because chlorine and bromine destroy ozone catalytically, most of these chemicals are still up in the stratosphere and are still destroying ozone, as the graph above shows. It will therefore take until at least mid-century for temperature to return to normal.

But why should ozone depletion cause global warming? That happens simply because the ozone layer shields Earth from Sun’s ultraviolet-B radiation (UV-B), which is 48 times hotter than Earth’s infrared radiation. When ozone is depleted, more UV-B can penetrate to Earth’s surface. In the late 20th century, however, everyone was concerned about this causing genetic damage and sunburn, but no one thought it could cause global warming as well. Apparently, it can, however, as is shown by the second graph.

All this very nicely explains why temperature rose so fast in the late 20th century, and why it leveled off again in what has been called the “global warming hiatus” (as if Earth were doing something wrong relative to the climate models!), but why did temperature jump up again in 2015?

This probably happened because from mid-2014 to early 2015, one of Iceland’s non-explosive volcanoes, Bardarbunga, underwent the largest basaltic eruption since Laki in 1783. The erupted lavas put chlorine and bromine into the atmosphere as hydrogen chloride and hydrogen bromide, which had the same effect on the ozone layer as CFCs from spray cans. They depleted the ozone layer and admitted more solar UV-B. Now that this event is over, things can, and probably will, return to “normal,” i.e., to “hiatus” conditions.

It should be noted here that explosive, andesitic volcanoes are well known to produce global cooling because they put a lot of sulfuric aerosols into the stratosphere, which reflect away sunlight. Together, explosive andesitic and non-explosive basaltic volcanoes have been causing global cooling and warming, respectively, throughout much of geologic history, as a careful review of the geologic record attests.

The bottom line is that the demonization of carbon dioxide is probably a mistake, and is unnecessary, as is the plan to replace all kinds of fossil fuels with less efficient, more expensive, environmentally destructive, non-renewable energy sources at great expense and socioeconomic disruption. The probability is that in going after CO2, we are going after the wrong target, and it will do no good. It seems far more important to make sure that the Montreal Protocol is assiduously followed, and that CFCs are closely monitored, going forward.

For the record, I am a dedicated progressive and no friend of any of the fossil fuel industries, in which I have no investments whatsoever. I am simply concerned with doing science right and (to borrow a metaphor from Cervantes) with saving us from falling flat on our face by tilting at the wrong windmill.


Note from Anthony: when I first received this essay, and saw the title, I thought perhaps it was another one of those “slayer” arguments. But after reading it, and looking into the background of the author, I’ve decided it has merit and is worth discussing.  I did add one word to the title “significant” since the author notes in his essay that some warming is noted. From his personal page:

DAVID BENNETT LAING

Author, geologist, Earth systems scientist, ecologist, botanist, professor, sailor, alpine skier, retired, Aspie, Dartmouth ’62, Harvard ’72, progressive online activist, Penobscot Bay, Maine, Charlotte Harbor, Florida, Rio Bueno, Jamaica, park ranger, forest ranger, folksinger, copy editor, Seafarer 38 ketch, house/barn/cottage on 3.5 acres with ocean view, no debts, no regrets

  • WORK
    • The Earth System, 1991
  • EDUCATION
    • Exeter, Dartmouth, Harvard
0 0 votes
Article Rating
411 Comments
Oldest
Newest Most Voted
Inline Feedbacks
View all comments
October 10, 2016 2:31 pm

The phrase putting the cart before the horse comes to mind. The fact that CO2 lags the temperature increase simply indicates that plants don’t start growing until it warms up. If you could somehow subtract this effect then maybe you could come up with some conclusion on CO2 vs. temperature throughout the year.

John Franco
Reply to  tomcourt
October 10, 2016 4:24 pm

Regardless the cause of the CO2 concentration anti CO2/temp correlations are evident. For 2 months CO2 anomaly goes up and temp anomaly goes down. Max CO2 anomaly corresponds to 50% max temp anomaly and a steep negative temp slope.

David Bennett Laing
Reply to  John Franco
October 11, 2016 5:30 pm

Precisely, John Franco. Thank you!

Reply to  John Franco
October 21, 2016 10:05 am

And the slope of the yearly temperature anomolies and co2 ppm are the same while co2 production continues on an ever upward path. Explain that ? It not simply a variation, it’s every year since 1960 at least. Except for the last 5 where NOAA determined to fix the data.

David Bennett Laing
Reply to  John Franco
October 21, 2016 10:24 am

rishrac: Need I remind you that correlation is not causation? Furthermore, I didn’t ask that question. I only asked if any variation in the monthly record of atmospheric CO2 from 1975 to 1998 could cause significant variation in the curve for monthly temperature variation during the same period, and my graph shows clearly that it could not, since temperature variation peaks two months earlier. As I mentioned, it looks as if there is a small effect in June.

Reply to  David Bennett Laing
October 21, 2016 11:30 am

I was replying to John Franco concerning the fluctions of co2.
Of course correlation is not causation. I’m just pointing out a graph that you will never see from the IPCC and friends. If they added the co2 ppm per year to the graph with the heavy blue line showing total co2, they’d see the yearly co2 ppm bounces along with the temperature, the correlation is that co2 follows temperature, and from that there has been an overall warming trend for the rise in co2. Cosmic rays and solar activity as it tends to also have an influence as well. One can easily pick out the solar cycle activity from the cycles from different time periods when co2 ppm/year reached a peak, then declined, then reached another peak coinciding with the start of another solar cycle. The connection between cosmic rays and co2 can be seen from a departure from norm during the early 1960 s.
I’m not saying anything here that can’t be confirmed independently. Including that NOAA changed some of those numbers in the last year, and the pattern is still present.
1998 – 2.93ppm, 1987 – 2.29ppm, 1977 – 2.10ppm … and the prolonged quite staring in 2010… 2.42, 1.88, and 2. 65 ppm. Nothing higher in between, add in the fluctuations of cosmic rays and the pattern becomes very clear. Not just temperature. But co2 does lag, not lead.

David Bennett Laing
Reply to  tomcourt
October 11, 2016 5:28 pm

Subtracting that effect would nullify the analysis. My question was “Do variations in atmospheric CO2 concentration cause ambient temperature to rise?” I used the averaged monthly variation evident in the squiggles of the Keeling curve as the variations in atmospheric CO2 concentration, and I observed that, over the interval 1975 to 1998, when global temperature shot up by nearly 1 degree C, the mean monthly maximum of these natural variations in CO2 occurred in May, two months after the maxima in the mean monthly variations in temperature (March) during the same interval, and hence could not possibly have caused them.

george e. smith
Reply to  David Bennett Laing
October 12, 2016 3:09 pm

Your CO2 curve shows that about 90% of the drop occurs in about three months. At the north pole, where NO trees grow, the P_P cycle is 18-20 ppm, not six, so about 16 ppm drop in three months at the north pole, where no trees grow.
So at that rate, an excess of 120 ppm (400 -280) can be eliminated in about six times three months or a year and a half, so that is the order of the removal time constant. So a removal of 120 ppm excess by 99% can happen in about 7 1/2 to 8 years.
So any 200 year residence time is total BS.
Incidently the arctic sea ice melt starts about the same time as the CO2 starts to drop, and the CO2 drop stops at the same time as the refreeze begins in October.
This suggests that it is sea water freezing and excluding CO2 from the solid phase, that releases a bunch of CO2 to an already Henry’s Law saturated arctic sea water, so it is immediately exhaled to the atmosphere, and in March-April, when the ice starts to melt, there is a bunch of CO2 free fresh water added to the arctic ocean which then extracts it Henry’s Law amount of CO2 from the atmosphere.
It has nothing to do with trees since trees don’t grow in the arctic ocean.
G

Reply to  David Bennett Laing
October 13, 2016 8:21 am

George,
The extra CO2 near the poles is blown in from the mid-latitudes by the Ferrel cells. The measurements at Schauinsland (top of a 1000 m hill in the Black Forest, SW Germany) show a higher summer-winter amplitude…
You can’t calculate the decay rate of CO2 from seasonal changes, as the growth and wane of CO2 in vegetation is ~60 GtC in and out between the seasons (and similar for the oceans), but what ultimately remains absorbed (the extra growth of vegetation) is only about 1 GtC/year (~3.5 GtC in the oceans)…

Reply to  tomcourt
October 11, 2016 10:37 pm

That is a perfect summation for how confirmation bias models get programmed. They start with someone’s “what if” idea, regarding if numbers or data are added to modify other data.
Eventually they’ll develop a model that proves their concept. Only models are not proof; nor can they provide data in lieu of real observations.
Yes, plants grow when it warms up. Organic material also decomposes faster when it warms up.
Humidity also rises.
As the global climate models have proven; the causes and effects of climate are incredibly complex. It is very unlikely that man has discovered all causes or effects.

David Bennett Laing
Reply to  ATheoK
October 12, 2016 5:03 am

ATheoK, thank you for recognizing my attempt to create a model that would answer a question, and you are quite right in pointing out that such models don’t prove cause and effect, but in this case, the model that I created does, in fact, not prove but eliminate one cause-and-effect relationship, namely that variations in atmospheric CO2 concentration cause corresponding variations in temperature. If the mean monthly peak in CO2 variation had preceded the mean monthly peak in temperature variation, then that relation would have been possible, but it was the other way around, which renders the association not possible, unless a ten-month lag is invoked, a very unlikely scenario. Therefore, my graph does, in fact, answer in the negative the question I posed of it at the outset: “Is any variation in atmospheric CO2 actually reflected in corresponding variations in ambient temperature?”

Reply to  ATheoK
October 12, 2016 12:54 pm

David Bennett Laing:
My error for not being clear.
My confirmation model bias model comment was in reply to tomcourt’s plant/CO2 lag concept.
David:
Yes, you have proposed another example of how the alleged CO2 model doesn’t hold up in the real world.
Unfortunately, the alarmists’ who are desperate to keep their unlimited grants flowing avoid such clarity at all times.
Which is a partial explanation for their insisting on Global temperature averages and anomalies. Only by insisting on averages for a disgusting bad temperature stations distribution and installations.
Combining nearly invisible field temperatures while infilling ‘average’ temperatures or smudging temperatures from as far away as 1200km into the missing data, also allows them to ‘adjust’ legitimately recorded temperatures for not matching the new data records.
Specific locale testing for definitive CO2 impacts would theoretically allow a weather service to notify residents that expected nighttime cooling will be minimal; or humidity changes due to CO2.
The alarmists in positions of temperature control have completely ignored all negative CAGW research, including ignoring research that rebuts or invalidates CAGW foundational documents.
Following up on your warming caused by UV radiation should be a no-brainer. UV packs farm more thermal wallop when absorbed.
Connecting local ozone losses to increased UV-B penetration would also be interesting as that would affect local temperatures. Industrial and urban ozone by products would help answer that increased UHI heat puzzle that NOAA and UEA try to minimize.
While you have shown a disconnect between CO2 and temperature, It is just another uninvestigated lack of correlation in our CAGW focused world where alarmists insist their theory is the null, (existing) hypothesis. A circular argument presented here by literally legions of crank trolls.
Should that lack of correlation be investigated, yes!
I agree that the troposphere is well mixed. I still have doubts that big heavy molecules reaching the stratosphere without being destroyed along the way by troposphere ozone.
Bromine and chlorine have been proved by air flight samples, to reach the stratosphere where they are reduced to more stable states by ozone. Your friend Peter Ward may indeed be correct in his volcanic emissions scenarios. Again, the reminder that mankind still does not know the actual age or status of ozone holes. Given the recent maximum ozone hole state, it looks likely that ozone holes are normal; and may even contribute to speciation increases.
Summary:
Validate UV contributions to temperature.
Validate local ozone depletions to increased UV.
Verify the lack of CO2 to temperature alignment beyond the influences of oceans, plant life, decomposition.
Nail that dang CAGW coffin shut!

george e. smith
Reply to  ATheoK
October 12, 2016 3:18 pm

So what is “progressive” about denying readily available energy from reliable sources, to the untold millions on this planet, whose lives could be enhanced dramatically with little more than a small fraction of the reliable energy that is available in the developed world.
In my view, “progressives” whether activist or not are just about the most regressive force in today’s complex world.
Grow up.
G

David Bennett Laing
Reply to  ATheoK
October 13, 2016 5:47 pm

George: I agree with you there.

Reply to  tomcourt
October 12, 2016 2:13 am

Yes, the annual data is polluted by photosynthesis and shows nothing about temperature and CO2 (which is a GH gas and will raise averagge temperatures).

David Bennett Laing
Reply to  Matt
October 12, 2016 5:04 am

See my comment to tomcourt, above.

Stuart Nachman
October 10, 2016 2:37 pm

It is worth noting that he is retired and thus not chasing federal grants for research. It will be interesting to see what the experts commenting here think of his theory.

Reply to  Stuart Nachman
October 11, 2016 5:24 pm

Having read a longer version of DAVID BENNETT LAING’s biography online, I was exhausted just reading about all that he has accomplished in his life.
However the author said:
“For the record, I am a dedicated progressive and no friend of any of the fossil fuel industries”.
That sentence is proof of weak thinking ability, so I would take his article with a large grain of salt.
And he appears to be a “progressive” who does not demonize CO2 — that’s strange — remember that the progressives are now selling their big government socialism, and the resulting slow economic growth, by claiming they are trying to “save the Earth.
I call it “Save the Earth from CO2 Socialism” — based on the bizarre desire for slow economic growth … which is claimed to be good news, because economic growth/fossil fuels are allegedly killing the planet.
Anyone who demonizes fossil fuels MUST hate poor people — at least 1.2 billion poor people NEED fossil fuels to improve their unhealthy, electricity-free lives. …
… meanwhile Mr. Laing, with his “Seafarer 38 ketch, house/barn/cottage on 3.5 acres with an ocean view”, could not care less about the poorest people on our planet, desperate for better, longer, healthier lives using fossil fuels.
More important:
(1) The cause of climate change is unknown.
(2) Earth’s climate has been changing for 4.5 billion years.
(3) CFCs definitely had nothing to do with climate change in 99.9999% of the past 4.5 billion years.
(4) Climate change in the past 135 years has been nothing unusual, based on everything we know about climate history.
(5) There is no reason to introduce a new variable, CFCs, when there is nothing unusual happening, other than to speculate.
(6) Let’s not forget that the average temperature claimed to have stayed within a 1 degree C. range in the past 135 years — does anyone think that was abnormal climate?
(6) If I am wrong, and the climate HAS been abnormal in the past 135 years, then I’d say the only thing “abnormal” … was that the average temperature was abnormally stable in the past 135 years.
(7) Since the average temperature is always changing, and our planet is not in thermodynamic equilibrium, there is no reason to assume a 1 degree C. change is anything more than a meaningless random variation — probably combined with measurement errors
(8) The climate in 2016 is better than it has been in at least 500 years, based on the and “health” of humans, animals and plants on our planet.
(9) The past 135 years, with a mere 1 degree C. of climate change, was the most prosperous and healthy 135 period ever for humans on this planet.
My climate blog for non-scientists
Free
No ads
No money for me
A public service
Leftists should stay away or risk high blood pressure
http://www.elOnionBloggle.Blogspot.com

David Bennett Laing
Reply to  Richard Greene
October 11, 2016 5:53 pm

Richard, Perhaps I should have said “old progressive” (I’m 76), which basically translates into a fair deal for everyone, and no special favors. Steal from the rich (privileged) to give to the poor (disadvantaged) sort of thing. I “like Ike” (he was the best president I can remember), I bought my 1974 Seafarer ketch for the same amount I sold it for a couple of years ago to pay some medical bills, ($15,000), and I live on a fixed income of a little less than $1400 a month. Basically I agree with almost everything you say, so why can’t we just get along?

Reply to  Richard Greene
October 11, 2016 11:18 pm

Outside of Richard Greene’s negative impressions of David Bennett Laing, I quite agree with him.
Let’s rephrase the charts and data presented.
• A theory is presented. Ozone concentrations match temperature changes.
• • Actually there are a number of smaller assumptions or included theories.
• • a) Incoming UV-B radiation causes the warming.
• • b) Loss of ozone allows more incoming UV-B
• • c) CFCs and halon gasses cause the ozone reduction.
• • d) The Montreal Protocol is fixing the ozone loss
This theory represents a leap from one assumption to another; most of which are untested and unproven.
Man discovers an ozone hole.
• The truth is, man is assuming the ozone hole in new.
Man claims to discover a cause for an ozone hole.
• An ozone hole of unknown cause and/or age
• Laboratory tests highlight CFCs and Halon can cause ozone loss.
• Chlorine and Bromine are often mentioned as if they are man caused; but the ocean is a primary source.
• There are zero tests to prove that some of the heaviest gas molecules ignore gravity and float up through the stratosphere. Especially when there is plenty of ozone within the lower atmosphere.
• There is a claim that certain CFCs act on ozone catalytically. Only ozone is strongly reactive and more than happy to use CFCs in finding a lower state.
• An ‘estimated’ graph of CFCs and halons titled as linked to the Montreal Protocol is shown. Estimations are just that, they are not accurate global measurements. A critical factor as refrigeration and air conditioning spread throughout the world; most of which is not very accurate in reporting inconvenient data.
Man claims that higher UV-B levels cause higher temperatures. Rough graphs using ozone as a proxy show good correlation.
• Correlation is not causation.
• Correlation is not demonstrated with UV-B.
• Ozone is reactive and therefore subject to many influences.
• UV radiation is one source for causing ozone.
Let’s just say that I’m interested in the concept that UV radiation is a factor in causing increased temperatures; but we are a long way from solidifying any part of that theory. Even after divorcing it from ozone, cfcs, halons, chlorine and bromines.

David Bennett Laing
Reply to  Richard Greene
October 12, 2016 5:54 am

Richard Greene, you are quite right in pointing out that there are a lot of assumptions built in to assessing the cause of ozone depletion, but I did not go there. Assumptions aside, what my graph does is two things: 1) it indicates that variations in atmospheric CO2 couldn’t possibly cause variations in temperature because the latter precedes the former by two months, and 2) that ozone depletion, as calculated from the measured values in Dobson units at Arosa, Switzerland, COULD be a cause of temperature anomaly variations, because they peak in the same month (March) and the curve is well-correlated (r^2=0.92) with the temperature variation curve. This suggests that it would be a good idea to investigate ozone depletion as a POSSIBLE cause of temperature variation. Do you know of anything that gives a closer correlation with temperature variation than r^2=0.92?If so, we should look at that, too.
Two points:
1) The troposphere is well-mixed, and there is no reason that even heavy CFCs could not be carried upward to polar stratospheric clouds, where they could be photodissociated by Sun’s UV-B radiation.
2) Non-explosive (basaltic) volcanoes emit HCl and HBr in significant quantities. They do not produce eruption clouds, and therefore do not produce sulfuric stratospheric aerosols that could contribute to global cooling. My colleague, Peter Ward, thinks that they contribute to warming through ozone depletion, and this should be properly investigated.

Reply to  Richard Greene
October 14, 2016 11:28 am

Okay Laing you have turned the tables and created great sympathy for yourself.
You progressives are still backwards thinkers who live for bumper sticker slogans / platitudes such as “Pay Your Fair Share” … and then you never define “fair share”.
Last time I looked at data, the top 1% paid about 40% of all federal income taxes paid … and that percentage would be higher if earned income credits were counted as negative income tax revenue.
If 40% is not enough, then tell us the precise percentage that is enough !
You smarmy progressives never provide a number.
Because you don’t want a debate.
And how dare you write: “Basically I agree with almost everything you say …” ?
Everyone knows the internet was originally designed as a practical joke by computer nerds to promote vicious arguments among strangers, culminating with the two berserk “debaters” TYPING ALL CAPS and comparing each other to Hitler.
Of course we could get along … but that would be no fun.
NASA reported that from September 7 through October 13, 2015, the Ozone Hole reached a mean area of 25.6 million kilometers, the largest area since 2006 and the fourth largest since measurements began in 1979.
The ozone hole remains large, despite the fact that world ODS consumption disappeared a decade ago.

Christopher Paino
October 10, 2016 2:37 pm

Still not sold on CFCs affecting the ozone layer. I always get wary when I see the words “as is well known.” Is it? Online research into the research is confusing. Many bright, poorly designed web pages are involved.

Peter Morris
Reply to  Christopher Paino
October 10, 2016 4:45 pm

Same here. I have no problem stating that massive releases of CFCs does… something … to the environment, but I’m still not convinced that a bunch of leaky refrigerators and foot high hairdos across America caused the antarctic ozone hole.

Paul of Alexandria
Reply to  Peter Morris
October 10, 2016 6:55 pm

My question is: how do heavier-than-air CFC’s get into the stratosphere?

Catcracking
Reply to  Peter Morris
October 10, 2016 9:40 pm

Paul, That is a good question which I think there is a lot of confusion.
My explanation is that given enough time, all gasses mix uniformly in a nominal size container regardless of density of the gas, the behavior in a large atmosphere may be different. Looking at it another way gases mix according to their individual partial pressures not the total partial pressure of the container, while gases are a fluid they do not stratify permanently as liquids do as they separate into a layer like oil/water according to their density, assuming they do not mix as alcohol/water do . Of course the partial pressures are lower at high elevations so it is more complicated
If anyone has a different explanation I would welcome a correction.

Graemethecat
Reply to  Peter Morris
October 11, 2016 2:20 am

I’ve always had a problem with the CFC hypothesis for ozone depletion. Perhaps a reader can put me straight on this. Briefly, if CFCs are being photo-dissociated in the stratosphere and thus destroyed, how come they are still there decades later? I understand that the process of ozone destruction is catalytic in atomic chlorine, but I can’t see how these atoms are still present after such a long time. All chain reactions terminate eventually. Manufacture of these compounds was banned over a quarter of a century ago, so there should be no more release to the atmosphere to replenish the supply.

Michael J. Dunn
Reply to  Peter Morris
October 11, 2016 1:46 pm

For Graemethecat: True, the CFC are dissociated…but they are not destroyed. The carbon and hydrogen components go to CO2 and H2O readily enough, but the chlorine just lingers around as a catalyst. Catalysts are not consumed. What becomes of the chlorine ultimately…who can say? If there is a process that brings further chlorine to those altitudes, in order to have a stable equilibrium there is probably a diffusion of chlorine back to lower altitudes, where it may combine with other elements to form salts.

Robert Grumbine
Reply to  Peter Morris
October 13, 2016 1:46 pm

Paul:
It’s attractive indeed to think of the molecule’s mass as being important. CFCs are massive, so ‘should’ be lower in the atmosphere. But continue to apply that thinking. H2O is very light, 18 amu, N2 is light, 28 amu, average (dry — non-H2O) air is about 29 AMU, O2 is 32, CO2 is 44, Freons 50-120. If your idea of heavier gases being lower in the atmosphere were correct, there should be no water vapor in the lower atmosphere, and people near sea level should be breathing mostly CO2 with perhaps some Argon (40).
The thing is, as any of us who have seen a strong thunderstorm gust front, or strong frontal boundary, pass through and kick leaves (way, way more massive than mere molecules!) several stories up — the lower atmosphere is turbulent. There is far more than enough kinetic energy around to stir mere molecules. Consequently, it is observed that the lower atmosphere is well-mixed (uniform composition in the unreactive gases that don’t have large surface source/sinks).
You can then ask the observations just how far up this ‘well mixed’ property extends. Answer is 80-100 km. Above that gases do separate by molecular mass, O2 being mostly down near that boundary, N2 extending farther, and He leaking off to space.

David Bennett Laing
Reply to  Peter Morris
October 13, 2016 6:03 pm

Graemethecat: It isn’t CFCs that destroy ozone; it’s chlorine photodissociated from the CFCs by sunlight on polar stratospheric clouds when Sun returns to the northern hemisphere in late spring. The chlorine then destroys ozone by taking one of the the oxygens from the triatomic ozone molecule forming a normal oxygen and chlorine monoxide (ClO), which then combines with monatomic oxygen to form a normal diatomic oxygen and releases the chlorine to destroy more ozone. The cycle repeats indefinitely.

Alan Ranger
Reply to  Christopher Paino
October 10, 2016 6:02 pm

I tend to agree. Whilst a lack of correlation (CO2) certainly dismisses any claim of cause and effect, an apparent correlation (CFC/ozone) does not (on its own) lend any weight to a claim of another cause and effect.

David Bennett Laing
Reply to  Christopher Paino
October 11, 2016 5:56 pm

It’s certainly good to be skeptical, Christopher. I’ll let you hash that one out with Mario Molina.

Ross KIng
October 10, 2016 2:44 pm

Very interesting and persuasive.
IPCC shd concentrate its efforts on banning ‘bad’ volcanos and promoting ‘good’ ones.

David Bennett Laing
Reply to  Ross KIng
October 11, 2016 5:58 pm

Tx, Ross! How about another Toba (VEI=8)?

Tom Halla
October 10, 2016 2:50 pm

Interesting hypothesis, but a pain to test.

David Bennett Laing
Reply to  Tom Halla
October 11, 2016 5:59 pm

That’s precisely what I did with this graph, Tom.

Editor
October 10, 2016 2:50 pm

David, thanks for an interesting analysis. I agree with you that CO2 has little effect on global temperatures.
However, I do not think you’ve demonstrated what you claim. Yes, in the short term, the variations in temperature and daylight length cause corresponding variations in atmospheric CO2. I think of it as the annual cycle being like the daily cycle—for something around half the time the plants and soil are taking up CO2, and for the other half they are emitting CO2.
However, this is a very different physical situation and different question from the long term relationship of CO2 and temperature. Short-term, the change in atmospheric radiative balance is small. The CO2 concentration varies by about ± 3 ppmv over the course of the year. That’s a variation of less than 1%, and is lost in the noise.
But when the CO2 doubles, that’s a change of 100% … and you simply cannot extrapolate from one situation (a ± 1% change in CO2 concentration) to the other situation (a doubling of CO2). Different physics comes into play, the two situations are not at all comparable.
Best regards,
w.

commieBob
Reply to  Willis Eschenbach
October 10, 2016 4:20 pm

… you simply cannot extrapolate from one situation (a ± 1% change in CO2 concentration) to the other situation (a doubling of CO2). …

It depends on which 1% you’re talking about. Given that the effect of CO2 is logarithmic, the first 1% change will have a relatively larger effect than the last 1%.

Reply to  Willis Eschenbach
October 10, 2016 5:35 pm

David L, I agree with Willis. Over a seasonal cycle, there are other factors which affect temperatures much, much more strongly than do the slight seasonal changes in CO2 and O3 levels. So I don’t think it is reasonable to conclude that the phase relation between them and temperature means O3, rather than CO2, is what is driving temperatures.
However, the rest of what you wrote is very interesting, especially the correlation between effective chlorine concentrations and temperature rise through the 1980s and early 1990s. Thank you for giving us some things to think about.

Greg
Reply to  daveburton
October 11, 2016 3:54 am

what David Laing has discovered here is that short term CO2 variations bear a strong similarity to changes in SST suggesting that a significant portion of that change is due to outgassing of the oceans. This has been pointed out a number of years ago by Allen MacRae and others.
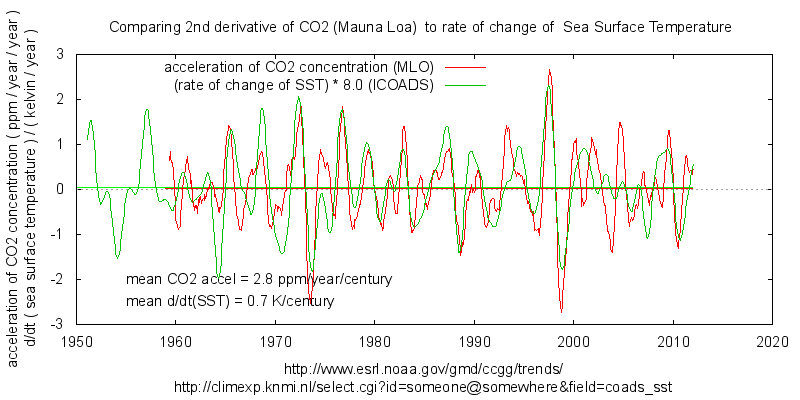
This can been by plotting the rate of change of CO2 against SST:comment image
Or taking further derivatives of both quantities:comment image
These comparisons show a rate of change of 8ppm/year/kelvin for inter-annual variation. This is the out-gassing of the well mixed surface layer of the oceans. Isolating the biggest spike in the record : the 1998 El Nino gives a similar 9ppm/year/kelvin sensitivity to temperature change.
This does not necessarily show the same thing is responsible for longer term changes, so some of the claims in the article are unsubstantiated.

Greg
Reply to  daveburton
October 11, 2016 4:04 am

BTW the scaling of the first graph was chosen to align the interdecadal changes and there is a ratio of about 3 ppm/year/kelvin rather than the stronger changes of the inter-annual scale. So the short term swings are seen larger than the swing in SST. It still allows to see the similarity.
The correlation is strongest during the late 20th c. warming.

Greg
Reply to  daveburton
October 11, 2016 4:18 am

What does the green curve represent? I gave the same treatment to the record of ozone depletion from Arosa Switzerland, for the same 1975 to 1998 period of rapid warming. Notice that it peaks in March, the same month in which temperature peaks. Both these peaks are sharp, suggesting a strong relationship between the two (the correlation coefficient between the red and green curves is 0.92, i.e., very high).
This means that there is a strong probability that it is ozone depletion, rather than CO2, that is really responsible for global warming.

Again, the phase of the annual cycle does not really justify this claim, though David is right to point out the importance of ozone. However, the attribution of the changes to CFC et co. is largely spurious as is the follow on conclusion that the Montreal Protocol is saving the world.
The temperature of the lower stratosphere , where the ozone layer resides, reveals the true cause of the late 20th c. loss of ozone: major stratospheric volcanic eruptions.comment image
https://climategrog.wordpress.com/uah_tls_365d/
The subsequent recovery is largely due to natural regeneration and the lack any major eruptions since 1991. Sorry, UN, you did not save the world that time either. Try as you may to spin it.

Reply to  daveburton
October 11, 2016 11:21 am

Greg,
While the graphs show the correlation between temperature change and CO2 change, it is not the release from the oceans which causes the peaks in CO2 rate of change, it is mainly tropical vegetation as that is very sensitive to temperature and related droughts during El Niño conditions. That can be seen in the opposite CO2 and δ13C changes. If the releases were from the oceans, the CO2 and δ13C changes would parallel each other:
http://www.ferdinand-engelbeen.be/klimaat/klim_img/temp_dco2_d13C_mlo.jpg
The extra release followed by extra sinks (during La Niña’s and Pinatubos) in the tropics only forms a small variation of +/- 1.5 ppmv around the trend of 70 ppmv since Mauna Loa started.

Reply to  daveburton
October 11, 2016 10:27 pm

Ferdinand:
For the last several years NOAA has an OCO-2 satellite measuring global CO2; a fact that NOAA strenuously avoids. Given the recent example of RSS, NOAA is likely pressuring staff to ‘control’ the OCO-2 data.
January 2015 to Feb. 15th 2015comment image
Feb 16th to March 31st 2015comment image
April 1 to May 15th 2015comment image
May 16th to June 30th 2015comment image
July 1st to August 15th 2015comment image
August 16th to Sept. 22th 2015comment image
showing CO2 over the entire year from September 2014 to October 2015comment image
Forests and jungles may contribute most of a net CO2 increase over the course of a year; but there are significant movements of CO2 from and into the oceans over the courses of the seasons.

Reply to  daveburton
October 12, 2016 7:49 am

ATheoK,
Based on oxygen, δ13C and CO2 changes, one can deduce the main movements:
Vegetation: ~ 120 GtC (day) uptake and ~120 GtC release (part night release, part continuous decay).
The nightly expiration from leaves and soil and daylight photosynthesis are good measurable and especially under inversion. CO2 levels in a forest can reach 500-600 ppmv and higher at night. In daylight that rapidly drops to slightly below the bulk of the atmosphere, depending of stirring up the near-ground air layers by warming them up.
Most of the day/night change doesn’t reach the bulk of the atmosphere, only the daily difference, which over a season reaches ~60 GtC uptake (spring – summer – fall) and ~60 GtC release (fall – winter – spring).
The remainder is what rests at the end of the year: ~1 GtC more uptake than release.
The oceans have opposite movements: ~50 GtC release in summer months and ~50 GtC uptake in winter.
Besides that, there is a continuous flux of CO2 between upwelling deep ocean waters near the equator which are warming up and downwelling cold waters near the poles of ~40 GtC release and uptake.
The seasonal change in CO2 is entirely of the oceans surface, which currently takes ~0.5 GtC/year out of the atmosphere in winter more than it releases in summer, while the continuous flux is hardly influenced by temperature and removes ~3.5 GtC/year into the deep oceans to return some 1000 years later, if not mixed with the bulk of the deep oceans…
Globally, most of the CO2 changes in vegetation are in the NH, most of the SH changes are in the oceans. As both land and ocean and NH and SH show opposite CO2 movements, the net result is a global change of ~10 GtC (~5 ppmv) amplitude for a global (seasonal) change of ~1 K, most of it over land from vegetation in the NH.
My impression is that there are still a lot of problems with the satellite:
– The satellite measures only in daylight, rapid movements like photosynthesis are only momentary sampled (around midday) and underestimate average CO2 levels in forests.
– In general, the satellite measures levels, not fluxes.
– Even so there are quite large discrepancies: the largest sink into the deep oceans is in the N.E, Atlantic, where the Gulfstream ends and the THC sinks. According to the satellite, the yearly average levels there are one of the highest.
That is opposite to ocean measurements, where the calculated flux, based on local measured pCO2 differences between water and atmosphere and wind speed, the uptake is maximal and the CO2 levels in the atmosphere should thus be minimal… See:
http://www.pmel.noaa.gov/pubs/outstand/feel2331/mean.shtml
and the sea – air flux map:
http://www.pmel.noaa.gov/pubs/outstand/feel2331/images/fig06.jpg

Reply to  daveburton
October 13, 2016 2:31 pm

Again Ferdinand?
You are living in a world of estimates which are mostly guesses (WAG).

“one can deduce the main movements”

Richard P. Feynman:

“In general, we look for a new law by the following process. First, we guess it (audience laughter), no, don’t laugh, that’s really true. Then we compute the consequences of the guess, to see what, if this is right, if this law we guess is right, to see what it would imply and then we compare the computation results to nature, or we say compare to experiment or experience, compare it directly with observations to see if it works. 

If it disagrees with experiment, it’s wrong. In that simple statement is the key to science. It doesn’t make any difference how beautiful your guess is, it doesn’t matter how smart you are who made the guess, or what his name is… If it disagrees with experiment, it’s wrong. That’s all there is to it.”

1) First it’s Ferrell cells move all of the CO2 to the poles, nearly instantly. But satellites do not sense the CO2 during movement. yeah right.
2) Then it’s don’t trust the satellite data, because it is only observations during the day.
3) Then it’s in forest measurements respiration increases CO2 concentrations at night, but photosynthesis will remove all the respired CO2 and then some the next day.
4) Then it’s “δ13C and CO2 changes” baffle gab; another estimate based on someone’s theory.
Etc. etc…
Anything but reality, huh?
The satellites represent the best method, and especially the best overall global method for sampling CO2.

Ferdinand says: “Uptake and Storage of Carbon Dioxide in the Ocean: The Global CO2 Survey” Richard A. Feely1, Christopher L. Sabine2, Taro Takahashi3, and Rik Wanninkhof4;
“To illustrate the sensitivity of the gas transfer velocity and thus the sea-air CO2 flux to wind speed, we have estimated the regional and global net sea-air CO2 fluxes using two different formulations for the CO2 gas transfer coefficient across the sea-air interface: the quadratic U2 dependence of W-92 and the cubic U3 dependence of W&M-99. In addition, we have demonstrated the effects of wind-speed fields on the computed sea-air CO2 flux using the National Center for Environmental Prediction (NCEP)-41 mean monthly wind speed and the NCEP-1995 mean monthly wind speed distributions over 4° × 5° pixel areas.”

Another climate “What if” dream model where people make models dance and sing their favorite CO2 movements.
Models are just some programmers best understanding of what the client wants; not world shaking data producers in lieu of reality.
Estimates are some deskbound bean counter’s best guess for what to tell the boss when asked. Estimates do not replace reality, ever.

Reply to  daveburton
October 13, 2016 4:22 pm

ATheoK,
I suppose that we may agree that the satellite measures levels of CO2, not fluxes.
The ocean fluxes are calculated by measuring the pCO2 of the oceans (over three million samples up to now) and calculating the flux, which is directly proportional to the pCO2 difference between ocean waters and atmosphere. The other factor is wind speed, as simple diffusion of CO2 in water is very slow and wind speed makes that it mixes (much) faster. The wind factor was derived from:

The quadratic relationship of Wanninkhof (1992) was constructed to follow the general shape of curves derived in wind-wave tanks but adjusted so that the global mean transfer velocity corresponds with the long-term global average gas transfer velocity determined from the invasion of bomb 14C into the ocean.

In my opinion, that is not a best guess or estimates or theory, but theory tested in large lab conditions and adjusted to what it was in the real world.
The calculated flux in the N.E. Atlantic is based on real, observed data pCO2 data in water and air, where the wind factor also is based on observed real world data.
Even if the factor is wrong, fact is that the pCO2 difference in the N.E. Atlantic is the highest of the world (and wind speeds there are often extreme). It is the main sink for surface water into the deep, taking lots of CO2 (~40 GtC/year) with it.
That does conflict with the satellite data which averaged over a year show one of the highest CO2 levels in that area. Thus one of these two must be wrong. In my opinion the satellite, as higher levels in that area are impossible, as it is one of the largest sinks of CO2 in the world.
By looking again at the graphs, there is a possible cause, as mentioned in an earlier discussion about the OCO-2 data: in winter the main sink place is in the dark, thus not measured by the satellite. That can skew the yearly average results towards more CO2…

sludge
Reply to  Willis Eschenbach
October 11, 2016 10:38 am

“Different physics” when co2 is doubled?
What is different?
It is all about heat transfer, isn’t it? Since all claims of absorption and temperature in the atmosphere are arguments about heat transfer?
A strange thing about any level of co2 is that its absorption of energy, and especially increased absorption, makes the temperature go up. This is the opposite of what we learn in heat transfer. If absorption of thermal energy increase, one of two things havet happened: either the hotter body got hotter or the colder body got colder.
The only thing that increase the transfer is bigger difference in temperature. Absorption of thermal energy is heat transfer, co2 is no exception. The claim is that increased absorption cause high temperaturen, this is the opposite of what physics tell us.
If absorption increase the temperature difference has increased, regardless of why absorption increased. De know that irradiation is constant so the change must be caused by the atmosphere getting colder. If the atmosphere got colder rather than the surface warming first, the larger delta T will result in higher rate of transfer from the surface to air, that will also lower surface temperature. A radiative imbalance is a result of either cooling of the atmosphere or heating of the surface. Never both. The system can only do one thing at a time, heat up or cool down. Increased absorption is equal to more transfer of heat from the surface. That will only cool both bodies.
There is reason for using non-absorbing gasses instead of co2 when making insulating Windows. An absorbing gas will transfer heat. Ir-absorption in a gas always transfer heat away from the heat source to a colder location. Absorption of IR in any gas above the surface will cool it, because any absorption of heat by anything else than the surface will heat the gas instead. And move the heat to a colder place, which is the opposite direction than towards the surface.

Reply to  sludge
October 11, 2016 11:31 am

sludge,
Please read something about CO2 lasers: their temperature may go up to some 100°C. Despite that low temperature the IR beam does melt steel at 1200°C. Simply because one has laoded a lot of energy into the CO2 molecules which send that energy outwards as IR light, no matter its own temperature.
The same for the earth’s surface: that is heated by sunlight and that heat gets out as IR radiation, of which CO2 picks a part and distributes that in part to the neighboring O2 and N2 molecules, thus heating them up…
Still at height the air is colder than near ground, thus physics still hold: heat flows from warmer to colder objects and no energy is created or destroyed…

SkepticGoneWild
Reply to  sludge
October 11, 2016 12:42 pm

The CO2 laser analogy is bogus. You are comparing apples and oranges. How in the world can one compare a powered laser with the atmosphere? There is no comparison whatsoever. What’s next? An analogy of cool microwaves heating your dinner to 350 degrees F?
Try standing in an ice cave. Your body is being bombarded by a huge amount of IR radiation coming off the ice. Are you going to warm up?

Reply to  sludge
October 11, 2016 1:49 pm

SkepticGoneWild,
The analogy is apt for what sludge said: it is impossible that absorption of energy does increase the temperature of the atmosphere. That is simply wrong as good as expecting that the lower temperature of the laser will not cut steel…
Even in the case of standing in an ice cave: your body receives less IR from the ice than you emit yourself, so you are cooling down, but less fast than when you were standing in a fully transparant (for all wavelengths) box in space…

Michael J. Dunn
Reply to  sludge
October 11, 2016 2:04 pm

Sludge and SkepticGoneWild, go back to the books. Photons have no “temperature,” and you just go daffy trying to draw conclusions from a false concept. The CO2 in the atmosphere doesn’t get warmer from the IR: it both absorbs and RE-RADIATES infrared photons. No net change in temperature, so long as equilibrium conditions prevail. It would help if you think of the “greenhouse gases” as being a big beam-splitter for certain bands of the IR spectrum, casting half the photons back to the ground and the other half up into space. It is an insulator. The Earth’s SURFACE warms accordingly…and heats the atmosphere by contact and conduction.
Oh, yes. The ice cave. It is fair to say that your body is bombarding the ice with more IR than the ice is bestowing on you. You are getting cold and (maybe) the ice melts.
And high-powered lasers and the atmosphere? They interact very strongly. I should know; I designed laser weapons for a living.

Reply to  sludge
October 11, 2016 2:31 pm

SkepticGoneWild,
The comparison was apt for Sludge as he wrote:
The only thing that increase the transfer is bigger difference in temperature. Absorption of thermal energy is heat transfer, co2 is no exception. The claim is that increased absorption cause high temperaturen, this is the opposite of what physics tell us.
That is simply wrong as heat transfer by radiation may or may not be related to temperature. All depends of the existence or absence of an external source of energy. In the earth’s case the sun. That heats up te earth’s surface and that emits IR, depending of its temperature. When part of that IR is absorbed by CO2 in certain wavelenghts and if there are sufficient collusions with other moleculres (O2, N2), that part of the atmosphere heats up, regardless of its temperature of that moment. The same as what happens when steel is hit with the CO2 laser beam… Opposite, higher temperatures in the same layer may induce more energetic collissions with CO2 molecules, which increases the posiibility of exitation and sending out a photon. The balance then is a question of ratio between IR hits, sending IR out and collissions both ways… In general, GHGs heat the troposphere and cool the stratosphere.
If I stand in an ice cave, I do receive less IR from the walls than I emit myself, so I will cool down, but I will cool down less fast than when I am in a fully transparant (for all wavelengths) case in space, far away from the sun…

SkepticGoneWild
Reply to  sludge
October 11, 2016 9:47 pm

Michael,
What the hell? I did not draw any conclusions. I pointed out the lunacy of comparing heat transfer with a CO2 “powered” laser, and “non-powered” heat transfer in the atmosphere due to IR emitted from the earth’s surface.
If you actually read my post, I did not say photons had a temperature. And you accuse me of being daffy?

sludge
Reply to  sludge
October 12, 2016 5:52 pm

Ferdinand Engelbeen
October 11, 2016 at 11:31 am
“Please read something about CO2 lasers: their temperature may go up to some 100°C. Despite that low temperature the IR beam does melt steel at 1200°C. Simply because one has laoded a lot of energy into the CO2 molecules which send that energy outwards as IR light, no matter its own temperature.”
Ok, you should go back to making lasers again.
Do you seriously mean that a laser puts out more energy than goes in? Because that is what the claim is about co2. That the earth only gets 240W/m^2 and co2 is part of the reason that the surface suddenly has 390W/m^2. How do you do; 240W=390W with a gas that is cold as santas ass?
“The same for the earth’s surface: that is heated by sunlight and that heat gets out as IR radiation, of which CO2 picks a part and distributes that in part to the neighboring O2 and N2 molecules, thus heating them up…”
I know the theory. But there is a spectrum showing how co2 only absorbs. It is very clear, co2 absorbs and the intensity is drastically lowered in those wavelengths. A decrease in intensity does not cause heat anywhere.
“Still at height the air is colder than near ground, thus physics still hold: heat flows from warmer to colder objects and no energy is created or destroyed…”
Of course. Can you please give a reference to experimental studies showing how co2 increase the temperature of the surface heating the gas. Not a study that shows absorption, it has to show how temperature increase from the introduction of co2 in a system. Absorption is obvious, but I havent found a single study showing how co2 increase the temperature in a system by absorption.

Reply to  sludge
October 12, 2016 11:53 pm

Sludge:
It is very clear, co2 absorbs and the intensity is drastically lowered in those wavelengths. A decrease in intensity does not cause heat anywhere.
Sorry Sludge, the decrease in intensity is measured at the top of the atmosphere, that is where the outgoing energy is measured: less energy is leaving the earth in the wavelengths where CO2 is active. That means that the less energy going out is retained in the atmosphere where CO2 absorbed it and either distributed it to the other (non-GHG) molecules, thus heating up the atmosphere, or sent it out in all directions, including the surface, thus heating up the surface…
What is removed from the outgoing wavelengths must have been used somewhere to heat up something, or you are destroying energy…
Not a study that shows absorption, it has to show how temperature increase from the introduction of co2 in a system.
That was already proven by Tyndall in 1859… See;
https://en.wikipedia.org/wiki/John_Tyndall
and enlarge the picture. Heat waves were send through a gas mixture and if no IR is absorbed and re-emitted, nothing is sent back. If you add water vapor or CO2, some of the absorbed IR is sent back and heats a thermocouple which is what was read out.
The gas mixture itself also heats up, but as far as I remember, that wasn’t measured in that experiment.

Michael J. Dunn
Reply to  sludge
October 14, 2016 3:34 pm

SkepticGoneWild: My apology. It is difficult for me to scroll through these exchanges and tell who is on first base, and I mistakenly lumped you in with Sludge. But I think you are all laboring under a serious misconception that the CO2 in the atmosphere is “absorbing” the IR radiation and is heated thereby. What you have to realize is that the CO2 is emitting (or “un-absorbing”) as fast as it absorbs, and there is no net heating of the CO2. As I said above, this results in CO2 (and all other greenhouse gases) functioning as a beamsplitter, sending half the outbound radiation (in that spectral band) back to the surface of the Earth, to heat it up a little more than it would otherwise be. The atmosphere gets its temperature from the Earth’s surface, through conduction and convection. And, finally, it is perfectly fair to compare the physics of laser propagation with radiative heat transfer; it’s all the same thing. But not everyone understands how to apply the physics.
Sludge: I didn’t mention it before (hasty work), but the reason gases such as argon are used to fill insulating windows is because they are good thermal insulators. It has nothing to do with their properties regarding IR absorption.

David Bennett Laing
Reply to  Willis Eschenbach
October 11, 2016 6:48 pm

I beg to differ, Willis. I think I did exactly what I set out to do, which was to answer the question “Does variation in atmospheric CO2 content cause corresponding variation in ambient temperature?” I wasn’t looking at long term trends, at all, and it would have made no difference if I had used a different time interval. The reason I chose 1975 to 1998 was that a) global temperature shot up during that interval by nearly one degree C (i.e., there was a very good likelihood that some sort of effect among the variables would show up during this interval), b) the Keeling curve was available for this period, and c) this was the time interval during which anthropogenic CFCs were massively introduced into the atmosphere. So, I was looking at month-to-month variability, and the annual cycle of CO2 production and use in the Keeling curve was an excellent example of that. I reasoned that if variability in atmospheric CO2 concentration affected temperature, then these monthly variations, just like variations that had any other cause, would show up in the annual temperature curve. I used averaged monthly values over the time period because I could then tell whether or not the average monthly value of atmospheric CO2 followed or preceded the average monthly value of the temperature curve. If the former preceded the latter (or was coincident in the same month with it), then my interpretation would have been that “yes, variations in CO2 could well be the cause of variations in temperature.” If, on the other hand, the peak in monthly average CO2 followed the monthly average peak in temperature, as in fact, it did, and by two months (March to May), I would have concluded that “no, variability in monthly average CO2 concentration could not possibly have caused corresponding variations in average monthly temperature,” which I, in fact, did. Sure, the variation over the annual cycle was only 6 ppm, but the point is that ANY variation in CO2 should have shown up in the temperature curve. Long term trend had nothing at all to do with it. I was only looking at immediate effects.

Reply to  David Bennett Laing
October 11, 2016 9:47 pm

David Bennett Laing October 11, 2016 at 6:48 pm

I beg to differ, Willis. I think I did exactly what I set out to do, which was to answer the question “Does variation in atmospheric CO2 content cause corresponding variation in ambient temperature?” I wasn’t looking at long term trends, at all, and it would have made no difference if I had used a different time interval.

Thanks for the reply, David. However, it appears you misunderstand my point. You have shown that in the short term (less than a year) the temperature both leads in time and causes the variation in CO2 levels. As you point out, this is due to the growth and decay cycles of plants, and has nothing to do with atmospheric absorption of longwave radiation..
What you have emphatically NOT done is to demonstrate whether or not in the longer term “variation[s] in atmospheric CO2 content cause corresponding variation in ambient temperature”. Not only have you not demonstrated that, you have presented no evidence at all regarding the effect of the change in atmospheric absorptivity on temperatures.
Best regards,
w.

David Bennett Laing
Reply to  David Bennett Laing
October 12, 2016 4:30 am

No, Willis, I did NOT misunderstand your point, which is completely irrelevant to my analysis. I was NOT asking the question, “…whether or not IN THE LONGER TERM (my emphasis) ‘variation[s] in atmospheric CO2 content causes corresponding variation in ambient temperature’.” I was asking “Is ANY variation in atmospheric CO2 concentration reflected in temperature variations?” The annual respiration/decay cycle is one such variation, and I chose to use it as a convenient example. My analysis actually removed any long-term trends from the data sets I used, concentrating, instead, on the IMMEDIATE effects.My conclusion is that this particular sample I chose, from 1975 to 1998, when temperature shot up, indicating that “something was happening,” showed very little connection between this kind of variation in atmospheric CO2 and variations in warming. This is critically important information, which can then be applied to long term trends: “since it has been shown that CO2 has little effect on temperature (during the averaged annual cycle), i.e., that the two are essentially uncorrelated, then how can it be inferred that there is actually a LONG TERM trend between CO2 and temperature?”

Reply to  David Bennett Laing
October 12, 2016 9:39 am

David Bennett Laing October 12, 2016 at 4:30 am

No, Willis, I did NOT misunderstand your point, which is completely irrelevant to my analysis. I was NOT asking the question, “…whether or not IN THE LONGER TERM (my emphasis) ‘variation[s] in atmospheric CO2 content causes corresponding variation in ambient temperature’.” I was asking “Is ANY variation in atmospheric CO2 concentration reflected in temperature variations?” The annual respiration/decay cycle is one such variation, and I chose to use it as a convenient example.

Thanks, David. Let me try again.
You say “I was asking “Is ANY variation in atmospheric CO2 concentration reflected in temperature variations?” Perforce this must include the long-term effects as well as the short-term effects.
You also say “The annual respiration/decay cycle is one such variation, and I chose to use it as a convenient example.”
The problem is that you can’t simply extrapolate from one single convenient example of variation to “ANY variation” as you have done. You can’t generalize because often the short-term effect of something is quite different from the long-term effect. Let me give you an example that may clarify things.
The short-term effect of methamphetamine use is a feeling of strength and power and general well-being. Given that, can we conclude that long-time meth users will feel exceptionally strong and powerful and full of well-being?
To the contrary. Long-term meth use leads to fear, isolation, and paranoia. The long-term effects of meth use are very different, and operate on different principles, than the short-term effects.
And the same is true of CO2. The short-term effects are the increases and decreases in CO2 resulting from the annual temperature-related changes in growth and decay. But the long-term effects of CO2, whether large or small, are quite different. They result from changes in atmospheric absorption of upwelling longwave, an entirely different physical mechanism from that of the short-term variations.
So you cannot simply extrapolate from the short-term to the long-term. Your argument is the same as that of some first-time meth user insisting that “Meth can’t possibly be bad for me in the long run, because it makes me feel so good right now!”
I hope this clarifies my position,
w.

David Bennett Laing
Reply to  David Bennett Laing
October 12, 2016 2:33 pm

Willis, thank you for clarifying, I see where you’re headed, now. The problem with this is that, as I understand it, the relation originally devised by Svante Arrhenius in 1896 doesn’t differentiate between short- and long-term effects. It was simply a statement that a doubling of atmospheric CO2 concentration produces so many degrees of temperature rise. This is what Knut Angstrom tested in 1900, and he didn’t differentiate between short- and long-term effects, either; he simply tested the assumption as I rendered it above, and found very little effect. I’m doing the same with my graph, and simply addressing the question stated in my previous email: “does increasing CO2 have a warming effect (short- or long-term not differentiated) on air?” Again,as did Angstrom, I came out with very little effect.
Now, if there are, indeed, short- and long-term effects, you are alone in suggesting this differentiation, as far as I know, and it may be true, but it isn’t considered in my analysis, and further, I think that it needs to be established that there is, in fact, such a differentiation. If there is, then my analysis wouldn’t cover it, but if there is not, then my analysis should stand as the only hard data-based analysis of the question, as stated above, that exists since Angstrom, and it should be considered on that basis, i.e., without respect to the kind of differentiation that you imply. In short, I think that you, or someone, should make a data-based analysis designed to test the proposition that such a differentiation actually does exist.
Finally, I think that it is incumbent on you (or someone) to demonstrate that, for whatever reason, short-term effects are represented in my graph, but long-term effects would not be, and why this should be the case. Of course, you can do this on theoretical grounds, without experimentation or use of hard data, but I’m not sure that the above analogy with the effects of methamphetamine on the human body is sufficient.

David Bennett Laing
Reply to  David Bennett Laing
October 12, 2016 3:06 pm

Willis (second posted reply; the last one got lost for some unknown reason), I now see what you’re driving at. Neither Knut Angstrom nor Svante Arrhenius, as far as I know, differentiated between short-and long-term effects of CO2 on temperature, and therefore, my graph doesn’t take long-term effects into account, focusing instead on immediate ones.
If you think that there is, indeed, such a difference between short- and long-term effects, then I think this should be established by hard evidence before my graph and my conclusions can be faulted for not including both. Of course, your analogy with the effects of methamphetamine on the human body is interesting, but I suspect that some more pertinent proof of the differentiation would be in order!

David Bennett Laing
Reply to  David Bennett Laing
October 12, 2016 5:59 pm

Willis: In my first “lost post,” I was being thoughtlessly hasty, and I suggested that it was incumbent on you or someone to show why long-term effects weren’t represented in my graph. I can do that! Of course long-term effects aren’t represented, because I removed them. What I should have said appears in the second “lost post” (or in my third, if it ever shows up), and in the last sentence of my response to your first comment, “I was only looking at immediate effects.” Sorry for the confusion. My wife and I had just come home from leaf-peeping (glorious!), and I hadn’t yet had a chance to exchange my ball cap for my thinking cap!

David Bennett Laing
Reply to  Willis Eschenbach
October 12, 2016 4:01 pm

Willis, this is a THIRD attempt to reply to your latest post! I now see what you’re driving at. First, my graph doesn’t take long-term effects into account, focusing instead on immediate ones, as did, as far as I know, Svante Arrhenius, Knut Angstrom, and more recently, Suki Manabe. Second, again, as far as I know, you’re the first to suggest that there’s a difference between short- and long-term effects, and the validity of that really needs to be established with hard data before my analysis can be reasonably faulted for leaving it out.

Reply to  David Bennett Laing
October 13, 2016 1:30 am

David,
What you don’t take into account is the magnitude of the effect of CO2 on temperature.
Temperature has a large effect on CO2 levels: short term (seasonal, year by year) 4-5 ppmv/K up to 16 ppmv/K over glacial-interglacial periods. The changes in CO2 follow temperature changes with a variable lag, months to millennia, depending of the source/sink of CO2 (yearly leave growth and wane, deep ocean warming/cooling).
Based on absorption bands, a doubling of CO2 (280 to 560 ppmv) gives an increase of 1 K in temperature, before any positive or negative feedbacks. That makes that an amplitude of 6 ppmv over the seasons is good for a temperature change of maximum 0.02 K in 6 months. In fact less, as that is a transient response and a full response in ocean waters needs far more time.
Moreover, the maximum CO2 levels are at minimum temperature and the minimum CO2 is at maximum temperature. Your graph shows a seasonal amplitude of about 11°C in the NH. All what the 6 ppmv CO2 amplitude may have done is a reduction of the original amplitude from 11.02°C to 11.00°C. Nobody can measure that difference in the real world for a whole hemisphere, including a year by year variability of several degrees…
In contrast, the long term change in CO2 is far higher (+110 ppmv) or theoretically already a 0.5 K increase in temperature over a period of 165 years. Long enough and high enough to be measurable (if there weren’t lots of confounding factors)…

David Bennett Laing
Reply to  David Bennett Laing
October 13, 2016 4:24 am

Ferdinand Engelbeen: You seem to be arguing both sides, on the one hand talking about the temperature effects on CO2 (decreasing solubility in warmer water, presumably) and on the other, the effects of CO2 on temperature (the Arrhenius paradigm, apparently), but my graph considers only the question, “can variations in atmospheric CO2 content cause variations in temperature?” and the answer is no, it can’t because the regular May peak in variability due to organic activity occurs two months later than the maximum peak in temperature anomalies (March), but that ozone depletion could drive the latter because its maximum also occurs in March. It doesn’t consider magnitude of effects, which is what you seem to be talking about.

Reply to  David Bennett Laing
October 13, 2016 8:13 am

David,
I was only looking at the effect of 6 ppmv CO2 amplitude on temperature, which is -theoretically- 0.02 K, if you give it enough time to get in equilibrium. That is simply not measurable with the current equipment, not at all from ground stations and even not by satellites in the monthly noise,,,
Thus the fact that you don’t find any influence is no wonder, as it needs much more CO2 increase and much longer periods to be measurable…
On the other side, an increase in temperature early in the year will increase the decay of debris of the previous year(s) ánd increase the growth of vegetation, thus making the whole carbon cycle faster.
It would be nice to see the real figures for temperature and CO2 level anomalies i.s.o. percentages, so that the real influence of the increased temperature can be seen.

Reply to  David Bennett Laing
October 13, 2016 10:14 am

David,
In addition, human emissions are spread over a full year, somewhat higher in NH winter months than in summer months. If (winter) temperatures increase, the total increase in human CO2 shifts a little towards later months, thus increasing the CO2 anomaly to the right…

Duster
Reply to  Willis Eschenbach
October 12, 2016 8:16 pm

The bear peering through the buckwheat stalks is that there is no empirical evidence that atmospheric warming follows an atmospheric CO2 increase at any time scale. The lags increase in magnitude with increased time spans until looking at Antarctic and Greenland ice core data, there is an apparent lag of roughly 800 to 1,000 years. In fact the present increase in CO2, though presumably not the shifting stable-isotope mix, is a predictable out come of the Medieval Warm Period based on the empirical evidence from the ice cores. We have a serious conflict between apparently sound laboratory results and apparently sound empirical observations that have generated conflicting yet apparently sound laboratory data, and until that is explained, we will continue to hear this debate.

David Bennett Laing
Reply to  Duster
October 13, 2016 4:40 am

Duster: Right, but the problem is, and the reason why I constructed my graph, is that my colleague Peter Ward and I were unable to find, in a careful search of over 10,000 peer-reviewed articles relative to global warming, ANY experiment testing the Arrhenius relation that CO2 causes warming except for the well-known 1900 Angstrom experiments, in which little effect was found. In other words, the scientific community and the world at large have been taking the purely theoretical Arrhenius relation purely on faith, and that is a scientific no-no. I decided that the easiest and most straightforward way to test the theory was to take month-to-month variabilities in the hard data from the northern hemisphere from the period 1975 to 1998, when temperature shot up by almost 1 degree C, and see whether or not, due to their relative timing such variabilities in CO2 were capable of producing variations in temperature. Since the maximum in CO2 variability occurred two months after that in temperature, I therefore concluded that Angstrom was right in saying that there is little effect of CO2 variability on temperature.

AP
October 10, 2016 2:53 pm

This is rubbish. Obviously the seasons drive seasonal variation in both temperature and CO2. Obviously CO2 concentrations are lagging in Hawaii (partly because that is not where they are being produced and the gas isn’t mixed instantly across the globe). It is the underlying trend that needs to be investigated.
CFCs – what’s the proposed warming mechanism?
I would expect this level of analysis from warmists.

Mickey Reno
Reply to  AP
October 10, 2016 3:54 pm

The warming mechanism in this hypothesis is additional high energy UV-B penetrating through to the surface due to reduced ozone in the stratosphere. It assumes increased CFCs have caused reduced ozone high in the stratosphere, it assumes more UV-B is penetrating to the surface, and is assumes that increasing low troposphere temps are evidence this hypothesis. If the temp record is evidence, then it’s very poor evidence. I think this hypothesis deserves a real measurement of the alleged drop in ozone, the alleged increased UV-B and the alleged increased CFCs. Until we see those measurements, count me skeptical.

Hivemind
Reply to  Mickey Reno
October 11, 2016 4:07 am

It wasn’t in the article, but I was thinking the mechanism would be more O3 being formed lower in the atmosphere would create more nuclei for clouds to form around. And that would increase the temperature-moderating effect.

Greg
Reply to  Mickey Reno
October 11, 2016 4:59 am

Mickey, see the article linked under my TLS graph just above , that addresses most of your questions.
“alleged drop in ozone”:comment image

A C Osborn
Reply to  Mickey Reno
October 11, 2016 6:29 am

As attractive as this hypothesis may be to sceptics it fails miserably, because Ozone in the Atmosphere did NOT go back up with the banning of CFCs, in fact it has steadily been decreasing since 1957 with no obvious changes around the time of the ban or since.
Ozone levels are available just like CO2 levels, but no one ever talks about them as it proves what a waste of time banning cfcs was.
Plus of course they are lying about it having fixed the Ozone hole, which is much the same size as it ever was within it’s natural variations.

Greg
Reply to  AP
October 11, 2016 4:50 am

It is the underlying trend that needs to be investigated.

Phase can be informative, though it does require a deeper understanding that is displayed in the article.
The trouble with the Keeling curve is that it is basically a cumulative integral, this makes is rather flat and hides most of the information that it contains about nature and cause of the variation. We need to look at the rate of change to understand the changes causing that accumulation.comment image
Note the pesky ‘plateau’ in d/dt ( CO2 ) , seems that the decadal scale rate of change also settles around an average of 2ppmv / year along with temperature stagnation.
conversely temperature is not rising in accordance with it being driven by CO2 since the accumlation of CO2 has not stagnated.
This leaves open the question of how much of the 2ppmv / year background rate is the residual of human emissions ( which are about twice that value ) and how much is longer term out-gassing from deeper ocean water which is not in equilibrium with the CO2 concentration at the ocean / air surface?

Reply to  Greg
October 11, 2016 9:22 am

Soils deserve a lot more respect. They cover nearly 1/4 of the planet and represent a ONE WAY input to the atmosphere of 60 GtC/yr. Humans muster a one way atmospheric input of 10GtC/yr. Ocean/atmosphere CO2 flux is enormous, ~120 GtC/yr, but it goes BOTH WAYS, and the ocean appears to be currently a small net sink.

Reply to  Greg
October 11, 2016 11:42 am

Greg,
The phase distribution and opposite CO2 and δ13C changes do show that vegetation is the main cause of the year by year variability of CO2 uptake (see the graph above), but the biosphere as a whole (plants and all animal life) is a net sink (~1 GtC/year) for CO2 as the oxygen use shows, thus is not the cause of the CO2 increase in the atmosphere. See:
http://www.bowdoin.edu/~mbattle/papers_posters_and_talks/BenderGBC2005.pdf
The oceans do absorb the rest of the difference between human emissions and what remains in the atmosphere (as quantity, not the original molecules), that is some 3.5 GtC/year, thus neither are contributing much CO2 to the atmosphere, except a small part due to warming oceans (~16 ppmv/K).

AGW is not Science
Reply to  AP
October 11, 2016 6:39 am

Well he does mention that he’s a “progressive,” so…

Greg
Reply to  AGW is not Science
October 11, 2016 8:48 am

He also mentions that the most important thing to him is getting the science right, so less bigoted comments would be welcome. If more “progressives” were that objective we would not have a problem
A C Osborn

As attractive as this hypothesis may be to sceptics it fails miserably, because Ozone in the Atmosphere did NOT go back up with the banning of CFCs, in fact it has steadily been decreasing since 1957 with no obvious changes around the time of the ban or since.
Ozone levels are available just like CO2 levels, but no one ever talks about them as it proves what a waste of time banning cfcs was.

No, ozone has NOT been ‘falling steadily’ unless you are dumb enough to try to draw a straight line through it and that would be your failure, not anyone else’s.
It went down mainly in two hits caused by the two stratospheric eruptions. There has been some mild recovery since 1995 due to the slow process of natural replacement. This is the basis of disingenuous trumpet blowing by the UN calling Montreal the most successful international agreement ever and thus we must follow them now with Paris.
” no one ever talks about … ” , hardly.

Reply to  AGW is not Science
October 11, 2016 9:13 am

Ad hominem. There’s plenty more to look at here than that.

David Bennett Laing
Reply to  AGW is not Science
October 12, 2016 6:49 pm

Greg: The decline in total column ozone (TCO) in the lower stratosphere “in two hits,” as shown in your earlier post, above, is tentatively explained by my colleague, Peter Ward, on pp. 121-2 of his book “What Really Causes Global Warming?” He notes, as you do, that the “hits” were coincident with the massive eruptions of the stratovolcanoes El Chichon in 1982 and Pinatubo in 1991, but he also notes that both eruptions occurred within the period when CFCs were liberally sprayed into the atmosphere as propellants for hair spray, paint, etc. (1970-1998). He therefore attributes the general decline in total column ozone to two factors, 1) the emission of chlorine and bromine (as HCl and HBr) by the volcanoes, causing the “hits” and the steps, and the release of anthropogenic CFCs, causing a general downward trend in TCO, which was stopped during the ’90s by the Montreal Protocol (see the third graph in my post). This behavior of El Chichon and Pinatubo contributed to his conclusion that all volcanoes deliver Cl and Br to the lower stratosphere, causing thinning of ozone and consequent cooling of the lower stratosphere and warming of the troposphere by solar UV-B, but that sulfuric aerosols produced by explosive volcanoes overwhelm the warming effect, so that the net effect is that explosive volcanoes cool Earth, but that non-explosive ones warm Earth. This relation appears to hold rather well throughout Phanerozoic time.

David Bennett Laing
Reply to  AP
October 11, 2016 7:14 pm

I resemble that remark (that it’s rubbish). I was using the natural variation in atmospheric CO2 concentration caused by the photosynthetic activity and decay of plants in the northern hemisphere as an example of seasonal variability in the dataset against which to compare similar seasonal variations in temperature anomalies over the interval 1975 to 1998. I made the reasonable assumption that if a CO2 peak occurred in a preceding, or the same month, as a peak in temperature variability, then there is a strong possibility that the CO2 variability could have caused the temperature variability, but if it should occur in some later month, it certainly could not have caused an effect in a month prior.
CFCs accumulate on polar stratospheric clouds through the winter. In the northern hemisphere, sunlight returns in March to photodissociate CFCs, releasing chlorine, which depletes ozone catalytically. A thinner ozone layer admits more solar UV-B to Earth’s surface, and UV-B is 48 times hotter than Earth’s own infrared radiation, so it is therefore quite capable of causing warming.
It seems to me that most warmists accept the judgment of a large consensus of pedigreed climate scientists. As we all know, consensus is a tool of politicians, and it has no place in good science. In the Earth system, something either is or it isn’t, consensus be damned.

karabar
October 10, 2016 2:55 pm

Unfortunately, you would have a hard time explaining how this nonsense about the hole in the ozone layer, which is over the South Pole, results in a steady average temperature in New Zealand of 12.6 degrees C for the last 150 years.

RoHa
Reply to  karabar
October 10, 2016 6:29 pm

New Zealand is the the South Pole, isn’t it? Certainly seems to be from a Brisbane perspective.

Brett Keane
Reply to  RoHa
October 11, 2016 12:50 am

@RoHa
October 10, 2016 at 6:29 pm: Always good to have the Oz perspective. Praise be for the Tasman Sea.

willhaas
October 10, 2016 3:01 pm

You seem to be ignoring the biggest players in all of this, the sun and the oceans. If CO2 really did affect climate one would expect that the increase in CO2 over the past 30 years would have caused an increase in the dry lapse rate in the troposphere but that has not happened.

Roger Clague
Reply to  willhaas
October 11, 2016 7:05 am

Why would one expect that the increase in CO2 over the past 30 years would have caused an increase in the dry lapse rate?

Reply to  Roger Clague
October 11, 2016 8:40 am

Hi Roger, I think willhaas is following the line of thinking (not that I’m suggesting he believes it) set out by Manabe and Strickler, that a non-radiating atmosphere would be isothermal. If follows from that, that GHG concentrations affect the lapse rate, the old ‘warm the lower, cool the upper’ and hence modify the lapse according to total long wave opacity, even though there is no evidence to support this.

David Bennett Laing
Reply to  willhaas
October 12, 2016 6:55 pm

Correct. In this analysis, I was only concerned with the question of whether or not variations in atmospheric CO2 concentration could cause corresponding variations in temperature, and I concluded that they could not because their average monthly maxima occurred two months after the maxima in monthly temperature variation over the period of the study (1975 to 1998).

October 10, 2016 3:02 pm

Interesting post
Your link between declining ozone in the NH and CFC’s, and then bringing into the argument the Ozone hole above Antarctica is presumptuous. The so called ozone hole was recorded and blame attributed to CFC’s more to do with commerce than science. There is no historical record of comparison or trend.
The loss of ozone above Antarctica is closely related to the AMO cycle. No more no less.

David Bennett Laing
Reply to  ozonebust
October 12, 2016 6:59 pm

ozonebust: My analysis was concerned solely with the northern hemisphere, where the bulk of humanity is located, and therefore did not involve the southern hemisphere or the ozone hole over Antarctica.

Jimmy
October 10, 2016 3:09 pm

“I took the NOAA record of northern hemisphere temperature anomalies…”
Is this really the best option? The anomalies have already had the monthly average subtracted out of them, and therefore any seasonal component has already been removed. I presume the average that was subtracted out was for the period 1950-1980, or something similar. This would explain why you are left with anything that resembles an annual cycle.
If I missed something, please someone point it out.

Jon
Reply to  Jimmy
October 11, 2016 4:14 am

Also why is it hottest in March and coldest in October? In the Northern Hemisphere?
I always thought it was hottest in Summer and coldest in Winter [whichever hemisphere].

Dinsdale
October 10, 2016 3:13 pm

A perfect example of nonsense from correlation used as causation.

AGW is not Science
Reply to  Dinsdale
October 11, 2016 6:41 am

Just like AGW.

Reply to  Dinsdale
October 11, 2016 9:25 am

Still, correlations are fun.

Dmh
October 10, 2016 3:23 pm

Great article!
It’s the first one that I read that puts very clearly and reasonable cause for the anomalous increase in N. Pacific temperatures in 2014 and, later, created the coupling of heat pools to the surface to form the powerful El Nino of 2015.
This (big ENSO and temporary depletion of icecaps in both poles) happened despite the not so strong solar radiations of the present cycle, IMO, for two reasons:
/1/ the first peak of the cycle in 2011-12 had similar intensity as the second but it was relatively short lived, while the 2nd peak in 2014 and 2015 not only lasted longer but also had a very strong short range component, in particular in 2015,
http://sol.spacenvironment.net/~spacewx/data/e107_trend_plot.jpg
(where E10.7 is the integrated extreme ultraviolet flux from 1-105 nm),
from
http://www.spacewx.com/solar_cycle_trends.html
and
http://www.spacewx.com/e107_current.html
The relatively intense 2nd peak, I believe, importantly affected the Pacific temperatures and the Arctic ice – now we know, due depleted O3 in this period.
In this case, 2016 was just a natural consequence of the two previous years, if we only could “read” the facts properly then.
/2/ The eruption of Bardarbunga was in my mind also as one possible component of the overheat of the Pacific in 2014-15, but I didn’t have the data and analysis of the figure.1 of this article relating CO2 (I’m skeptical #1 about this gas), O3 (this is a gas that I had an intuition it could be behind the great oscillations of Earth’s climate, but had not connected the right dots) – and the seasonal variation of NH temperatures, which is the logical line connecting the various events of recent climate as following O3 but not CO2, as this article explains.
Again, great article, thanks to David Bennett Laing for taking the time to write it and share with us, and Anthony Watts for bringing it to our attention.
If I had to add anything to the analysis would only be with respect to the specific nuances of the present solar cycle, with a relatively strong 2014-15 2nd peak.

Hivemind
Reply to  Dmh
October 11, 2016 4:10 am

This is the first serious attempt that I have seen to explain the ‘pause’. Even if it is wrong, it has created a good discussion and I would like to see more such attempts.

Reply to  Hivemind
October 11, 2016 9:31 am

I agree. This is Science, even if, perhaps especially* if, proven wrong.
* given the lock-step credulity of present day “climatologists.”

David Bennett Laing
Reply to  Dmh
October 14, 2016 3:10 am

Thanks! Things do make sense when you look at all the data. Very glad to have your corroboration on this.

ECB
October 10, 2016 3:23 pm

There is a problem with this hypothesis. The rate of warming from 1910 to 1940 was the same as 1975 to 1998.
There were no refrigerators then.
So???

TA
Reply to  ECB
October 10, 2016 5:44 pm

“There is a problem with this hypothesis. The rate of warming from 1910 to 1940 was the same as 1975 to 1998.”
That’s my question, too.
CFC’s or CO2, it’s the same argument. Not a factor in the 1910-1940 era, yet the same amount of warming as 1975 to 1998.

Reply to  ECB
October 10, 2016 5:59 pm

Well, this is a nit, because I don’t disagree with your point, but the Frigidaire refrigerator was introduced in 1923, and R-12 refrigerant about a decade later.
http://bigchill.com/wp-content/uploads/2016/06/icebox-763×1024.png

Crispin in Waterloo
Reply to  ECB
October 10, 2016 6:52 pm

Good point. Any explanation of a warming for two or three decades has to work for both the warnings of the 20th Century.
Both Ozone and CO2 work in both directions. If the ozone was decreased the energy in and out would both be affected.
The ozone hole over the Antarctic causes a lot of cooling. It is strongly affected by GCRs. I don’t see that presented in the article. While the hypothesis is interesting, it seems to be contradicted by the rather well-proven hypothesis of Prof Lu in Waterloo on ozone formation and destruction. The oceans play a major part in it because it is a major source of bromine.

Reply to  ECB
October 10, 2016 8:11 pm

Refrigerators became popular and common in the US, and a few other western countries, well before 1920 (perhaps in the 1880s?). CFC s were developed through a major industrial effort, I think around 1920, because the refrigerants then in use were very toxic. People, entire families, were killed in their homes from leaks and large numbers were becoming afraid to have refrigerators in their homes.
CFCs turned out to be totally non-toxic to every life form and completely non-reactive (within the troposphere, anyway): they react with nothing, a perfect environmental solution.
According to the story accepted even through today, the south pole ozone hole is seasonal. It only occurs – within the south polar vortex – in the early spring. Ozone levels quickly return to ‘normal’ once late spring temperatures rise and the polar vortex breaks down.
In site of all the publicity about extra UV and potential damaging results, I have never seen any mention of measurements of UV levels at the surface, which I look for in every article I come across talking about the ‘problem and/or its solution. If life is more dangerous because UV level became higher, other than over the pole, it should be simple to put a number on how much more UV reaches the ground relative to some other time (UV levels could be measured long before the southern ‘hole’ was discovered), but none of that crowd ever goes near such a question.

Jon
Reply to  ECB
October 11, 2016 4:15 am

Were volcanos oozing + and – then too?

David Bennett Laing
Reply to  ECB
October 14, 2016 3:16 am

There was a series of non-explosive basaltic eruptions in the Pacific Rim during this interval, which is thought to have instigated, among other things, the Dust Bowl event in the western US. The warming during this interval ties in very nicely with the above analysis, including the persistence of relatively high temperatures due to the persistence of monatomic chlorine in the lower stratosphere. See the last illustration in the article.

Frank
October 10, 2016 3:26 pm

David asks: “Do variations in CO2 actually cause significant global warming?”
If one really wants an answer to this question, it doesn’t make sense to study the planet earth to find an answer! Global temperature (anomalies) change 0.1 degC or more within a month. This is called unforced internal variability. ENSO caused unforced changes of this size or larger over many months in a row. The AMO appears to produce an oscillation of amplitude 0.2 degC over 60 years. The LIA, MWP, Roman periods don’t have obvious explanations either.
The place to learn about CO2 and radiation is in the laboratory, where WELL-CONTROLLED experiments have been performed long before the hysteria about AGW began. Those experiments (plus observations of our atmosphere) show that doubling CO2 should reduce radiative cooling to space by about 4 W/m2 (or 1.5%). If nothing else changed, our planet would need to warm about 1 degC to emit an additional 4 W/m2 to space. Of course, other things do happen. Given the extremely slow rate of change in CO2, the difficulties in measuring GMST, forced variability, and the other things (forcing) that might be occurring (the existence of “ozone-depleting gases doesn’t tell us how much ozone has changed), amateur efforts to assess the effect of CO2 on temperature are hopeless. Read Lewis and Curry (2014) and Otto et al (2013) for the best analysis of how much warming forcing likely produces. The former says 1-4 degC/doubling of CO2 or about 0.25-1 degC/W/m2 of forcing.
At a minimum, read these papers and explain why your approach is superior.

ECB
Reply to  Frank
October 10, 2016 4:19 pm

A lab experiment says little about the real atmosphere. For example, if the daily formation of clouds of all types advances by 3 minutes due to the CO2 trapped heat, and lasts 3 minutes more into the evening, who would notice? The maximum high temperature could remain the same. The profile would change, that’s all. We do not measure the daily profile, so we cannot average of the daily profiles. How about the nightly profiles? Nope.
My opinion is that the amount of warming will be no more than 1/2 of the lab amount. The natural system will simply adjust slightly. I doubt that we will ever separate the ‘natural’ from the ‘human caused’ temperature changes. The models have already been established as useless towards that end.

KevinK
Reply to  ECB
October 10, 2016 5:46 pm

“For example, if the daily formation of clouds of all types advances by 3 minutes due to the CO2 trapped heat, and lasts 3 minutes more into the evening, who would notice?”
The CO2 does not “trap” heat. Nor does it “trap” radiation. Trapping heat is impossible (well known from the laws of thermodynamics). Trapping radiation (non-ionizing radiation like visible light, IR, microwaves, Terahertz waves, etc.) is possible. It simply requires a Faraday Cage (if you own a microwave oven you own a Faraday Cage). For a Faraday Cage to function is must have NO openings (dimensional or spectral) larger than 1/2 wavelength of the radiation. Any holes will allow the energy to eventually escape (to space in the case of the Earth).
The “Radiative Greenhouse Effect” merely forms a very very leaky Faraday Cage which simply delays by tens or hundreds of milliseconds the flow of energy through the Sun/Atmosphere/Earth Surface/Atmosphere/Energy Free void of Space. The energy alternates between visible (and some UV) light arriving at the surface then IR light leaving the surface and IR light returning again and again and perhaps again to the surface. All happening at the speed of light over distances of a few tens of miles.
As seen in all unbiased observations there is simply no correlation (or causation) between CO2 concentrations forcing (causing) higher average temperatures at a future time.
So, this analysis has moved the time frame forward from centuries and decades to a yearly analysis. The next step is to follow photons through the system on a nanosecond time scale. Once this is done it will be quite clear that “Greenhouse Gases” have no effect on the average temperature at the surface of the Earth.
Cheers, KevinK.

ECB
Reply to  ECB
October 10, 2016 6:45 pm

Thanks Kevin.
I like the term ‘trapped heat’ myself. The slight increase in back radiation most likely excites some water vapor molecules. Thus the heat gets captured.
So how does it escape? Same as before, through convection mostly, but just a bit earlier in the day etc. No thermodynamic laws being violated here.

Crispin in Waterloo
Reply to  ECB
October 10, 2016 7:03 pm

Kevin K
“For a Faraday Cage to function is must have NO openings (dimensional or spectral) larger than 1/2 wavelength of the radiation.”
You have the right idea. The holes have to be less than 1/4 of a wavelength.

Reply to  ECB
October 11, 2016 2:54 am

“As seen in all unbiased observations there is simply no correlation (or causation) between CO2 concentrations forcing (causing) higher average temperatures at a future time.”
Spot on.

Frank
Reply to  ECB
October 11, 2016 10:44 am

KevinK wrote: “For example, if the daily formation of clouds of all types advances by 3 minutes due to the CO2 trapped heat, and lasts 3 minutes more into the evening, who would notice?”
Why will CO2 cause changes these changes in clouds?
I never said CO2 “traps” heat. I said the radiative flux to space will be reduced. You can use any laboratory IR spectrophotometer to demonstrate how CO2 reduces the amount of radiation that passes through it.
A Faraday cage is made from an electrical conductor. The atmosphere is not a electrical conductor. Water vapor and carbon dioxide in the atmosphere to do absorb infrared radiation.
Numerous records prove that CO2 is not the only factor that changes our climate. Laboratory experiments suggest that the changes in CO2 over the last half century should produce a modest change in temperature that is difficult to detect against the background of other changes that we have seen in the past (ENSO, LIA and MWP, for example). AR1 (1990) said that the expected warming from rising GHGs was comparable changes in temperature the planet had routinely experienced in the Holocene. After another 0.25 K of warming, AR4 said that at least 50% of observed warming was very likely due to rising GHGs.
Simple calculations show that a 1 W/m2 radiative imbalance (1/4 of a doubling) warms the atmosphere and mixed layer of the ocean (50 m) at an initial rate of 0.2 K/year. At the current rate of increase, 1/4 of a doubling takes 25 years. In the meantime, that rate slows down as the planet warms (Planck feedback) and as heat is transported below the mixed layer.
Seasonal, yearly and even decadal changes in temperature can not tell us anything useful about how much warming will occur after CO2 has doubled.
Suppose you careful tracked local temperature and the angle of the sun every day in July using the shadow of a very tall object. In most Julys, you would conclude that there is no relationship between the height of the sun above the horizon and local temperature. Nevertheless, you could prove from the daily change in radiation that the angle between the sun and the horizon should be important to temperature. If you continued your measurements into August, you might begin to see the relationship between seasonal changes in temperature and seasonal changes in local temperature. The nature of that relationship would still be obscure because maximum temperature lags solar insolation by about 1 month in the center of continents and more near and over the ocean (due to their heat capacities). The current situation with GHG-mediated climate change is currently analogous being in the middle of August with such measurements. The theory that the sun’s angle makes a difference to local temperature seems sound, the direction of the trend in temperature is become clear, but you don’t have a good idea of how cold it will be in winter. Only an idiot would claim that data from July proves winter doesn’t exist

Paul of Alexandria
Reply to  Frank
October 10, 2016 6:59 pm

The lab experiments don’t capture all of the various feedback loops involved.

Brett Keane
Reply to  Paul of Alexandria
October 11, 2016 1:07 am

@ECB
October 10, 2016 at 6:45 pm: But the hypothesised WV is not there. Nor the Hot Spot. Study Maxwell’s ‘Theory of Heat and referenced work. However, the daily water cycle you use is our thermostat. As an aside, I remember how our Supermarine Schneider Cup winners found evaporative cooling to the air to be the best system for efficiency overall. In the 1920s-30s.

Jon
Reply to  Frank
October 11, 2016 4:27 am

Lab experiments hmmm.
Just 2 hrs ago I saw a program where they were experimenting on coral they had harvested from the Great Barrier Reef to see what added heat would do.
They intended to up the water temp in the coral-tanks by about 4 degrees.
Of course, seeing the tanks, it occurred to me, where is the current/ the waves/the new symbionts (symbionts provide 90% of the energy coral uses)?
And how do you deal with the effects of being harvested?
How reliable are lab experiments if they don’t include every variable?
Another similar example of bad experiment involves vitamin C and cancer last century. One researcher found it reduced the spread of cancer and another ‘replicated’ his experiment and found otherwise, so the use of vitamin C was rejected by the medical profession.
Of course the ‘replication’ gave the subjects the vitamin C orally for convenience whereas the original treatment gave it intra-venously.
You wonder what kind of medical ‘scientist’ would regard the digestive process as having no effect on nutrients.
Lab experiments hmmm.

Frank
Reply to  Frank
October 11, 2016 9:45 am

ECB wrote: “A lab experiment says little about the real atmosphere.”
Frank replies: Seasonal changes in CO2 and recent decadal changes in ozone-destroying substances don’t tell us anything useful about CO2 and warming!
The laboratory experiment tells us how CO2 and ozone interacts with radiation. Radiation is the only way for heat from the sun to escape to space. Therefore CO2 plays an important role in warming the planet. Guaranteed. There is still plenty of room to argue about climate sensitivity – how much warming one might expect from doubling CO2. Laboratory experiments can’t tell us that.
The laboratory experiments tell us that seasonal changes in CO2 won’t produce enough change in radiative cooling to space to cause a detectable change in temperature. The seasonal change in CO2 is only 6 ppm, about 1/50th of a doubling (1.015^50 is about 2). If we expect 1-4 K of warming per doubling of CO2, we expect seasonal changes in CO2 to produce warming of 0.02-0.08 K, an amount which is much too small to reliably detect on a planet with huge local seasonal changes (10 K) in many locations – in addition to larger unforced variation in temperature (by chaotic processes like El Nino).
And we only expect to see that 0.02-0.08 K of warming at equilibrium, not immediately after the change in CO2. It is trivial to calculate that a 1 W/m2 radiative IMBALANCE warms the atmosphere and mixed layer of the ocean at an initial rate of 0.2 K/year. So the annual 6 ppm increase in CO2 will warm the planet at a rate of about 0.0013 K per month (with some enhancement from feedbacks).
4 ppm of each 6 ppm seasonal increase in CO2 goes away each summer in the NH, leaving a permanent 2 ppm increase that accumulates year after year. So while a transient 6 ppm change in CO2 can cause an undetectable change in temperature after six months, a 2 ppm/yr increase can build up over many decades – and slowly warm over many decades – to produce a change in temperature. Looking at historical data, Lewis and Curry estimate that a 1% annual increase in CO2 for 70 years (a doubling) will produce 1.3 K of warming. (The current increase is only 0.5%/yr.) None of the information in this post contradicts that conclusion.
Let me repeat. The best place to learn about CO2 and radiation – the only way HEAT enters and leaves the planet – is in the laboratory. Once one understands that process, one has a chance of properly interpreting phenomena one encounter in the real atmosphere. Without this background, cause and effect are impossible to correctly analyze amid the numerous processes that produce forced and unforced (chaos) changes in planetary temperature.

David Bennett Laing
Reply to  Frank
October 14, 2016 5:49 pm

Frank (Oct 11): Laboratory experiments are simply substitutes for hard data from the Earth system. They are always simplifications of reality. The problem is that they are usually conceived on the basis of theory, such as the Arrhenius theory that a geometric increase in atmospheric CO2 produces an arithmetic increase in warming. If a laboratory experiment were devised to test this, it would be designed on the basis of this theory. With raw data from the Earth system, you can simply ask the question “Do variations in atmospheric CO2 actually cause variations in temperature?” and see what the CO2 and temperature data say about the matter. I did that and found that they cannot because in the real world, variations in atmospheric CO2 content follow peaks in temperature variability by two months, end of story.
Now, let’s ask another question: “Does greenhouse warming actually warm Earth?” The answer is no, because no object can warm itself with its own radiation. If it could, such an object would spontaneously warm up and quickly vaporize. Greenhouse warming is supposed to work because half of Earth’s infrared radiation that is absorbed by CO2 is radiated back to Earth, where it is supposedly absorbed, causing warming. The fact is that only radiation that is hotter than Earth can be absorbed (by the second law of thermodynamics), and Earth cannot emit radiation that is hotter than itself (by the first law). If greenhouse warming did work, it could only slow the rate of heat loss from the planet, just as a blanket can only slow the rate of heat loss from the human body. Because the human body has its own, metabolic heat source, such a blanket can only result in preventing heat loss up to 98.6 degrees F and no further. Therefore, if greenhouse warming did work, it could only heat Earth up to the temperature to which solar radiation heats the surface and no further. Model predictions of “runaway heating by CO2!” are therefore absolute nonsense.
The conclusion that greenhouse warming doesn’t work is therefore fully consistent with my graphic analysis.

Reply to  Frank
October 17, 2016 10:19 am

Bravo David Bennett Laing:
You have just summed up the thermodynamic arguments of many of the “Slayers” on why the Arrhenius radiative greenhouse effect “doesn’t work,” and which is indeed consistent with your graphical analysis.

David Bennett Laing
Reply to  Frank
October 17, 2016 2:07 pm

hockeyschtick: Tx!

Reply to  Frank
October 18, 2016 2:50 pm

Related new post today demonstrates a large gravito-thermal greenhouse effect in Earth’s atmosphere
http://hockeyschtick.blogspot.com/2016/10/new-paper-demonstrates-large-gravito.html

David Bennett Laing
Reply to  Frank
October 14, 2016 3:27 am

Sure, because it completely sidesteps the assumptions of virtually untested theory (such as Arrhenius’s assumption, disproven by Angstrom in 1900 by his WELL-CONTROLLED laboratory experiments, that CO2 causes warming, used by Lewis and Curry and Otto) and looks at only the raw data from the Earth system, which show that CO2 couldn’t cause significant warming, but that another driver, effective chlorine, could. We should reserve theory for a synthesis of what Earth’s data show us, not the other way around.

David Bennett Laing
Reply to  Frank
October 14, 2016 3:30 am

The foregoing comment is a reply to Frank, Oct 10, 3:26 PM.

RalphB
October 10, 2016 3:28 pm

Since Mr. Laing’s personal page shows he is the same earnest and idealistic progressive who tweets at https://twitter.com/DavidBLaing , he must be either a remarkably brave human being or perhaps even rarer, a free spirit with little interest in opinions, emotions, or possible defamation and abuse coming from persons he does not really know personally. Seafaring will do that for you.
I’m pretty sure he understands that no matter how scientifically open and accepting he may be of criticism from the climate science establishment, he is now and will be forevermore a Climate Change Denier, a traitor to the earth and generations unborn, a tool of big oil, and a persona non grata to the entire progressive movement including 90% of the media and professoriate. Why? Because earnest and honest or not, he has reached the wrong conclusion.
On the other hand, looking at his Twitter postings — not updated in a year — Mr. Laing appears to identify quite warmly with his fellows in the progressive movement, with only a minor faux pas in linking to a video on the ozone depletion warming theory — but of course that’s just a link. This essay may produce a radical change in the emotional climate of those associated with his progressive activism: an irreversible cooling.

October 10, 2016 3:31 pm

The temperature anomalies are most pronounced with the rise in November through to March, primarily as the result of atmospheric transport into the high NH latitudes and Arctic region. There are papers describing this effect.
If the mid to high NH CO2 site annual curves are looked at with an enquiring mind, it will be noted that the profile stops rising and has a near flat table top from late Novemeber through to March, at a time where human outputs are highest. These sites are not recording an accumulation, they are recording a continuous transport into the Arctic vortex. It is this transport that takes temperature, also affecting sea ice area. There is also a flow southward into the Equatorial area.

October 10, 2016 3:36 pm

A problem. The warming from about 1920 to about 1945 is essentially indistinguishable to that from about 1975-2000. The former cannot have been caused by rising CO2 comcentration (even IPCC AR4 SPM figure 4 said so). And it cannot have been caused by CFCs since those had not been invented yet. So there is provably a large natural component this analysis does not account for. Which cannot be assumed to have miraculously disappeared in the later period.
A second problem. The actual spectral energy contribution of UV-B is small. Yes, the wavelengths have higher energy than visible light and can cause sunburn. But there is much less of it than visible light energy. Look at any spectral intensity graph.

Reply to  ristvan
October 10, 2016 8:13 pm

Refrigerators became popular and common in the US, and a few other western countries, well before 1920 (perhaps in the 1880s?). CFC s were developed through a major industrial effort, I think around 1920, because the refrigerants then in use were very toxic. People, entire families, were killed in their homes from leaks and large numbers were becoming afraid to have refrigerators in their homes.
CFCs turned out to be totally non-toxic to every life form and completely non-reactive (within the troposphere, anyway): they react with nothing, a perfect environmental solution.
According to the story accepted even through today, the south pole ozone hole is seasonal. It only occurs – within the south polar vortex – in the early spring. Ozone levels quickly return to ‘normal’ once late spring temperatures rise and the polar vortex breaks down.
In site of all the publicity about extra UV and potential damaging results, I have never seen any mention of measurements of UV levels at the surface, which I look for in every article I come across talking about the ‘problem and/or its solution. If life is more dangerous because UV level became higher, other than over the pole, it should be simple to put a number on how much more UV reaches the ground relative to some other time (UV levels could be measured long before the southern ‘hole’ was discovered), but none of that crowd ever goes near such a question.

Steve T
Reply to  ristvan
October 11, 2016 3:27 am

ristvan
October 10, 2016 at 3:36 pm
A problem. The warming from about 1920 to about 1945 is essentially indistinguishable to that from about 1975-2000. The former cannot have been caused by rising CO2 concentration (even IPCC AR4 SPM figure 4 said so). And it cannot have been caused by CFCs since those had not been invented yet. So there is provably a large natural component this analysis does not account for. Which cannot be assumed to have miraculously disappeared in the later period.

Genuine question – how much chlorine gas was released during WW1, how long could this have remained in the atmosphere and could this account for any of this? Are there any other substances released from large scale artillery usage?
SteveT

Reply to  Steve T
October 11, 2016 10:34 am

During WWI, it was not unheard of for a million rounds of artillery ammunition to be expended in a day or two, during a particular offensive. I’m fairly sure this was “smokeless” powder, which had fewer particulates when exploded. Probably released a lot of nitrate gases, plus CO2 and H2O, maybe some CO. At 10# explosives average per shell, and figuring 3:1 dry weight to gas formation, that would be ~15,000 short tons of gases given off per million rounds. Plus particulates–fine shrapnel, unburnt filler, dirt from craters, bits of Tommy or Fritz, and various amounts of lead, arsenic, mercury, and zinc. The French “Red Zone” of WWI contaminated soil is still about 50 sq. miles, last I heard. Don’t drink the water, there. Or eat the plants or wildlife. Or kick any metal objects sticking up out of the soil.

Greg
Reply to  ristvan
October 11, 2016 5:12 am

One key difference is that UV penetrates deep into the ocean and does not just heat the two micron layer which will likely evaporate instantaneously. Absorption happens one photon at a time and heats one molecule at a time. Any excited molecule is going to have a higher probability of escaping the surface. Much of the energy from absorbed IR will be transfered almost instantly to the neighbouring air and be wisked away by wind and contribute to an increase in atmospheric convection: the same energy finds a different route to the tropopause where it will cause a corresponding increase in cloud.
A few people have raised the question of whether it is even possible to heat well ventilated water with infra-rouge radiation.
AFAIK, this have never been properly addressed or tested experimentally.

Reply to  ristvan
October 11, 2016 12:12 pm

ristvan,
No matter the quantities of chlorine (and NOx in a mix with chlorine), that didn’t reach the ozone layer as it is readily washed out by rain. But indeed there are several natural components that do reach the ozone layer and are responsible for the natural decay of ozone between the equator – where most is formed – and the poles.
Methylchloride, although largely destroyed before it reaches the ozone layer is produced in such huge quantities by wood rotting fungi that a part effectively comes high enough to be the main natural destructor of ozone…
The main boom in CFC use was in WWII when lots of experiments were done in the deserts and airco was necessary to keep people at work…

Reply to  Ferdinand Engelbeen
October 11, 2016 9:41 pm

comment image
Ferdinand, when you say most ozone is formed near the equator and decays towards the poles, I presume you are speaking of stratospheric ozone. Yet surface ozone seems also strongly concentrated at the equator, at least according to Modtran. Modtran even has a special input variable for it. Assuming that tropical concentration of stratospheric ozone production means strong attenuation of UV before it reaches the surface, why doesn’t fungal methyl chloride, which seemingly should also be concentrated in the tropics; eat this up?

Reply to  Ferdinand Engelbeen
October 12, 2016 3:52 am

gymnosperm,
Methylchloride itself, as far as know, doesn’t destroy ozone (but ground based ozone may help destroy methylchloride by attacking the hydrogen in it…), chlorine needs to be split off first and that happens more and more at higher elevations. In general the split of of chlorine is minimal in the troposphere, and most organic chemicals are destroyed before they reach the stratosphere, but methylchloride is produced in such huge quantities that part of it still reaches the stratosphere… See:
https://www.ncbi.nlm.nih.gov/pubmed/12738255

David Bennett Laing
Reply to  ristvan
October 15, 2016 3:11 am

ristvan (Oct 10): Not a problem. You are, of course, correct that the warming wasn’t caused by CFCs. There was unusual basaltic (non-explosive) volcanic activity on the Pacific Rim during that time, which delivered effective chlorine (see my third graph for definition) to the atmosphere. One of its effects was the dust bowl in the western US, and another was global warming during that interval, according to this model.
Your second point is not a problem, either. solar UV-B is 48 times more intense than Earth’s IR absorbed by CO2, and hence of much greater effect. The actual amount of UV-B delivered is shown in a graphic by Sasha Madronich in a 1993 paper. See graph #5 in https://ozonedepletiontheory.info/primary-cause-of-warming.html.

October 10, 2016 3:43 pm

This appears to be straight from Peter ward site..http://ozonedepletiontheory.info/ozone-distribution.html
A better place to for impact ozone has Erl happ site. https://reality348.wordpress.com
Cheers.

Marlo Lewis
Reply to  Macha
October 11, 2016 8:18 am

Macha, yes, the basic argument seems to come straight out of Peter Ward’s voluminous writings on the subject (https://ozonedepletiontheory.info/publications-ozone-depletion.html). However, I don’t recall Laing’s Figure 2 analysis in Ward’s publications.

David Bennett Laing
Reply to  Marlo Lewis
October 15, 2016 4:06 pm

I edited and troubleshot the whole work (“what Really Causes Global Warming?”, I wrote the Foreword, and my graph appears on p. 150.

Roger
October 10, 2016 3:43 pm

Since the anomalies already take out about 6 degrees of seasonal variability (caused by greater land mass in northern hemisphere), wouldn’t they also be taking out any regular seasonal variability you are trying to pick up with your analysis?

Greg
Reply to  Roger
October 11, 2016 5:17 am

So filter out the annual cycle and you find much the same thing on inter-annual scales. See my graphs above.

David Bennett Laing
Reply to  Roger
October 15, 2016 4:19 pm

The greater land mass in the northern hemisphere does not cause the variations in CO2, ozone depletion, and warming. They are caused by the bioutilization of CO2, by introduction of monatomic chlorine to the stratosphere by CFCs and volcanoes, and probably by monatomic chlorine, respectively. I used the records of these variables from the northern hemisphere because the CO2 variability record coincides with the most complete ozone record, that for Arosa, Switzerland, and because the northern hemisphere record for temperature would be expected to respond to one of these variables, not the southern, in which the CO2 variability is six moths out of phase with the northern, and because most of the anthropogenic influence on climate is in the northern hemisphere, which has most of Earth’s landmasses.

robinedwards36
October 10, 2016 3:43 pm

Interesting indeed, but as pointed out above, correlation seems tacitly to be assumed to be causation. Nevertheless very interesting ideas. I shall have to try to find the original monthly atmospheric concentration data for the other gasses mentioned and run my own analyses – as I always attempt to do.

Greg
Reply to  robinedwards36
October 11, 2016 5:18 am
David Bennett Laing
Reply to  robinedwards36
October 15, 2016 4:20 pm

Good. I tried to make it clear that my analysis proved nothing except the impossibility of any significant effect from CO2 on temperature.

yam
October 10, 2016 3:55 pm

“When ozone is depleted, more UV-B can penetrate to Earth’s surface.”
More vitamin D. There’s that.

Reply to  yam
October 10, 2016 4:12 pm

yam
My skin specialist is a happy man, he has more business on hand and coming down the pipeline. I am trying to steer my grand children in that direction. I have not met a poor one. In New Zealand it is really noticable. Travellers from the NH come and get sunburnt, not realising the fierce nature of the sun.
Today the Nor westerlies / westerlies are prevalant and rattling the doors and windows. The flow of atmosphere from the NH to the south is very noticable in October and November.

yam
Reply to  ozonebust
October 10, 2016 4:52 pm

Fierce sunlight for thin atmospheric ozone?

Reply to  ozonebust
October 10, 2016 5:27 pm

Correct. I live on the East coast mid way up the South Island. The ocean flows up from the South, even in winter I personally wear a wetsuit. The wind comes off the ocean and is very cooling giving a false sense of temperature. When standing with no shirt on in summer, the cold wind can turn you blue on one side and the hot sun red on the other (burning). Slight exageration but you get the meaning.

Reply to  ozonebust
October 10, 2016 5:28 pm

Should be “even in summer” – winter I stay out of the ocean

yam
Reply to  ozonebust
October 10, 2016 6:21 pm


Thanks. Not an abstract issue to you, I guess.

Greg
Reply to  ozonebust
October 11, 2016 9:02 am

Yep, South Island is much nearer Antarctica than Europe. How “fierce” was the sun in 1930?
All the CFC / ozone bullshit now means that we are not allowed to work outside without a T-shirt according to frigging EU health and safely regs.
My skin is now no longer allowed to increase its natural protection , melanin, during the spring time ready for the summer. It has to stay winter white all year round.
Butt out !!

David Bennett Laing
Reply to  ozonebust
October 15, 2016 4:24 pm

My understanding is that UV-A is actually more damaging to the skin than UV-B, and UV-A penetrates glass. I also understand that daily MODERATE UV-B exposure (less than causes sunburn) is protective against actinic keratoses, largely because it stimulates the body to produce Vitamin D.

bw
October 10, 2016 4:06 pm

Adding some context to the experiment of Angstrom, with reference to the 1900 paper
http://members.casema.nl/errenwijlens/co2/angstrom1900/index.html
BTW, the 15 micron absorption curve on the page is a model, not a measured spectrum

David Bennett Laing
Reply to  bw
October 15, 2016 4:26 pm

Tx!

Chimp
October 10, 2016 4:13 pm

If a man-made cause for late 20th century warming, whatever there actually was, be sought in our emissions or lack thereof, then look no farther than pollution controls which reduced particulates in the air, especially of the NH from the 1970s, followed by the liberation of Eastern Europe from Soviet anti-environmentalism. That is until the Chinese and Indian economies took off and started to reproduce the dark, Satanic, coal-fired Dickensian mills of the 19th century.

David Bennett Laing
Reply to  Chimp
October 15, 2016 4:29 pm

Chimp: Why don’t you do a study on the effect of this on temperature, similar to mine? Your results would be interesting, to say the least.

Lucius von Steinkaninchen
October 10, 2016 4:16 pm

Interesting hypothesis perhaps worth of more investigation, though as others have said there has to be some large natural component in the warming over the first half of the 20th century.
It would be interesting to track the eruptions of Pinatubo-like explosive stratovolcanoes and “Cowabunga”-like non explosive volcanoes over the period…

David Bennett Laing
Reply to  Lucius von Steinkaninchen
October 15, 2016 4:31 pm

Lucius: As I commented above, several natural, non-explosive, chlorine- and bromine-releasing eruptions occurred early in the century.

Germinio
October 10, 2016 4:40 pm

This article seems to be flawed in several ways. Firstly no-one seriously thinks that the Earth’s
temperature responds instantaneously to CO2 concentrations. Secondly the graph in Fig. 2 makes
no sense either. The vertical scale and the graphs go from 0 to 100% and neither value makes sense.
What does a mean monthly anomaly of 0% or 100% mean? Finally the graph in Fig. 2 is perhaps
designed to obscure any correlation between CO2 levels and temperature. Looking at Fig. 1 the
global concentration of CO2 changes from 320ppm to 380ppm and it would make more sense to
compare the large scale changes over decades rather than the much smaller differences that occur
over months.

Crispin in Waterloo
Reply to  Germinio
October 10, 2016 7:22 pm

Hang on:
“Firstly no-one seriously thinks that the Earth’s temperature responds instantaneously to CO2 concentrations.”
Oh yes they do: it happens in two stages: the immediate, near instantaneous increase from the GHG function followed by a slow feedback proposed to happen because of a water vapour response. If the effect of a 6ppm change in CO2 concentration is supposed to be ‘detectable’ then the annual change should produce a detectable effect.
As Willis has pointed out any additional heating experienced within a few hour period will force convection vertically to increase. This promotes cooling. That is to say, it enhances the cooling that is already taking place 24/7.
The time of year chart is fascinating. Whatever it is reflecting, it sure as heck isn’t CO2 heating more and less. I can think of several reasons why CO2 lags in spring. One is tthatspring growth is much more rapid than warming of the soil so the CO2 is absorbed more than the soil produces it. For those who doubt that soil is a major source of CO2, there is an instrument available from LiCor that is designed to measure it.
Has anyone seen soil listed as a major source of CO2? Where are termite emissions listed? Under ‘animals’ or ‘soil’?

Reply to  Crispin in Waterloo
October 10, 2016 8:56 pm

Actually co2 follows temperature. Instead of graphing the the total increase in co2 , try graphing the ppm per year against the temperature increase per year. Co2 follows temperature. The way the current graph relating temperature to co2 shows only one thing, there has been a slight warming trend, does not correlate to amounts of co2. There is nothing that should prevent co2 ppm per year from dropping in spite of every increasing production of co2 except temperature. In a comparison analysis, the temperature should be shown culumitive as is the co2. No matter how much co2 was produced, when temperature didn’t increase as much so to did the amount of co2 ppm per year that ended up in the atmosphere.
I should also note that from March 2015, NOAA has since adjusted the temperature anomolies per year and the co2 anomolies per year, not much, but enough so that if they do it a few more times, the correlation of co2 following temperature will be lost. Read this carefully, this isn’t a random yearly variation, it is consistent over 50 + years. F (x) = y, where x is the rise in temperature for the year and y is co2 ppm for the year.
I have, and so should a lot of other people, a lot of questions about the nature of the co2 presently in the atmosphere. I am sure that a certain percentage of the co2 is anthropogenic in orgin. What I’m not sure about is whether anthropogenic is a net contributor. What I’m not sure about is the alleged carbon balance scenario. What I’m not sure about is the interplay between cosmic rays, solar cycles, temperature and co2. What I’m not sure about is how big or small over time (last 150 years) were natural releases of co2. What I’m not sure about is the interplay between sinks, UHUV, cosmic rays and how big the sinks can become. Over time the sinks have become so large, either from a decline in the natural production of co2 or some other unknown, that as of now the sinks are eating into anthropogenic co2 produced yearly, provided anthropogenic co2 is the cause and there is a carbon cycle balance. Currently the sinks are 150% bigger than all the co2 produced in 1965. Further, I don’t know if co2 records have been altered to fit AGW. The MWP and LIA were both world wide and temperature swings big enough that it should have made an impact. It looks like wishful thinking on the part of AGW that it would go away.
Whether it happens or not, I would be very interested to see whether the atmosphere has a carrying capacity for co2, with the wishful thinking in mind. It’s easy to see that it does during a warming trend over the few decades. I’d like to see a general cooling trend over a few decades whether total co2 declines, despite anthropogenic co2 being added, based on the yearly association between the two, I would have to say it does, again in spite of a lot of unknowns. There may be an upper limit to the amount of co2 that can exist in the atmosphere based on sunlight. Co2 can be converted directly into carbon and O2 by at least 5% of volume.
Fiddling with the numbers doesn’t help.

Jon
Reply to  Crispin in Waterloo
October 11, 2016 4:35 am

Should we eradicate termites to save the planet?
Now Jerry Brown has made it illegal for cows to fart in California (above a certain level) perhaps he could ban termites too.
And the Pope could excommunicate them as well, as in the story of him doing the same to rattus rattus during the Black Plague.

Greg
Reply to  Crispin in Waterloo
October 11, 2016 5:24 am

What, cows now have to sit down to fart or you mean they are not allowed to fart on hills?
In fact most “cow fart” comments are totally ignorant, most of the methane develops in one of the cows four stomachs and leaves through the mouth. Since the heads are always down when grazing , all bovine emissions are low level emissions 😉

Reply to  Crispin in Waterloo
October 11, 2016 12:58 pm

rishrac,
There are two main causes for the CO2 increase in the past 160 years: temperature and human releases.
– Global seasonal temperature changes are good for 5 ppmv/K, dominated by NH vegetation: CO2 down with temperature, δ13C up.
– Year by year temperature changes are good for 4-5 ppmv/K, dominated by tropical vegetation: opposite to seasonal changes: CO2 up with temperature, δ13C down.
– (Very) long term changes (MWP-LIA, glacial-interglacial): up to 16 ppmv/K, dominated by the oceans: CO2 and δ13C (slightly) up with temperature.
The latter is what temperature maximally does: Henry’s law, confirmed by over three million ocean water samples, shows not more than 16 ppmv/K temperature change in (dynamic) equilibrium between ocean waters and atmosphere… That means that maximum 13 ppmv from the 110 ppmv increase since the LIA is from warming oceans, the rest from the human contribution, which is, until now, about twice the observed increase in the atmosphere…
That the sinks did became larger is a simple reaction on the increased CO2 pressure in the atmosphere: between 1960 and 2012 the partial CO2 pressure above the temperature related steady state between oceans and atmosphere increased a fourfold and so did the sinks: a fourfold increase in uptake… That is near independent of the momentary CO2 emissions, but as the latter also increased a fourfold in the same time span, both cumulative trends show a 99.93% match:
http://www.ferdinand-engelbeen.be/klimaat/klim_img/acc_co2_1960_cur.jpg
The global experiment with (slightly) cooling temperatures and increasing CO2 emissions was done in the period 1960-1975: CO2 simply increases in ratio with the emissions:
http://www.ferdinand-engelbeen.be/klimaat/klim_img/temp_emiss_increase.jpg
See further all evidence for a human cause of the increase:
http://www.ferdinand-engelbeen.be/klimaat/co2_origin.html

Reply to  Crispin in Waterloo
October 11, 2016 4:09 pm

Ferdinand.
https://rishrac.files.wordpress.com/2016/07/scan0001.pdf… I realize some people are extremely visual and can’t understand words. I hope that graph comes out for you. There are no if, and s, or but s, co2 follows temperature.

Reply to  Crispin in Waterloo
October 12, 2016 3:29 am

rishrac,
Indeed I am quite visual, but I have read your words very carefully too. I am from the old school of engineers, from before everything on earth was explained by frequencies…
The problem is that in this case you have a huge, increasing source of CO2: human emissions, practically without variability and another source of CO2, temperature, with a lot of year by year variability but hardly a trend. Combine these two and you have a huge trend with some variability.
If you take the derivatives, you largely remove the trend (which is near linear in the derivatives as the trend is slightly quadratic) and blow the variability up and voilà, you have proven that CO2 changes follow temperature changes. True, but all you have shown is that the variability around the trend is caused by the variability in temperature. That says next to nothing about the cause of the trend itself…
Just try the following: add two variables together, a slight quadratic upgoing function and a derived sinusoid (90 degr. shifted to the “cause”, temperature) without a trend and take the derivatives: there is a 100% correlation between the original temperature and the derivative: two identical sinusoids and zero correlation with the first variable, while the first variable is the only cause of the trend:
http://www.ferdinand-engelbeen.be/klimaat/klim_img/co2_T_dT_em_sim.jpg
The real trend shows very little variability: some +/- 1.5 ppmv for the extreme years (Pinatubo, El Niño) around a trend of over 70 ppmv since 1959. Here for the period 1985-2000:
http://www.ferdinand-engelbeen.be/klimaat/klim_img/wft_trends_rss_1985-2000.jpg
The MWP-LIA temperature transition is visible in the high resolution (~20 years) Law Dome DSS ice core:
http://www.ferdinand-engelbeen.be/klimaat/klim_img/law_dome_1000yr.jpg
The drop was good for some 6 ppmv CO2 for a drop of ~0.8 K in temperature or ~8 ppmv/K on that time scale (per Henry’s law: 16 ppmv/K at steady state). If we may assume that the MWP was at least as warm as today, the increase in temperature since the LIA thus is good for 6 ppmv CO2 of the 110 ppmv increase in the past 160 years. The rest is from the twice as large human emissions in the same period…

David Bennett Laing
Reply to  Crispin in Waterloo
October 15, 2016 4:36 pm

Crispin in Waterloo: Need I point out that this is reasoning all theoretical, and that my analysis is on actual data? In other words, can you use real data from the Earth system to quantify any of this, as I have done?

David Bennett Laing
Reply to  Crispin in Waterloo
October 15, 2016 6:10 pm

rishrac and Ferdinand Engelbeen: All this theoretical mathematical manipulation is all very well, but it all needs to be “brought down to Earth” (as it were) by hard data, as I have done in my graphic, which shows that variations in CO2 can’t produce a significant warming effect in the real world. Without hard data to show directly how Earth actually works, such theoretical arguments are simply moot.

David Bennett Laing
Reply to  Germinio
October 15, 2016 4:32 pm

Germinio: I have explained all this in earlier replies.

Reply to  David Bennett Laing
October 18, 2016 10:19 am

David, I’m just looking at the last 60 years. Graphing the co2 ppm and temperature anomolies show that co2 follows temperature. No theory or hypothesis there. Clearly you can see that from 1998 to 1999. But that remains true during the entire 60 years that that I cared to graph. And that relationship existed in spite of constant every increasing amounts of anthropogenic co2. In looking at the yearly increase in co2, co2 follows temperature. The only thing I can conclude is that there has been a slight warming trend, and that co2 levels have increased due to that warming.
I will add that there is an additional features that influences the amount of co2 regardless of production, the important word here is AND…. Solar activity AND cosmic rays. Bottom line is that it totally rules out co2 leading temperature or causing warming.
The only thing different, from 1998 to 1999 is that 1998 was a warmer year and co2 ppm increased to nearly 3, and 1999 was a cooler year although with ppm increasing under 1. There is also a constant pattern of co2 reaching a peak, then declining during each and every solar cycle. 19962/63/64 shows a very good association between cosmic rays and the solar cycle, and the rest of the time forward. From 1998 the only year that exceeded ppm is this one, in spite of a constant yearly load increase since then of 10 billion metric tons/year .

David Bennett Laing
Reply to  David Bennett Laing
October 18, 2016 7:02 pm

rishrac: Thanks for this!

Jane Whitsett
October 10, 2016 4:46 pm

I appreciate this article and think the data is presented well. However, in the first graph please explain how the temperature anomaly as percent is derived. Thank you.

dikranmarsupial
Reply to  Jane Whitsett
October 11, 2016 4:21 am

This is indeed a good question. If it is the seasonal variation in the anomaly time series provided by NOAA then any seasonal response to seasonal variations in CO2 may already have been subtracted off when NOAA calculated the anomalies (in which case, it is hardly surprising that there doesn’t seem to be much of a connection).

Greg
Reply to  dikranmarsupial
October 11, 2016 5:28 am

Correct in principal but sub-annual variation is not where we need to look anyway:
See my comment and graphs above.
https://wattsupwiththat.com/2016/10/10/interesting-climate-sensitivity-analysis-do-variations-in-co2-actually-cause-global-significant-warming/comment-page-1/#comment-2316852

dikranmarsupial
Reply to  dikranmarsupial
October 11, 2016 7:30 am

It is where we need to look to determine the validity of the analysis presented at the start of the article.
The correlation shown in your graphs have been well known since at least the work of Bacastow in the mid 1970’s and changes in land based plant and soil respiration seems to be the main driver IIRC
“Climatic changes over land during El Nino events lead to decreased gross primary productivity and increased plant and soil respiration, and hence the terrestrial biosphere becomes a source of CO2 to the atmosphere. Conversely, during El Nino events, the ocean becomes a sink of CO2 because of reduction of equatorial Pacific outgassing as a result of decreased upwelling of carbon-rich deep water. During La Nina events the opposite occurs; the land becomes a sink and the ocean a source of CO2.”
from http://journals.ametsoc.org/doi/abs/10.1175/1520-0442%282001%29014%3C4113%3ATCCRTE%3E2.0.CO%3B2

Greg
Reply to  dikranmarsupial
October 11, 2016 9:08 am

Thanks Gavin.
It funny how the try to attribute CO2 changes to land temp changes which are caused by sea air temp changes which are caused by SST changes caused by localised changes in the central Pacific.
Occam’s razor would suggest going straight for SST and out-gassing.

dikranmarsupial
Reply to  dikranmarsupial
October 11, 2016 9:47 am

Greg, while Occam’s razor is often a good guide, sometimes the science is just more complicated than we would like. In this case it seems that the equatorial Pacific becomes more of a sink for CO2 than a source, even though the surface waters are warmer. From the Jones et al paper:
“When the correlation between interannual changes in CO2 and ENSO was first noticed it was thought that the reason lay in the ocean’s behavior, with a net outgassing of CO2 from the ocean during El Niño events, and a net uptake under La Niña conditions. Bacastow (1976) postulated that increased winds, especially in the Southern Ocean, during La Niña events could lead to higher gas exchange between the atmosphere and ocean and hence oceanic uptake. Bacastow et al. (1980) suggested that increased upwelling of nutrients in the equatorial Pacific during La Niña years could increase biological activity and hence increase uptake, and also that increased SSTs during El Niña years would serve to increase outgassing during these periods by reducing the solubility of CO2. However, Feely (1987) argued that the most important El Niño impact on the equatorial Pacific is by reduced upwelling of dissolved inorganic carbon (DIC), which lowers the partial pressure of CO2 dissolved in surface water (pCO2), and hence reduces the outgassing during El Niño years, leading to a net uptake of CO2 by the world’s oceans. Feely (1987) also suggest that under El Niño conditions reduced winds in the equatorial Pacific result in reduced outgassing.
While people often talk about Henry’s law when discussing the oceanic carbon cycle, it is a bit misleading because there is vastly more to it than that (I’m no expert, but I know enough to know I don’t know enough ;o).

Greg
Reply to  dikranmarsupial
October 11, 2016 10:07 am

Thanks for the link. It gives some idea how climate science works on such matters:

More recently it has become established that the ocean and terrestrial carbon cycles respond in opposite senses to ENSO forcing. Keeling et al. (1995) and Francey et al. (1995) both describe how El Niño events cause the oceans to become a net sink for CO2 due to decreased upwelling of DIC in the equatorial Pacific, and the terrestrial biosphere to become a net source, possibly due to increased respiration or increased incidence of natural fires and biomass burning.

So not having been able to produce anything more than the most hand-waving causal attribution: “possibly due to increased respiration or increased incidence of natural fires and biomass burning.” this apparently is now considered “established” science.
They say it gives a CC of 0.44 but does not work well in early 90s and start special pleading because of Mt. P. and El Chichón.
There are periods when the relationship does not hold, namely, 1982–84 and 1991–93. These periods coincide with times when the troposphere was cooled by the impact of volcanic eruptions (El Chichón, Mexico, in 1982 and Mount Pinatubo, the Phillipines, in 1991
By contrast the SST relationship holds during these periods.comment image
This topic certainly merits a closer look.

dikranmarsupial
Reply to  dikranmarsupial
October 11, 2016 10:27 am

greg wrote “So not having been able to produce anything more than the most hand-waving causal attribution: “possibly due to increased respiration or increased incidence of natural fires and biomass burning.” this apparently is now considered “established” science. ”
sorry, that is a deeply unfair characterisation of the science, the paper contains many references to the scientific studies underpinning that position. AFAICS nobody said it was “established science”, so that is also a bit of a straw man. I think I’ll leave the discussion there.

Reply to  dikranmarsupial
October 11, 2016 1:20 pm

Greg,
There as I wrote somewhere upthread, there is a simple method to distinguish between oceanic and vegetation CO2 releases: the δ13C changes. If CO2 is dominantly released by the oceans, δ13C will go up in parallel, as the 13C/12C ratio from CO2 in ocean waters is higher than in the atmosphere. If the release is from vegetation, δ13C will firmly drop as the 13C/12C ratio from organic matter is way lower than the ratio in the atmosphere.
The influence of temperature during El Niño / La Niña on CO2 is clearly dominated by vegetation as the opposite changes of CO2 and δ13C show. I repeat here the graph:
http://www.ferdinand-engelbeen.be/klimaat/klim_img/temp_dco2_d13C_mlo.jpg
During the Pinatubo eruption, again the response of vegetation is dominant: while there was a lot of scattering by volcanic dust, slightly reducing incoming sunlight, photosynthesis was enhanced as leaves normally part of the day in the shadow of other leaves received more scattered sunlight…

Reply to  dikranmarsupial
October 11, 2016 11:01 pm

gavinmarsupial cites:
“Climatic changes over land during El Nino events lead to decreased gross primary productivity and increased plant and soil respiration, and hence the terrestrial biosphere becomes a source of CO2 to the atmosphere. Conversely, during El Nino events, the ocean becomes a sink of CO2 because of reduction of equatorial Pacific outgassing as a result of decreased upwelling of carbon-rich deep water.”
The terrestrial biosphere is ALWAYS a net source to the atmosphere. Vegetation is a modest ~5GtC/yr net sink averaged across ENSO cycles, but soils are a one way 60GtC/year source. This is supported by the isotopes. Ocean outgassing/in gassing nets to about 1GtC per year at.+8 PDB. This is overwhelmed by the 60GtC/year at -21.

Reply to  dikranmarsupial
October 12, 2016 2:19 am

gymnosperm,
Soil bacteria are a large part of the game, the biological carbon cycle. The point is that the soil bacteria can’t emit CO2 that wasn’t first captured by plants out of the atmosphere, thus not more than what plants some time in the past disposed as carbohydrates or other organics into the soils…
That makes that the net contribution of all life forms (land and sea plants + bacteria + molds + insects + animals) is slightly more CO2 uptake than release in most years.
That is measured by looking at the oxygen balance: all photosynthese plants produce oxygen and (near) all other life forms use oxygen, while warming oceans only release or take in relative smaller amounts of oxygen wit temperature related solubility. The oxygen balance shows slighty less use of O2 than calculated from fossil fuel burning, thus the biosphere as a whole is a net producer of O2 and thus a net sink for CO2: some ~1 GtC/year more CO2 uptake than release, including soil respiration. As the uptake is preferentially 12CO2, the atmosphere relative enriched with 13CO2, thus the biosphere is not the cause of the 13/12C ratio decline. See:
http://www.bowdoin.edu/~mbattle/papers_posters_and_talks/BenderGBC2005.pdf
During El Niño years, the total biosphere is a net contributor, as tropical vegetation suffers from elevated temperatures and especially from drougth in large parts of the equatorial forests, emitting more CO2 from decaying debris than taking CO2 away. That gives a reduction in total sink capacity and the increase of CO2 in the atmosphere shows a peak.

David Bennett Laing
Reply to  Jane Whitsett
October 15, 2016 6:48 pm

Jane Whitsett, dikranmarsupial, Greg, and Ferdinand Engelbeen: First, to Jane, my transfer of actual data values to percent was simply a device to render the three curves comparable on the same scale. Since my objective was not to see “how much CO2 increase would produce how much warming?” but “whether ANY variations in CO2 could produce warming,” I constructed the graph without reference to actual values of CO2 concentration or temperature. I simply set the lowest average value for each month over the 24-year interval to zero percent and the highest value to 100 percent. I could as well have used the same graph with a separate scale for each variable, but that would have been unnecessarily cumbersome compared to just expressing the values of all three variables as percentages. This is a standard technique in statistical analysis.
As for the rest of you, all this speculation as to what actually causes warming is very interesting, but why don’t you find databases for these various possibilities and set up an analytical design similar to the one used here in order to see whether or not your ideas actually work in the real world rather than simply basing those ideas simply on purely theoretical considerations?

dikranmarsupial
Reply to  David Bennett Laing
October 18, 2016 9:42 am

““whether ANY variations in CO2 could produce warming,” your analysis cannot tell you anything about this, because (as I pointed out) the use of temperature anomalies means that any effect of the seasonal variation in CO2 on temperature has already been eliminated prior to the analysis. It is a shame that you replied, but evaded the key point I raised, which was that your analysis was fundamentally flawed.

David Bennett Laing
Reply to  David Bennett Laing
October 18, 2016 6:49 pm

dikranmarsupial: Thank you for pointing out that my analysis is fundamentally flawed, but I think you are wrong, based on your misunderstanding of what I am doing with my graph. Since this is a month-by-month analysis of variability, each month is shown as a deviation of temperature from the 20th century norm for that month. What it shows is that over the analysis period, 1975 to 1998, the maximum deviation from that 20th century norm occurred in the month of March. The maximum CO2 concentration for the same analysis period, however, occurred in the month of May, two months later, showing that a maximum in carbon dioxide concentration could not possibly cause a maximum deviation in temperature from the norm for the month of March. It also showed that a maximum of ozone depletion occurred in March, too, so it could be the driver of the maximum deviation of temperature.

dikranmarsupial
Reply to  David Bennett Laing
October 19, 2016 2:35 am

“Since this is a month-by-month analysis of variability, each month is shown as a deviation of temperature from the 20th century norm for that month. ”
yes and if seasonal variation of CO2 had an affect temperatures then you would find it in the 20th century norms for each month of the year because the seasonal cycle in CO2 hasn’t changed very much over the 20th century. The analysis is fundamentally flawed because you use anomalies where the effect of the seasonal cycle on CO2 has already been eliminated.

David Bennett Laing
Reply to  David Bennett Laing
October 19, 2016 4:23 am

dikranmarsupial: You say that I “use anomalies where the effect of the seasonal cycle on CO2 has already been eliminated.” How do you know this? That analysis has not been done. My graph shows a plot of the mean amount of deviation of temperature in the northern hemisphere from the 20th century norms for each month during my analysis period of 1975 to 1998, and the maximum amount of this deviation happens to occur in the month of March. The maximum concentration of CO2 in the northern hemisphere for any month, however, occurs in the month of May. Do you dispute any of this? There is a very minor upward deflection of temperature anomaly in June, which, since it follows May, could be due to CO2. This seems pretty clear-cut and unarguable unless you resort to arm-waving and theorizing in order to explain why things really aren’t the way the graph shows the situation to be.

Richard M
October 10, 2016 5:17 pm

The claim ozone reduction is responsible for global warming is not new.
https://uwaterloo.ca/news/news/global-warming-caused-cfcs-not-carbon-dioxide-study-says

Greg
Reply to  Richard M
October 11, 2016 10:11 am

I think it’s part of the story. As with most people they seem to need to think that there is just one cause: it’s AGW, it’s the sun, it’s ozone …..
The climate is a complex, non-linear system. Don’t expect to find the secret in one variable.

David Bennett Laing
Reply to  Richard M
October 15, 2016 7:05 pm

Richard M: Correct. Lu’s analysis invokes cosmic rays dissociating CFCs instead of solar UV-B breaking CFCs down on polar stratospheric clouds. The only problem with this is that, as my graph shows, the dominant effect on temperature comes in March, when solar UV-B becomes available again after the dark winter. Cosmic rays, by contrast, are not a seasonal thing, coming in year-round.

October 10, 2016 5:34 pm

Anthony Watts:
So far, you have refused to publish my essay “Climate Change Deciphered”, which PROVES that all of the .warming that has occurred 1870-present is due to the removal of anthropogenic Sulfur Dioxide aerosols from the atmosphere, either due to reduced industrial activity during a recession or a depression, or to Clean Air efforts.
It also permits temperatures projections accurate to .02 deg. C. or less, based solely upon the amount of reductions in SO2 aerosol emissions.
If you are unable to understand it, at least publish it with a note to the effect that you are not convinced, and let more astute minds attempt to scientifically tear it apart..

Greg
Reply to  Burl Henry
October 11, 2016 5:34 am

Anyone who thinks they have PROVEN anything in climate is probably mistaken. Railing because AW has “refused” to use his site to promote you person hypothesis is probably a good way to ensure that remains the case. You sound like you think you have a right to access the traffic he has built up here.
Open up your own wordpress account publish it yourself and post a link to it.
I get the feeling already that it’s not going to bowl me over but idea of late 20th c. warming being due to changes in atmospheric content is worth exploring. Go for ti.

Reply to  Greg
October 11, 2016 7:30 am

Greg:
Thank you for your World Press suggestion. I’ll attempt to do so.
And you are probably correct about AW. If my model is published and accepted, traffic on his site would probably dwindle to near zero.

David Bennett Laing
Reply to  Burl Henry
October 16, 2016 4:05 am

Burl Henry: At first, Peter Ward thought that SO2 was an important player in warming, due to its invariant association with warming in the GISP2 ice core, but soon found that the surge and plateauing in atmospheric SO2 preceded the 1975 to 1998 surge and plateauing in temperature by about twenty years, whereas effective chlorine preceded it by only about five years, which made the latter the more likely candidate. He therefore decided that SO2 was really just an indicator of the basaltic volcanism that produced chlorine and bromine that actually produced the warming. All this is covered in his book “What Really Causes Global Warming? Greenhouse Gases or Ozone Depletion?”

Reply to  David Bennett Laing
October 16, 2016 10:38 am

David:
I have not read Mr. Wards book.
My findings are that whenever net global SO2 emissions into the atmosphere are reduced, average J-D global land-ocean surface temperatures will rise, because of the cleaner air and increased insolation.
The climate sensitivity to their removal is .02 deg. C.of temperature rise for each net Megatonne of reduction in global SO2 emissions.

David Bennett Laing
Reply to  David Bennett Laing
October 17, 2016 1:32 pm

Burl Henry: Dr. Peter L. Ward, geophysicist and volcanologist with the USGS for 27 years.

Reply to  David Bennett Laing
October 17, 2016 6:49 pm

Nevertheless, the lag between the end of the increase in the buildup of anthropogenic SO2 emissions (1972=1975) and the beginning of global warming as they began to decrease (circa 1980) is also about 5 years.

David Bennett Laing
Reply to  David Bennett Laing
October 17, 2016 1:35 pm

Burl Henry: P.s., I have little doubt that what you are talking about has some effect on temperature.

Samuel C Cogar
October 10, 2016 6:41 pm

N OTE: this post is a critique of the author’s explanation of the Keeling Curve Graph.
So explainith did …… David Bennett Laing, ….. the cause of the bi-yearly cycling of atmospheric CO2 as depicted on the Keeling Curve Graph, …. to wit:

…….. which shows that, on the average, CO2 reaches a maximum concentration in the month of May in the northern hemisphere, when the CO2 from the winter’s decaying vegetation has warmed up and can enter the atmosphere, and a minimum in September-October, when photosynthesis during the summer has used up some of the CO2 in the atmosphere”.

David Bennett Laing, …… your above statement would be more believable iffen you could cite the actual, factual proof(s) and/or scientific evidence that is the basis of your above “atmospheric CO2 ingassing/outgassing claims”.
A url “link” to a published, peer approved, scholarly paper or abstract would suffice quite nicely.
I detest the mimicry of “junk science” agitprop that is a biological impossibility within the natural world ……. and thus has no basis in fact, ….. and therefore highly detrimental to the nurturing of factual scientific knowledge within the minds of the human populace.
And ps, a fact for you to contemplate: “Eighty-plus percent (80+%) of all Northern Hemisphere microbial decomposition of dead biomass (vegetation) normally occurs between the months of mid-March and mid-September because that is when there is sufficient moisture and warm temperatures that are prerequisite for optimum microbial decomposition to occur.”
Also, keep in mind that, …… Northern Hemisphere microbial decomposition of dead biomass (vegetation) and photosynthesis activity of the “green” growing biomass actually begins in the month of January in the Southern latitudes along the Gulf Coast (and California) and progresses northward to the Northern latitudes of the US, Alaska and Canada by the 1st of June.
Thus, from January to September, there is as much, if not more, outgassing of CO2 by the microbial decomposition of dead biomass ……. as there is ingassing of CO2 by the “green” growing biomass.

David Bennett Laing
Reply to  Samuel C Cogar
October 16, 2016 4:12 am

Samuel C Cogar: Again, in my analysis, I was only using the biogenic variation in atmospheric CO2 as a convenient example of variability in atmospheric CO2, and I was using it as faithfully represented in the Keeling curve to compare with temperature variation. You present a lot of theoretical arguments in your comment that are not really pertinent to this analysis.

October 10, 2016 6:43 pm

Very interesting analysis. Thank you. I also looked at the ozone data but found no evidence of significant changes in mean global tco (total column ozone) from ground station measurements or from satellite measurements. Localized variations happen in the mid and extreme latitudes and these can be explained in terms of how ozone is distributed from the tropics (the only place where they are formed) to the higher latitudes. These localized chages can have both seasonal and decadal cycles but because they are distributional phenomena they don’t change mean global ozone and they do not serve as evidence of the rowland-molina mechanism of ozone depletion.
http://papers.ssrn.com/sol3/papers.cfm?abstract_id=2843032

Reply to  chaamjamal
October 11, 2016 2:46 am

Lots of ozone changes….but his appears to be straight from Peter ward site..http://ozonedepletiontheory.info/ozone-distribution.html
A better place to for impact and variations in ozone has Erl happ site. https://reality348.wordpress.com
Or here. https://harrytodd.org
Basically once NOx dissappears, Ozone can exist.

Greg
Reply to  chaamjamal
October 11, 2016 5:44 am

Interesting to see some concrete work in this , Jamal.
I think the linear and cyclic models that you have chosen both miss the real cause of variation. It looks like you data is similar so I suggest you look at TLS for the clue as what is driving the changes.
I suggest you look at the article I linked above.
https://climategrog.wordpress.com/uah_tls_365d/comment image?w=842

David Bennett Laing
Reply to  chaamjamal
October 16, 2016 4:17 am

chaamjamal: Yes, the distribution of ozone in the lower stratosphere is very mercurial in space and time. That is why, in my analysis, I restricted my study to the northern hemisphere (where the best records were) and to the time period 1975 to 1998.

David L. Hagen
October 10, 2016 6:48 pm

David Bennett Laing
Compliments. I encourage you to add the INTEGRAL of Total Solar Insolation (TSI) to your graph and how that TSI leads temperature. e.g.,
See David Stockwell’s models of Temperature as lagging TSI by 90 degrees (Pi/2).
David RB Stockwell
Key Evidence for the Accumulative Model of High Solar Influence on Global Temperature 2011
Accumulation of Solar Irradiance Anomaly as a Mechanism for Global Temperature Dynamics
On the Dynamics of Global Temperature

David Bennett Laing
Reply to  David L. Hagen
October 16, 2016 1:04 pm

David L. Hagen: Will take a look!

commieBob
October 10, 2016 7:18 pm

In 1900, Knut Ångström concluded from a famous experiment that very little warming results from a doubling of atmospheric CO2.

The experiment is described here. The experiment showed that a column of CO2 in a tube saturated and that, after a certain point, adding more CO2 didn’t change anything as the IR energy was already completely absorbed.
The main criticism of the experiment seems to be that the atmosphere is not homogeneous but, rather, consists of layers. The other thing was that the experiment was not precise enough to warrant the conclusions drawn from it.

Samuel C Cogar
Reply to  commieBob
October 11, 2016 3:35 am

And here all these years I’se been thinking that the only entity in the universe that could completely absorb IR energy are those proverbial Black Holes that are situate at the center of galaxies.
Now the big question that I hafta ponder on is: “How did those experimenters manage to add more CO2 to that sealed tube without any of the absorbed IR energy conducting, convecting or radiating out of the tube and into the surrounding environment?

commieBob
Reply to  Samuel C Cogar
October 11, 2016 7:45 am

LOL
It’s true. No energy gets through … at a particular wavelength. The energy is re-radiated at longer (lower energy) wavelengths.
Here’s how it works: A photon at a certain energy bumps a molecule up to a higher quantum state. The energized molecule collides with another molecule. This results in the energized molecule leaving the energized state and the resulting energy is shared between the two molecules as kinetic energy. These two molecules will re-radiate their extra energy as photons at longer wavelengths. There is no requirement that the system has to accumulate energy. For a more complete explanation, here’s an article on absorption spectrometry.

David Bennett Laing
Reply to  Samuel C Cogar
October 16, 2016 1:06 pm

Samuel C Cogar: I think they used different tubes.

October 10, 2016 7:20 pm

If Cervantes and his Don Quixote were around these days, the Don would be tilting assiduously at Wind-Turbines.

Clyde Spencer
October 10, 2016 7:47 pm

Plants are not induced to leaf out and absorb CO2 by “temperature anomalies.” It is the actual air and ground temperatures that are important it the growing cycle! Anomalies reduce the information content of data and should be used sparingly, when they actually contribute something to understanding the processes.

David Bennett Laing
Reply to  Clyde Spencer
October 16, 2016 1:10 pm

Clyde Spencer: anomalies represent no loss of information in data as long as the mean value of the base period is known.

Trebla
October 10, 2016 8:15 pm

I think a stronger argument against the effect of CO2 on temperature can be found in Mike Jonas’ four essays entitled “The Mathematics of Carbon Dioxide” which appeared earlier on this site. In his essays, Mr. Jonas replicated the mathematics used in the general circulation models and used these formulae to attempt to hindcast temperature changes due to changes in CO2 levels. He found that the equations had no skill at all in doing so.
I have yet to see any refutation of Mtr. Jonas’ work.

David Bennett Laing
Reply to  Trebla
October 16, 2016 1:19 pm

Trebla: Remember that mathematics is a tool only. It can provide no information, only manipulation of information already known. In the case of the warming effect of CO2, no one had asked the question. Therefore, there was no information. It doesn’t matter how much mathematics you throw at a problem, or how complicated that mathematics might be, if no information is available except for someone’s assertion, or a general consensus, that something is true, it will not lead you to a greater understanding of anything but the unproven assumption you start with. You really need actual data.

October 10, 2016 10:28 pm

Artificial refrigeration began in the mid-1750s, and developed in the early 1800s. In 1834, the first working vapor-compression refrigeration system was built. The first CFCs were synthesized by Frédéric Swarts in the 1890s.
Commercial refrigerator and freezer units, which go by many other names, were in use for almost 40 years prior to the common home models. In 1913, refrigerators for home use were invented. They became popular and common in the US and a few other western countries.
The refrigerants then in use were very toxic. People, entire families, were killed in their homes from leaks. News spread and large numbers of people were becoming afraid to have refrigerators inside their homes. Through an intensive commercial effort, CFCs were proven very effective. The introduction of Freon in the 1920s expanded the refrigerator market and the early models were big sellers.
According to the story accepted even today, the south pole ozone hole is seasonal. It only exists within the south polar vortex. Ozone destruction begins in the early spring as UV levels rise enough to activate reactions. Ozone levels quickly return to ‘normal’ once temperatures rise in late spring and the polar vortex breaks down.
In site of all the publicity about increased UV and potentially damaging results, I have never seen any mention of measurements of UV levels at the surface, which I look for in every article I come across talking about the ‘problem’ and/or its solution.
If life is more dangerous because UV level became higher, other than over the pole in winter, it should be simple to put a number on how much more UV reaches the ground now relative to some previous time (UV levels could be measured long before the southern ‘hole’ was discovered), but none of the alarmists crowd ever goes near such a question.

John Hardy
October 10, 2016 10:30 pm

I agree with Alan Ranger “I tend to agree. Whilst a lack of correlation (CO2) certainly dismisses any claim of cause and effect, an apparent correlation (CFC/ozone) does not (on its own) lend any weight to a claim of another cause and effect.” A third factor might be causing both. It also adds some weight to the controversial idea that temp helps drive CO2 not vice versa

Alan Ranger
Reply to  John Hardy
October 13, 2016 6:06 am

I don’t find the idea of temperature “driving” CO2 to be at all “controversial”. It is very clear that this is what happens during the interglacial cycles, with the Milankovitch cycles being the third factor (underlying cause). What might be “controversial” is whether the (comparatively trivial) warming and cooling within the Holocene is sufficient for any noticeable affect on CO2 from outgassing of the oceans.

Amber
October 10, 2016 10:41 pm

Why wouldn’t the scientific community start off to see if they can model one month out accurately and work their way out instead of the highly inaccurate and overstated projections of years . Why waste $Trillions on the basis of incomplete manipulated data sets and failed projections ? Why would government policy makers demand on behalf of tax payers to see absolute proof before spending $Trillions of borrowed money ? Why aren’t policy makers demanding to see a full cost benefit of warming regardless of the influence of human caused CO2. If it was cooling would policy makers be demanding an increase in CO2 if it could demonstrated to have any significant effect ? Where is the proof it would have any effect ? What were the levels of CO2 in previous ice ages ?
Why hasn’t the scientific community signed off on a climate model that is agreeable using the scientific method ? Is it because natural variables are so dominant and poorly understood? Thus the only scientific conclusion that could be reached is the interaction of a very complicated climate system are at the very early stages of understanding and should not serve as the false basis for forecasting the earth’s temperature or climate changes .
Can the scientific community actually prove otherwise ? If so how have they calculated the dominant influence of natural climate variables and the effect of a trace gas CO2 which highly beneficial and necessary to life ?
Why isn’t the media demanding answers to these basic questions ?

rwoollaston
Reply to  Amber
October 11, 2016 1:36 am

As I understand it, and I’ll try to choose my words carefully, the UN has for many years been trying to identify tools it can use in the cause of global governance in order to improve global political stability. The IPCC and its work on climate change is one of these tools. In fact it is even stated that fossil fuel use reduction is a desirable thing whether or not the CO2 warming theory is correct.
A consequence of this is that governments can hide behind treaties like Paris, and, as there is no coherent political opposition (yet) to policies that restrict fossil fuel use, there is nothing much onto which the media can latch.
The danger of this situation is that the guilt of the developed world for its past sins in emitting CO2 is being exploited by major players in the developing world (eg China and India) in the huge differentials in CO2 emissions targets between the two. In short, it is being used to create a massive competitive advantage for the ‘developing’ world – never mind that China will probably soon be the world’s largest economy.

October 10, 2016 11:03 pm

Sorry, I don’t buy it for a number of reasons, some already pointed out by others upthread. But not addressed in those comments was if UV-B has enough power to accomplish the claimed temperature changes. It matters not in the least that UV-B is “48 times” hotter than the earth’s own infrared radiation. What matters is how much reaches earth surface, and how much changes in ozone affect that amount. There’s lotsa hooplah about ozone holes over the poles, but the fact of the matter is that not much sunlight shines straight down on the poles in the first place. So the real question is what is the change in UV-B over the majority of the earth.
Mine eyes being tired, I did a only a quick search for a paper using instrumental readings of UV-B and found this one covering the period from 1994 to 2006 in the continental US. Not the same as period of analysis in this article, but good enough for a first cut:
http://uvb.nrel.colostate.edu/UVB/publications/uvb_trends_hicke.pdf
Two important observations from this paper:
1. Of the 8 ground stations trended, all except one have an annualized surface radiation average of less that 0.3 w/m2. Note, that isn’t the varation, that’s the whole enchalada. Variation over the study period was a measly 2% to 5%. In other words, the raw power in UV-B might be enough to give you sunburn, but in terms of earth’s temperature, it is next to nothing and the variation in it is a fraction of that (at the high end, only 0.015 w/m2 over about a decade)
2. Even more telling are these words from the paper regarding correlation with Ozone:
Although many studies have focused on the role of ozone in affecting surface UVB radiation, our observed
irradiance increases were not always consistent with the reported increase in Northern Hemisphere total ozone during 1995– 2004

So, not enough power in UV-B to start with, and the correlation with ozone also not very strong (which doesn’t mean that ozone changes don’t affect UVB, just that other factors are likely larger players).

Reply to  davidmhoffer
October 10, 2016 11:23 pm

Lest we throw out the baby with the bath water, I should add that the analysis itself is interesting and has merit. There are, however, many other factors that have annual cycles and I think you have to look at all of them in detail to sort out causal factors from effects. My quibble above is in regard to the alternate hypothesis regarding ozone and uvb.

commieBob
Reply to  davidmhoffer
October 11, 2016 5:38 am

There are indeed many other factors. While checking out your numbers, I stumbled on a reference to the 2014 reassessment of top of atmosphere (TOA) insolation data.

… ACRIM established an increase of +0.037%/decade from 1980 to 2000 and a decrease thereafter. … The implications of increasing TSI during the global warming of the last two decades of the 20th century are that solar forcing may be a significantly larger factor in climate change than represented in the CMIP5 general circulation climate models.

So, between 1980 and 2000, the TOA insolation increased by about one watt per square meter. That’s going to change the estimates of climate sensitivity downward. It may be enough to kill the notion that there is any net positive feedback. It’s complicated.

Brett Keane
Reply to  davidmhoffer
October 11, 2016 1:39 am

davidmhoffer
October 10, 2016 at 11:03 pm: I’d expect UVB changes to join the rest in the 0-2000m water column, for lagged variations in ocean heat release. With some of the effect possibly deriving from MWP even, as postulated?

Greg
Reply to  davidmhoffer
October 11, 2016 5:50 am

“Northern Hemisphere total ozone during 1995– 2004”
Valid points in general but most of the drop in ozone happened between 1980 and 1994 and was due to two large volcanoes. See the graphs I’ve already shown in comments.

David Bennett Laing
Reply to  davidmhoffer
October 16, 2016 4:59 pm
John
October 10, 2016 11:46 pm

Correlation is not causation. You can pretty much take anything that influences climate, greenhouse gases, solar, oceans, aerosol emissions, orbital variations and even land use. With most of these, you can probably find correlation at some point in the past. I know people get very caught up in the “It’s the sun!” argument as well, but that can’t be matched to everything. How all these things interact and how or why a certain result comes is somewhat of a mystery still. CO2 also doesn’t even come close to explaining everything.
This article can be added to the list that suggests the science most certainly isn’t settled and that all areas should be accurately researched and funded.

Reply to  John
October 11, 2016 6:51 am

John:
You wrote “This article can be added to the list that suggests the science is most certainly not settled and that all areas should be accurately researched and funded”
Apart from myself, I have seen no one address the warming that occurs when sulfur dioxide aerosol emissions into the atmosphere are reduced, due to Clean Air efforts. This is a scientific fact which is being totally ignored. The reduction in SO2 aerosol emissions can precisely account for all of the warming that has occurred, 1870-present!.
Too many careers invested in the CO2 hoax, I guess.

Greg
Reply to  Burl Henry
October 11, 2016 10:18 am

https://climategrog.wordpress.com/uah_tls_365d/

After the particulate matter and aerosols have dropped out there is also a long-term depletion of stratospheric ozone ( 5 to 8% less after Pinatubo ) [1]. It is likely that the mechanisms that remove the volcanic ejecta also remove other natural and anthropogenic stratospheric pollution. The relative importance of these factors, which reduce the opacity of the stratosphere and allow more energy reach the lower atmosphere, has not been accurately determined.

Also look for the term ‘global brightening’ as the opposite of global dimming, you have not invented the idea.

Reply to  Greg
October 11, 2016 2:53 pm

Greg:
Thank you for the link, I was not aware of it.
Yes, I am aware that others have speculated on the effects of aerosols in the atmosphere, including the authors of the linked paper.
Here, the authors attribute the warming to the after effects of major stratospheric eruptions, and state “this significant warming effect is spuriously attributed to GHG and other human induced changes and goes a long way to explain the increasing divergence between models and observational data”.
They could not be more wrong. There is no surface warming effect from a volcanic eruption, other than that which occurs after the dimming SO2 aerosols have settled out of the atmosphere, and temperatures have recovered to pre-eruption levels because of the cleaner air.
What I have done is to uncover the data which proves that here can never have been any warming due to greenhouse gasses.. Just facts, not speculation.

Ian H
October 11, 2016 1:32 am

Seasonal variation in temperature is absolutely massive. Any annual CO2 effect on temperature is going to be completely lost in the roundoff error. That variations in CO2 and temperature are correlated on an annual basis tells us absolutely nothing beyond the fact that both are driven by the season. It gets warmer in summer and in summer vegetation grows and lowers CO2 levels. That is all that this data is capable of telling us.
In particular any correlation or phase difference between CO2 and temperature on an annual basis is completely unrelated to causation between the two. Unless I have completely missed the point, the article seems to be little more than an example of the dangers of confusing correlation and causation

October 11, 2016 1:44 am

There is a hole in this theory of ozone absorption causing annual changes in the global temperature. The GH gases plus aerosols cause the total absorption of 71 W/m2 of the incoming SW radiation in the clear sky conditions. This means that about 167 W/m2 is absorbed by the surface. The total incoming SW radiation is 238 W/m2, which is the same amount as radiated from the TOA into space as LW radiation.
Ozone absorbs about 13 W/m2 (20 % portion of the absorption) of the SW radiation but the net effect is zero on the Earth’s energy balance. The reason is that it does not matter at all, whether the SW radiation is absorbed by the atmosphere or by the surface. If the absorption in the atmosphere increases, it reduces the SW radiation at the surface exactly by the same amount. That is why the SW absorption is not considered in GH calculations.
There is one exception and it is clouds. Clouds reduces the incoming SW radiation but at the same time they increase the absorption of LW radiation in the atmosphere. The net effect is very slightly positive. But some scientists want to forget the effects of clouds on the SW radiation. So they come to the conclusion that the clouds have about 25 % effect in the GH phenomenon. In this way they can reduce the effect of water and to increase the effect of CO2. This is an example of the corrupted climate change science.
I have published papers, which concentrate to find out the real effects of GH gases in the global warming. I am one of those few researchers (like Miskolczi) who are skeptical about the AGW theory and who can use spectral analysis calculations for finding out the real warming impacts of GH gases. In fact spectral analysis is the only method to analyze these small effects.
You can find the main results of my research work in my web page: http://www.climatexam.com/
Start with the English slideshows and you find a lot of presentations about the global warming in the easily readable form.
Dr. Antero Ollila

Reply to  aveollila
October 11, 2016 2:53 am

So if ozone concentration changes can significabtly affect cloud cover, then it can be an influence.
Both these guys have something to add beyond the usual drivell.
https://harrytodd.org
https://reality348.wordpress.com
The latter link shows how…and why CO2 is irrelevant.

Samuel C Cogar
Reply to  aveollila
October 11, 2016 4:37 am

@ aveollila – October 11, 2016 at 1:44 am

….. and who can use spectral analysis calculations for finding out the real warming impacts of GH gases. In fact spectral analysis is the only method to analyze these small effects.

Dr. Antero Ollila, …. please tell me, ….. why haven’t you performed one (1) or more “simple constructed” physical experiments for determining the actual, factual warming impacts, in degrees F or C, of the most talked about GH gases which are H2O vapor and CO2?
Why waste your time screwing around with spectral analysis calculations ….. when all one can hope to achieve from doing said are highly questionable mathematically determined quantities, …… which are of no value whatsoever until they are proven via actual experimentation measurements.

Reply to  Samuel C Cogar
October 11, 2016 5:53 am

I understood that you think that it would be possible to carry out a physical experiment with the Earth’s climate to find out the impacts of H2O and CO2. As you should know, it is impossible. If you have another way to carry out this kind of a simple physical experiment, I would like to know it as well other concerned researchers. The climate is a complex system and I have not found any simple ways to simulate it. Computer based models called GCMs, try to do it with very poor results. For example the GH gas effects are based on the spectral calculations and they are simplified in order to be applicable in these models.
Actually these spectral calculations are simplified experiments, because they are carried out in the simplified atmosphere of the Earth. I have published many results about the warming effects of GH gases. What about this? The portions of GH gases in the GH phenomenon are: H2O 82 %, CO2 11 %, O3 5 % and CH4 & N2O 2 %. Compare these results to those of Kiehl & Trenberth who carried out these calculations in the US Standard atmosphere 76 by reducing the water content by 12 %: H2O 60 % and CO2 26 %. Do you know, why these results are wrongly calculated? Or do you buy these latter results simple therefore that you can find them in Wikipedia and they are the most referred numbers.
This is the whole problem in the nut shell. The majority of climate change researchers have never carried out spectral calculations and therefore they have to rely on something.

Reply to  Samuel C Cogar
October 11, 2016 5:55 am

One thing more. The absorption capabilities of GH gases are calculated on the theoretical basis and it is top science of molecular physics. The results are tested in the laboratory conditions and the water absorption even in the atmosphere. The accuracies are nowdays within 1 %.

Greg
Reply to  Samuel C Cogar
October 11, 2016 10:26 am

Agreed, the spectral properties of gases are probably one of the best known parts of the “basic physics” we are constantly hearing about. That is the transmission, absorption and emission properties.
We also know that LWIR gets attenutated very quickly in conductive sea water and will only penetrate a few microns into the surface. It seems that GCMs then assume that all that energy is absorbed by the ocean, which is a spurious leap of belief and the 1% accuracy of the rest becomes totally irrelevant.

Samuel C Cogar
Reply to  Samuel C Cogar
October 12, 2016 5:29 am

So sayith: aveollila – October 11, 2016 at 5:53 am

I understood that you think that it would be possible to carry out a physical experiment with the Earth’s climate to find out the impacts of H2O and CO2. As you should know, it is impossible.

If so, Dr. Antero Ollila, then your ability to understand various thingys is more FUBAR than I was originally thinking. And, of course, I certainly am sufficiently nurtured to know that it’s impossible to conduct physical experiments in/on an “open system” such as earth’s atmosphere. GEEEZUS, I’se learnt bout dat back in 56’ durin my hi school days.
Ollila, you should not assume you are conversing with an uneducated dumbarse.
Again sayith: aveollila

If you have another way to carry out this kind of a simple physical experiment, I would like to know it as well other concerned researchers. The climate is a complex system and I have not found any simple ways to simulate it.

“DUH”, even the Learning Disabled should know that the earth’s climate is not a physical entity than can be measured via a physical experiment, simple or otherwise.
And secondly, Antero, in that your conscious thinking is still somewhat FUBAR, me thinks it will be necessary to re-nurture your subconscious to clear-up your conscious “thinking” problems.
Antero, …… READ MY WRITIN, …… the subject of this discussion is ….. the design and implementation of a “simple physical experiment” to determine if the per se “greenhouse gases”, ….. and specifically CO2, …… are responsible for an increase in “warming” of the environment in which they reside or are contained, due to the absorption and radiation of IR [thermal (heat) energy]…… and if so, to measure the degree(s) F or C increase in said ”warming” per increase in ppm of aforesaid gas(es) that are resident in aforesaid environment.
Assuming you forgot already, the mission of said experiment is exactly what you stated up above, which was the …… “ finding out the real warming impacts of GH gases.
Again sayith: aveollila October 11, 2016 at 5:55 am

One thing more. The absorption capabilities of GH gases are calculated on the theoretical basis and it is top science of molecular physics. The results are tested in the laboratory conditions

Antero, …… are you wacko or what? You just told me in one of your above postings that one could not conduct physical experiments on atmospheric gases ….. and now you are telling me that “The results are tested in the laboratory conditions
Antero, …… GETTA CLUE, ……. iffen you or anyone else can conduct physical experiments on atmospheric or the per se “greenhouse” gases that are not “foot-loose-and-fancy-free” in earth’s atmosphere, ……. THEN SO CAN I, ……. and it is both stupid and asinine for you to claim that I can’t.
And when you get your synaptic links between your brain neurons “rewired” for the betterment of your abstract thought processes on CAGW, then I will define my “simple experiment” that will surely disprove the junk-science “warming” claims of CAGW or CAGWCC.
Cheers, the ole Computer Logical Designer, Systems Designing and Programming dinosaur of yesteryear,
Samuel C Cogar, …. AB Degrees, Biological and Physical Science, GSC 1963.

David Bennett Laing
Reply to  Samuel C Cogar
October 16, 2016 6:12 pm

Very good questions!

David Bennett Laing
Reply to  Samuel C Cogar
October 16, 2016 6:14 pm

The above is in response to avaollila Oct 11 @ 1:34

nobodysknowledge
Reply to  aveollila
October 11, 2016 4:59 am

“Ozone absorbs about 13 W/m2 (20 % portion of the absorption) of the SW radiation but the net effect is zero on the Earth’s energy balance. The reason is that it does not matter at all, whether the SW radiation is absorbed by the atmosphere or by the surface. If the absorption in the atmosphere increases, it reduces the SW radiation at the surface exactly by the same amount. That is why the SW absorption is not considered in GH calculations.”
I don`t understand this argument. Is warming of the stratosphere doing exactly the same job as warming of oceans? Where energy is stored doesn`t matter for the energy balance? Intuitively it is different mechanisms.

Greg
Reply to  aveollila
October 11, 2016 6:12 am

Ozone absorbs about 13 W/m2 (20 % portion of the absorption) of the SW radiation but the net effect is zero on the Earth’s energy balance. The reason is that it does not matter at all, whether the SW radiation is absorbed by the atmosphere or by the surface. If the absorption in the atmosphere increases, it reduces the SW radiation at the surface exactly by the same amount. That is why the SW absorption is not considered in GH calculations.

I don’t follow this line of argument. NASA suggest a 5-8% drop in ozone due to Mt Pinatubo.
http://earthobservatory.nasa.gov/Features/Volcano/
8% of 13W/m^2 is about 1W/m^2 , enough to make a difference. El Chichon has a similar impact of TLS therefore was presumably a similar impact on ozone. That’s 2W/m^2 and getting close to alleged GHG effects.
If this change is not recognised and accounted for it could be misattributed to GHE. The other difference is that this will penetrate the oceans directly not the skin layer and be lost to evaporation.
the GHE happens between the “effective” emitting layer in the stratosphere and the surface. Unless you know whether this SW energy enters or not you cannot correctly work on GHE which is supposed to change downward flux between these two levels.
So the additional downward flux could be either SW or hypothesised “back radiation” If it is the SW which is heating the oceans not the LWIR, you are going to misinterpret whatever data is available.

Reply to  Greg
October 11, 2016 8:40 am

Greg and knowbodysknowledge. If you look at any energy balance of the Earth, you fill find out that the incoming energy radiation flux is the sum of absorption in the atmosphere and the absorption of the surface. This flux must be the same as outgoing LW radiation. The balance means balance and not the change in the heat content of any reservoir. That is another story – the dynamical change. If there is not a balance between the incoming energy flux and the outgoing energy flux, the Earth will warm or cool. This fact is accepted also by IPCC. The volcanic eruptions cause only temporary changes into the energy balance and normally these effects disappear in 3…5 years. This not a matter of the climate change, where the minimum time period is about 11 years.

Greg
Reply to  Greg
October 11, 2016 9:21 am

Thanks for the reply. But GHE does not affect the TOA energy budget for the reasons you cite. To examine the effects of GHE we need to look inside the system. It is claimed to the ‘insulating’ effects of GHG which re-emits part of the outward IR back downwards, increases the surface temp and raises the effective emission layer height.
If a change in atmospheric composition is supposed to add an extra downward IR flux you need to be able to distinguish that from an extra downward flux of SW caused by another change in atmospheric composition. Those are changes in the troposphere and lower stratosphere , not TOA budget. Your account of why it does not matter does not hold up.
Your explanation also ignores albedo changes, outgoing LW is no the only outwards flux.

Reply to  Greg
October 11, 2016 9:01 pm

Greg. In your comment below you go from the original issue to another and to the third and so on. The question was, that the absorption of SW radiation by the atmospheric GH gases have no effect on the Earth’s energy budget and on the global temperature. I have explained , why this is so. If you do not accept it, I cannot help.

October 11, 2016 1:56 am

Max Planck’s analysis of the work done by Lummer and Pringsheim on distribution of energy in the electromagnetic spectrum alleviated 19th C concerns about the ultra violet catastrophe. Doesn’t this current theory again exaggerate the effect of uv radiation.

Reply to  chemengrls
October 12, 2016 1:52 am

Of course CO2 does not cause global warming either. It is well known that at present the conc of 400ppm CO2 absorbs to extinction the absorbable IR in a short distance of traverse (4000m). Doubling CO2 to 800ppm would reduce the distance to 2000m but there would be no further absorption of IR from the primary emitted radiation; and therefore no additional heating. There is no correlation between conc and warming.

David Bennett Laing
Reply to  chemengrls
October 16, 2016 6:37 pm

chemengris: UV-B has 48 times the frequency (is 48 times “hotter”) than the Earth IR absorbed by CO2, A little goes a long way.

Richard Baguley
Reply to  David Bennett Laing
October 16, 2016 6:51 pm

David, photons do not have “temperature” so your claim that UV-B is “hotter” than IR shows you lack a basic understanding of physics.

Reply to  David Bennett Laing
October 17, 2016 8:21 am

How are the photons of incident light from the sun that are absorbed by our planet affected by atmospheric changes?

David Bennett Laing
Reply to  David Bennett Laing
October 17, 2016 1:51 pm

Richard Baguley: Notice that I put “hotter” in quotes. As a matter of fact, I am quite skeptical that “photons” exist at all. We have no experimental or observational proof that they exist except by the use of material sensors, and the latter are affected by interaction with radiation. We have no convincing proof, in other words, that electromagnetic radiation (EMR) is anything other than a frequency field traveling at light speed, which, BTW, causes problems with their supposedly having an energy content (it would have to be infinite, which is impossible). Also, EMR radiates outward in all directions. Cramming photons together at the source of any EMR makes no physical sense. In my view, energy is created upon the interaction of EMR with matter. “But wait!” you say. “What about the first law of thermodynamics? Simple. If you read the fine print, the first law only applies to thermally isolated systems, which Sun and Earth are not, so when Sun “rises,” its EMR field induces resonant reactions in material bonds, which respond according to quantum leaps, producing “photons.” When Sun sets, this energy dissipates and the cycle repeats. Quantum mechanics, in other words, is simply a rather good description of the fine structure of matter, nothing else.

Richard Baguley
Reply to  David Bennett Laing
October 17, 2016 2:09 pm

Yes you did put the word “hotter” in quotes. However, your choice of words is very poor. You should have used the term “more energetic” instead of “hotter.” If you did that, it would have given the impression that you knew what you were talking about.
..
PS “photons” exist as a construct, of a theory of EM that has proven to work very well. You can be as skeptical as you wish, but until you come up with a better explanation, I’ll stick with “photons.”

David Bennett Laing
Reply to  David Bennett Laing
October 17, 2016 2:10 pm

chemengris: see my reply to Richard Baguley, above.

Reply to  David Bennett Laing
October 18, 2016 2:57 am

Despite UV’s big photon most of the energy coming from the sun is in the visible region of the electromagnetic spectrum. However it is the only source of vitamin D and photosynthesis.Didn’t catch your previous reply.

Reply to  David Bennett Laing
October 18, 2016 3:57 am

Did catch your reply concerning hot photons. Photons do exist as Einstein explained in 1905. Planck’s quantum (construct) is Einstein’s photon. They are discreet and very energetic at the high frequency end; gamma and X ray photons colliding with electrons ionising oxygen and nitrogen above the stratosphere in the ionosphere. The subsequent electrons would be even more energetic maybe interacting with Earth’s magnetic field as cosmic rays do..

David Bennett Laing
Reply to  David Bennett Laing
October 18, 2016 10:49 am

chemengris (Oct 18, 3:57): I agree that something like photons does exist, but in matter only. I really don’t think that they travel through space with EMR, and there is absolutely no evidence that they do. If they did, aside from the problem of crowding at the source and the light speed problem, making energy infinite, if they actually traveled through space, then there would be two distinct types of energy: one bound to matter (kinetic, gravitational, potential, chemical, etc.); and one not bound to matter (that which travels through space); a rather unlikely condition. To my mind, energy is an attribute of matter, and not separable from it.

Reply to  David Bennett Laing
October 18, 2016 11:20 am

That is a very interesting thought.

Reply to  rishrac
October 18, 2016 12:05 pm

Energy and matter are one and the same thing E=MC^2. Immediately after the big bang only pure energy could exist; on cooling, matter was able to form plasma eventually then H2 after 380000 years with an imbalance between matter and antimatter. De Broglie demonstrated the wave particle duality of the electron.

David Bennett Laing
Reply to  David Bennett Laing
October 18, 2016 7:05 pm

rishrac: Thanks!

Peta in Cumbria
October 11, 2016 2:42 am

Interesting post – much similar to my thinking. Epic Fail with that UV tangent/distraction.
Some thoughts and numbers – take them away and chew ’em over.
Several commentators say that ‘plants respond to temperature’ and seemingly they do.
BUT, is it not possible they are responding to their food supply and that is the temp-sensitive thing. any arable or grassland farmer will tell you that nothing much happens/grows with soil temp below 5’C
But wait a minute, why is the fridge in your kitchen running/set at that sort of temp. 4 or 5’C. Is it not because bacteria pretty well stop growing/working at that temp?
The body who wrote The Vegetarian Myth put it nicely (and it goes somewhat against what we all learned in school) when she said “Soil bacteria chew up old/dead plants and living plants suck up the ensuing slop”
Bit like what happens in our own stomachs yes/no? Digestion we might call it.
Now we’ve got that soil bacteria start working when dirt is above 5’C – what do they produce and what can they make from dead plant material and oxygen from the sky 9or ready dissolved in the water) if not more water and CO2? And how many times do we hear that CO2 dissolves in water to make acid (as if there wasn’t plenty water in the dirt already but we knew that)
And that acid dissolves the rock/mineral fraction of the dirt to release all the myriad of trace elements plants need. And there are plenty more acids you get from breaking down old plants – acetic, propanoic, lactic, butyric etc etc
Of course this is where Global Greening (esp of deserts) can come unstuck – there are no trace elements in your average desert. That’s why its a desert. Sand/silica is of limited use to plants.
eg. It needs one atom of magnesium to make a chlorophyll molecule – I don’t hear about many magnesium mines in the sahara. Do you?
Maybe some of that CO2 escapes to the surface of the dirt? Is it not possible that that is why the stomata ‘mouth parts’ of almost all plants are on the underside of their leaves – they are expecting their CO2 food to come up from underneath them?
So when dirt warms above 5’C everything happens for the plants, a rush of CO2 starts and all the trace elements they need become water-soluble so they can suck them up thro their roots. And by definition, the sun must be shining to have warmed the dirt= a triple whammy of planty goodness and away they go.
Here’s a number, do please check because I get these things wrong more than not
Farming uses 10% of Planet Earth= 5e13 sqm
That fertile dirt did or should be approx 50% by volume organic material and will extend down for maybe 2 feet (as far as oxygen can ‘penetrate’) Lets call it two-thirds of a metre for ease.
So there’ll be 16e12 cubic metres of organic ‘stuff’ down there and take the density of that to be 667kg per m3 gives us 11,000 gigatonnes of organic material. (it would make 20,000 gigaton of CO2 if you burned it – eat yer heart out fossil-fuel wimp)
That’s what should be there in a natural undisturbed world and probably what was there some centuries ago and especially when the dirt was covered by perennial plants.
perennials are always ready to ‘go’ when some food arrives AND they always (think about it) make an almost impenetrable mat over the dirt. Any CO2 molecule coming out of the dirt under a mat of grass or under a forest canopy really does have its work cut out to escape – does it not?
So what’s happened lately, especially since WW2?
World people population has skyrocketed and they’ve been eating (Lord help them) carbohydrate produced from annual plants. We utterly depend on that massive urge annuals have to produce viable seed – they only have one shot at it.
When the dirt warms in springtime and the bacteria start work, where is the ‘cover’ that perennial plants offered?
Gone.
Replaced by rows of tiny immature things sitting on (square) mile after mile of dark coloured bare soil. They cannot absorb all the CO2 the soil is making nor do they shelter the low-albedo dirt from being heated by the sun. And the plants are still tiny when the sun is at its highest/strongest= May & June in the NH
Is it really that impossible to believe that that is where the high temps and extra CO2 is coming from?
It gets worse because when the dirt is at its warmest (August & September) and bacteria are working hardest, the annual plants effectively die (ripen and are harvested) and cease to absorb all the CO2 coming up at them.
Even worse during Fall is all that dead plant material being exposed to a still strong sun. The same solar energy that smashed up CO2 & water so the plant can make sugar, simply reverses the process and smashes up cellulose/lignin – back into CO2 & water
The next major factor is again the soil bacteria.
Yes they need water, oxygen, carbohydrate food and warmth but their activity is limited by one major nutrient. Like all critters they need a ‘balanced diet’ – they need ‘protein’
Plants, even dead ones are notoriously low in that – just look at the pasty faced vegetarians amongst us!
Bacteria are not fussy, anything containing nitrogen will do but soluble nitrogen is their Liebig limiter.
Unfortunately, in its useful form is always extremely water soluble and gets washed away in winter rains.
But here’s the WW2 connection. We’d worked out how to make nitrate in large quantities, especially for really important tasks like blowing the sh1t out of somebody else. And so we did. Both of those things.
But when we finished sh1it blowing, we were stuck with huge amounts of soluble nitrogen and (re)discovered that it seems to make plants grow like crazy.
No is doesn’t. It makes the soil bacteria grow like crazy and it is they that cause the plants to respond likewise.
Hopefully by now you’ve got a reasonable idea of my idea. The rising CO2 curve is coming from that massive reserve laid down over 1,000’s of years by perennial plants in forests & grasslands, when there were so few of us on the planet we didn’t make a jot of difference.
See the numbers, 20,000gt of CO2 just under existing farmland, let alone peat bogs and especially what’s locked up in permafrost.
Modern farming is doing the recent warming AND releasing the extra CO2 we’re releasing in doing so. The plants we grow cannot cope with all the extra (CO2) food they’re being given.
Previous warming (1910~ 1940?) and just a random ill-considered thought.
Were we not burning vast amounts of coal then. hence why we have the Black Country here in England. It was ‘black’ because it was covered with soot. And so would everywhere else – especially where people lived, worked and, really importantly, put the thermometers.
A strong body of opinion here says the Arctic is melting because of (diesel engine) soot, so could not soot in the inter-war period, along with and effective UHI bias have caused the observed warming?
sorry its so big

Samuel C Cogar
Reply to  Peta in Cumbria
October 14, 2016 6:14 am

@ Peta in Cumbria
I’m 3 days late at replying to your posting but am hoping you read this.
T’was really great commentary by someone that know quite a bit about the Biology of the natural world.
I especially liked your “refrigerator” comments regarding microbial decomposition of dead biomass.
But I have to disagree with your comments regarding microbial decomposition of dead biomass during the months of September and October simply because those are the “dry months” with cool nights …… and all microbes require moisture to do their job. That’s why “dried” foods last for years n’ years.
And one (1) more really important “disagreement” pertaining to the source of the bi-yearly cycling of atmospheric CO2 ppm.
Sam C

JPinBalt
October 11, 2016 2:56 am

The analysis is interesting, but should be completely redone at a minimum splitting different latitudes. The impact of ozone anomalies would be highest at poles because of the geomagnetic field and penetration of UV. The whole analysis should be opposite for Southern Hemisphere on monthly basis, but muted opposite effect near equator. Latitudes in each hemisphere could also be weighted for statistical analysis as opposed to just separated. Why stop at 1998 or skip Southern Hemisphere when data is available? Statistically also need to do multivariate regression analysis with lags for times series data, plus take out or separate high atmospheric sulfur events such as volcanoes likely causing huge outliners in data using another data set. Need to look at t-values after fixes as opposed to simple graph. Fruitful direction.

David Bennett Laing
Reply to  JPinBalt
October 16, 2016 6:43 pm

JPinBalt: I’ve answered all these concerns in previous replies.

October 11, 2016 3:44 am

I was trained in math, but have followed the saga of climate change hysteria since the mid 70s when professors told me I was going to freeze to death in a new ice age. I have seen many hypothesis put forward to attempt to explain why the climate varies on this planet and honestly there has been little real science involved in developing the “modern consensus” of CO2 did it.
To me, the most unfortunate thing has been the modern reductionist methodology leading to looking for one grand cause. I am pretty sure that the atmosphere of the planet has many things that effect it in many ways leading to the variations we see. The best science that I have seen is the demonstrations from thermodynamics that CO2 don’t do what they say it does. (site policy forbids going too far down that road)
I saw someone up-thread say that you had to take gases and put them in a bottle in a lab to find out what they would do in the open atmosphere. That reminds me of the modern biologists who grind up dead cells and look at the components under our modern ultra-high-tech microscopes to try to see what a living cell does.
It would seem to me that modern science would have already put the idea that CO2 leads to great average warming on this planet long ago — if it were not so darned profitable to claim that mankind is at fault. (hence CO2)
The saddest tactic I have seen by the usual suspects is that if you don’t have a theory to replace the one you just disproved then you have not really disproved anything. BS.

Samuel C Cogar
Reply to  markstoval
October 11, 2016 5:22 am

Markstoval, that was “fine” common sense commentary …… except for your choice of words, or more importantly, the lack of words, …… in your last statement, to wit:

The saddest tactic I have seen by the usual suspects is that if you don’t have a theory to replace the one you just disproved then you have not really disproved anything.

Me thinks you statement should read ……. “to replace the one you just claimed that you disproved” …………. or ……….“to replace the one you think or believe you just disproved
If you give then an inch, thy will take a mile, so don’t even infer or suggest to one of them that “you just disproved” whatever, when they didn’t even come close to doing said.

Khwarizmi
October 11, 2016 5:49 am

Regarding the ozone/temperature correlation in figure 2, quoting from the “RGB analysis of air mass and jet stream” manual explaining how to interpret images from the Himawari-8 geostationary satellite:
========================
* B12 is ozone absorption band
* Difference image shows atmospheric ozone contents
* Ozone content: high latitude, cold air > high latitude, warm air
*** much ozone in the stratosphere (the ozone layer)
Height of tropopause is high on warm area, so stratosphere thin
–> few ozone on warm area
* warm, few ozone content appears in green
=========================
http://rammb.cira.colostate.edu/ramsdis/online/images/himawari-8/full_disk_ahi_rgb_airmass/full_disk_ahi_rgb_airmass_20161011114000.jpg
“Few ozone on warm area” because stratosphere thin when area warm.
Not, “area warm because ozone thin.”
Cart before horse?

MarkW
October 11, 2016 6:56 am

“maximum concentration in the month of May in the northern hemisphere”
They use a different calendar in the southern hemisphere?

David Bennett Laing
Reply to  MarkW
October 16, 2016 6:51 pm

MarkW: Yes. The bioutilization variability of CO2 is 6 months out of phase with the northern hemisphere.

MarkW
October 11, 2016 6:59 am

It would be nice if you could demonstrate that there actually has been some ozone depletion, instead of just assuming that it exists.
The link between CFC’s and ozone destruction is tenuous at best, if not altogether disproven.

David Bennett Laing
Reply to  MarkW
October 16, 2016 6:52 pm

MarkW: ??? That is taken directly from the ozone database of Arosa, Switzerland.

October 11, 2016 7:10 am

Ozone loss causes warming? By that logic, Antarctica should be warming the most. It’s actually warming the least….

David Bennett Laing
Reply to  beng135
October 17, 2016 5:52 am

beng135: See Hughes, G. L., et al., 2007, Statistical analysis and time series models for minimum/maximum temperatures in the Antarctic Peninsula, in which warmings of up to 6.7 degrees C, the world’s highest, are reported.

Griff
October 11, 2016 7:39 am
October 11, 2016 7:41 am

I’m not much into atmosphere based climate science. I’m an ocean man.

October 11, 2016 8:43 am

A good, thoughtful article. And I think the sidetone on ozone/UV is interesting. The “pause” in global warming does parallel a stabilization in stratospheric temperatures following the 1996 full-implementation of the Montreal Protocol.
Some worthwhile points in this article to ponder.

David Bennett Laing
Reply to  Steven Capozzola
October 17, 2016 6:13 am

Tx, Steven Capozzola!

nobodysknowledge
October 11, 2016 9:18 am

The value of very long instrumental data series
by Alan Longhurst https://judithcurry.com/2016/10/10/the-value-of-very-long-instrumental-data-series/
AL shows the “big jump” in temperatures from 1985 to 1990. Up one step in the stairs.
The Trend Profile of Mean Global Total Column Ozone 1964-2009
by Jamal Munshi http://papers.ssrn.com/sol3/papers.cfm?abstract_id=2843032
JM shows the great decline in ozone between 1970 to 1993. Down in the cellar.
Most of the decline in ozone comes earlier then the jump in temperature. And ozone depletion stopped in 2003 when temperatures stabilized. Why is climate science so reluctant to analyse the additional energy from UV radiation.

nobodysknowledge
October 11, 2016 9:38 am

From: Peter Ward. http://ozonedepletiontheory.info/ozone-distribution.html
“When total column ozone is depleted, less solar energy warms the stratosphere causing the tropopause to rise, allowing more UV radiation to be absorbed by Earth. When total column ozone increases, more solar energy is absorbed in the stratosphere, warming the stratosphere, lowering the tropopause, cooling Earth. Ozone accumulates over the Arctic in winter (Fioletov, 2008), causing increased heating of the stratosphere and less heating of Earth resulting in minimum temperatures that are particularly cold during January in the Arctic and at mid-latitudes when Arctic air masses move southward. Depletion of this polar ozone peak warms minimum winter temperatures and it is this warming of minimum winter temperatures that is most clearly observed. The extremes of temperature are much larger during the winter when ozone accumulates and is depleted. For example, in Britain, the difference between record high and record low temperatures from 1870 through 1999 was 47oC during February-March and 38oC during July (Webb and Meaden, 2012).”
“The area of the Antarctic ozone hole grew rapidly from the 1970s to the 1990s while minimum ozone in the hole decreased (NASA Ozone Hole Watch).”
“On land, much of the energy absorbed during the day is radiated back into the atmosphere at night. At sea, however, ultraviolet radiation penetrates the ocean to depths of more than ten meters (Tedetti and Sempéré, 2006), making it more effective at heating the ocean than infrared radiation absorbed near the surface where much of the energy is lost back into the atmosphere at night. Similarly more ultraviolet energy is reflected back into the atmosphere on land than at sea. The effect of ultraviolet radiation on air temperatures could be small unless there is substantial lower-tropospheric pollution including O3 and NO2, while its effect on increasing ocean heat content could be substantial. The oceans account for 93% of the warming of the Earth system that has occurred since 1955 (Levitus et al., 2012).”

Michael J. Dunn
Reply to  nobodysknowledge
October 14, 2016 3:45 pm

Just a point to consider: Essentially all the UV is completely scattered by the atmosphere (Rayleigh scattering). Half of it goes to space anyway. This means that most of the UV radiation that falls on the Earth is at a wide range of incidence angles, due to the scattering (same story for the blue light of the sky). Low-incidence light will tend to specularly reflect from water surfaces (glare). I don’t see much discussion of these facts, so I am doubtful of the conclusions drawn in their absence.

Chimp
Reply to  nobodysknowledge
October 14, 2016 3:56 pm

While varying amounts of UV get to the surface, and overall its share of TSI is small, its flux does vary far more than TSI. As what does make it through the ozone layer and other obstructions heats ocean surface, the big variation in the UV spectral component of TSI could well be IMO an important player in climatic fluctuations.

David Bennett Laing
Reply to  Chimp
October 17, 2016 6:23 am

Chimp: especially since solar UV-B has 48 times the frequency of Earth’s IR absorbed by CO2, and is correspondingly more intense as a heating source.

October 11, 2016 10:53 am

I took the NOAA record of northern hemisphere temperature anomalies (red curve, above) and gave it the same treatment for the 24-year period 1975 to 1998, when the globe warmed dramatically by nearly one degree centigrade. Notice that the temperature anomaly has its maximum value in March, two months before the maximum of the CO2 curve.
Now, if variations in the concentration of CO2 in the atmosphere had any effect on temperature, you would expect that the peak in CO2 would occur with or before the peak in temperature, but it actually occurs two months afterward, which shows that variations in atmospheric CO2 cannot possibly have a significant effect on temperature. Notice, however, that there is a very small up-tick in the temperature anomaly in June, showing that in fact CO2 actually does have a slight effect on temperature, but not a significant one.

This anomally is similar to some of what I’ve been doing. It peaks in March in the NH as that’s when the temp changes the most per day for warming, and oct/nov it’s changing the most negative per day. I could see Co2 rising as plants decay (you mentioned this) falling as plant life starts to grow for spring.
This rate of change has changed only slightly since the 50’s.

Samuel C Cogar
Reply to  micro6500
October 12, 2016 3:02 am

@ micro6500

”I could see Co2 rising as plants decay (you mentioned this) falling as plant life starts to grow for spring.”

Your above mimicry of “junk science” propaganda doesn’t help your credibility any.
Here, let’s see iffen you can contemplate, correlate or associate the increases & decreases of the plotted “temperature and CO2 ppm” on this graph, to wit:
http://i1019.photobucket.com/albums/af315/SamC_40/1979-2013UAHsatelliteglobalaveragetemperatures.png

October 11, 2016 1:01 pm

“Now, if variations in the concentration of CO2 in the atmosphere had any effect on temperature, you would expect that the peak in CO2 would occur with or before the peak in temperature, but it actually occurs two months afterward, which shows that variations in atmospheric CO2 cannot possibly have a significant effect on temperature.”
logic fail.
study the theory harder.

David Bennett Laing
Reply to  Steven Mosher
October 17, 2016 6:28 am

Steven Mosher: Theory must ALWAYS be constructed on the basis of hard data; not the other way round.

October 11, 2016 1:19 pm

David, I really like your one-sentence CV that Anthony unearthed. It is original and says everything that needs to be said. Mine differs from yours in schools attended except for Dartmouth which I finished 17 years before you did. I want to talk here about the Keeling curve but first let me tell you that you made a huge mistake when you chose 1975 – 1998 for a comparison period. NOAA and associates have falsified this segment by creating a phony warming when the eighties and nineties were clearly a hiatus (no warming) period. Figure 15 in my book “What Warming?” shows this hiatus clearly. There are five El Nino peaks there that line up horizontally. NASA described this temperature segment in 1979 as follows:
“Unlike surface-based temperatures, global temperature measurements of the Earth’s lower atmosphere obtained from satellites reveal no definitive warming trend over the past two decades. The slight trend that is in the data actually appears to be downward. The largest fluctuations in the satellite data are not from any man-made activity, but from natural phenomena such as large volcanic eruptions from Mt. Pinatubo, and from El Nino. So the programs that model global warming in a computer say the temperature of the Earth’s lower atmosphere should be going up markedly, but actual measurements of the temperature of the lower atmosphere reveal no such pronounced activity.”
Note that actual measurements fail to show any warming and yet the masters of global temperature curve have inserted a fake warming in there. And it does not stop there but is continued on to the 1998 El Nino and to the twenty-first century that follows. I have been warming about this for years but these big shots at NOAA etc. feel that they are so important that they can ignore any pipsqueak objections from climate workers. And their supporters like Bob Tisdale have been libeling me about this but Anthony Watts does nothing. I knew that somebody working on temperature would eventually be misled by this falsification and here it is. To me, it is a scientific crime and they should be thrown out.
I am glad you took up the wiggles of the Keeling curve because they prove that no warming shown on global temperature curves can possibly be greenhouse warming. Comparing the amplitude of the wiggle in ppm with the amount of CO2 shown on the carbon dioxide curve in your graph we get ratios like 60 to 1 (for 360 ppm) etc. A more important comparison is between the Keeling curve and the Global temperature history curve that NOAA, GISS and others put out. They differ but not in the important aspect of comparison with Keeling. On the scale where global temperature ups and downs are shown clearly the seasonal wiggle cannot even be seen on the Keeling curve except as a fuzz that is barely noticeable. My first estimate in comparing the amplitudes of a substantial global warming with Keeling was that it is probably a close to a hundred to one ratio. We are told that the warming shown on the global warming history graph is caused by the greenhouse effect of carbon dioxide. Well, put it next to the Keeling curve that shows what carbon dioxide actually does and you immediately note that none of the temperature peaks and valleys on the temperature chart have any counterparts on the Keeling curve. It is totally smooth, except for that fuzz after 1958. I actually noticed it many times but for reasons unknown I did not give it any thought. What I missed was the fact that if a warming starts from scratch, atmospheric carbon dioxide displayed by the Keeling curve also must increase at the exact same time to make greenhouse warming possible. Since this does not happen it follows that the warming that we observe cannot possibly be greenhouse warming. Actually, there is a small amount of greenhouse warming in the forests of the world as shown by the existence of the seasonal wiggle. Its amplitude is a hundredths of the amplitude of the global warming peaks they try to sell us as products of greenhouse warming. If that is really the case these warm peaks must have been created by a carbon dioxide cloud a hundred times larger than we get from dropping of leaves that created the wiggle. And also invisible at the same time too because the Keeling curve cannot see it at all. In short, greenhouse warming is impossible and decarbonization of atmosphere that is forced upon us cannot possibly change the climate. With that, AGW is dead and I want a refund for all my taxes applied to this asinine effort to change the climate.

Reply to  Arno Arrak (@ArnoArrak)
October 11, 2016 7:55 pm

Typos:
17 years =11 years
warming about = warning about

David Bennett Laing
Reply to  Arno Arrak (@ArnoArrak)
October 17, 2016 6:50 am

Arno Arrak: Thanks for the input, Arno, but if you say temperature didn’t shoot up during 1975 to 1998, then why do all the temperature time series besides NOAA’s and the satellite records also show that it did just that? Cheers, David

ScottM
October 11, 2016 1:31 pm

If the anomaly in a given month/year is just the average temperature for that month/year minus the average temperature for that month across all years of the baseline period, would the curve have the same shape if a different baseline period had been selected? And if not, how can you convince anyone that this is the one true shape?
If each point on the graph represents an average over more than 2 decades, how does that point represent the long-term change over that period?
Anthony’s first instinct was correct – this is the kind of creative accounting employed by so-called “slayers”.

Reply to  ScottM
October 11, 2016 7:02 pm

ScottM October 11, 2016 at 1:31 pm
The way you define it the shape of the curve would not be affected but the vertical placement of the entire curve would be. As an example, he just accidentally picked a baseline containing a fake warming and as a result his temperature curve stands higher on the graph than it would be if the unmodified baseline had been used.

ScottM
Reply to  Arno Arrak (@ArnoArrak)
October 12, 2016 12:10 am

The way I define it? The way base period is defined by scientists, in order for this curve to have anything other than a flat line at zero, the anomaly must be different during the period over which the graph is averaged than it was over the baseline. What if we selected 1975-1998 as the baseline, and then chose to graph the anomaly of each month over the period 1981-2010 (NOAA’s baseline). The effect will be to replace each X-Y with Y-X. The curve would be inverted from what you see above. Now pick a baseline of 1950-1980 and redo the graph for 1975-1998 relative to that baseline. The effect will be to replace each X-Y with X-Z. Unless all of the Zs are equal to the Ys (of the respective months) minus a constant, your conclusion that only the “vertical placement” would be affected is unfounded. You seem to think that they are *necessarily* equal. But if it were necessarily the case, then it would also necessarily be the case that all of the Xs would be equal to the respective Ys. And that would yield a perfectly flat graph, which we do not see above. That the author’s graph doesn’t have a flat average temperature anomaly curve therefore disproves his own case. The curve shows nothing. Note: For a given month, X = average temperature in that month from 1975-1998; Y = average temperature in that month from 1981-2010; Z = average temperature in that month from 1951-1980. Anomaly is the difference in a month’s average temperature for the period of interest and the same month’s average over the base period; e.g., X-Y or X-Z depending on which of two base periods we choose. In general, X, Y, and Z for a given month can (and most often will) have different values because of the different periods represented.

ScottM
Reply to  Arno Arrak (@ArnoArrak)
October 12, 2016 6:39 am

Sorry, I meant to write “the way anomaly is defined by scientists” in that opening paragraph.

dikranmarsupial
Reply to  Arno Arrak (@ArnoArrak)
October 13, 2016 12:03 am

I think NOAA’s baseline is the whole of the 20th century, so we would expect to see some difference if we only take the mean over a few decades within that period (of course scaling it from 0-100% means we don’t know the magnitude of the cycle). Basically this just shows how the seasonal cycle over that period was slightly different from the seasonal cycle on average over the 20th century.
More importantly, taking the baseline month by month in this way to calculate the anomaly will subtract off any influence the seasonal cycle in CO2 might have on the seasonal cycle of temperature before the analysis is even performed. It is hardly surprising that the analysis doesn’t find an association given that it analysed data with the seasonal cycle deleted already!

David Bennett Laing
Reply to  ScottM
October 17, 2016 7:02 am

ScottM: Good points. No, actually, the curves would look the same if different base periods were used. The resultant anomalies are referred to certain base periods for convenience in discussion, only. Its sort of like drawing the contours on the head of the Statue of Liberty. You can start at the base and include everything from there, or you can take your base line at neck level instead. The contours would come out exactly the same either way.
As to your second point, I removed all long-term trends from the data sets by averaging monthly values, so my graph contains no long-term trend information whatsoever. It only assesses the question of the relative timing of maximum variabilities in each of the datasets.

dikranmarsupial
Reply to  David Bennett Laing
October 18, 2016 9:44 am

“ScottM: Good points. No, actually, the curves would look the same if different base periods were used. ” no they wouldn’t becase the anomalies are relative to the mean for each month of the baseline period, not some constant temperature.

David Bennett Laing
Reply to  David Bennett Laing
October 18, 2016 6:56 pm

dikranmarsupial: I stand corrected on that. They would, in fact, look different, and the graph of temperature variation from a simple 20th century norm probably wouldn’t show the apparent dependence of temperature variability on ozone depletion as clearly as the deviation from a monthly norm does.

October 11, 2016 7:26 pm

This is so easy to spin the opposite direction. I haven’t read every comment, so I don’t know if anyone else thought of this, but here goes…
If you look at the monthly anomaly curve, CO2 maxes in May, and temps in March. Rather than CO2 tailing temps by two months, it’s actually LEADING temps by ten months.
Q.E.D.
Where’s my grant money?

David Bennett Laing
Reply to  James Schrumpf
October 17, 2016 7:05 am

James Schrumpf: I did think of this possibility, but it seemed so remote that I didn’t consider it seriously. Can you give me one good reason why a signal in one dataset should take ten months to show up in another one?

Reply to  David Bennett Laing
October 17, 2016 5:59 pm

I don’t have any idea, I was speaking totally tongue-in-cheek.

Ian H
October 11, 2016 8:58 pm

Obviously the next step is to look at the daily cycle. During the day temperature rises as CO2 levels fall. So CO2 must cool the planet. Obviously.
Note for the sarcasm deprived:
Obviously … this is a complete load of rubbish, just like the original article.

pochas94
October 12, 2016 4:13 am

Figure 2 shows both temperature and ozone anomalies coinciding with the spring solstice when insolation is max, as is to be expected. Also, the decline in CO2 waits for May when the plants awake and begin their rush of growth, hungry for all the CO2 we humans released over the winter. But there is no need to invoke irrelevancies such as the CFC boondoggle. These made-up scares serve only to illustrate the perfidy, mendacity, and utter dishonesty of a few scientists with their many greedy hangers-on.

David Bennett Laing
Reply to  pochas94
October 17, 2016 7:11 am

pochas94: How else would you explain the sharp coincidence of the warming and ozone depletion curves and their high correlation than that they suggest that ozone depletion is a serious possible contender for an important role in global warming? Are you objecting to my agreement with Molina’s mechanism for the photodissociation of CFCs on polar stratospheric clouds releasing monatomic chlorine, which then destroys ozone catalytically?

pochas94
October 12, 2016 4:26 am

Right. May is an equinox, not a solstice.

ScottM
Reply to  pochas94
October 12, 2016 6:40 am

Nope. Neither.

pochas94
Reply to  ScottM
October 12, 2016 1:25 pm

I wuz confused.

William Everett
October 12, 2016 6:10 am

Neither the argument for carbon dioxide levels or ozone layer changes being the cause of global warming is supported by the fact that the global warming is not continuous but rather seems to occur in a series of rises and pauses that do not appear to be random but rather occur in a predictable pattern.

ScottM
Reply to  William Everett
October 12, 2016 6:45 am

Looking at the last thirty years, it was below the trend line for the first ten, above the trend line for the second ten, below it for the last ten. And has recently returned to sit on top of the trend line, which is maintaining a positive slope.

Reply to  William Everett
October 12, 2016 7:09 am

William Everett:
Since 1870, there have been 2 depressions, and 28 recessions. ALL are coincident with temporary increases in average global temperatures, due to fewer sulfur dioxide emissions into the atmosphere because of the reduced industrial activity.
Between 1972-present, Clean Air efforts have resulted in decreased SO2 emissions, which also cause increases in average global temperatures.
There is no cyclic nature to climate change. It is all due to the amount of SO2 aerosols in the atmosphere.
Bottom line: Climate change is being caused by the EPA

William Everett
Reply to  Burl Henry
October 12, 2016 10:32 am

Burl Henry, I am not talking about climate change. I’m talking about temperature history and it does occur in a 500 year cycle according to the currently held view of notable climatologists. I’m saying that there appears to be a thirty year cycle of warming and pause in warming. As far as ScottM’s comment, going back thirty years from the present is meaningless. The changeover point between the previous warming period and the current pause occurred around 2002 by my reading of the temperature record. If there is a pattern to the temperature change then the next change point from a pause to a period of warming should occur around 2032. The global mean temperature at that time should be about the same as it was in 2002 barring the occurrence of an El Nino effect at the 2032 changeover time. Also, if the apparent pattern holds then there will only be 40 years of warming in the present century.

Reply to  William Everett
October 12, 2016 11:25 am

William Everett:
You mentioned “The changeover point between the previous warming period and the current pause..”
A couple of questions:
What years are encompassed by “the previous warming period?
Temperatures in 2014-2016 are substantially higher they were in 2013 and earlier. What do you mean by “the current pause”?

ScottM
Reply to  Burl Henry
October 15, 2016 10:06 pm

William Everett, you missed my point in a number of important ways, by focusing simply on the apparent cyclic aspect of what I wrote. The same inference can be drawn whether the wander above and below the trend line is cyclic or simply a random walk: namely, that regression to the trend line happens. But you also included a non sequitur that temperatures would be the same in 2032 as they were in 2012 (if we stipulate that the wander is truly cyclic). You completely ignored the fact that the wander is superimposed on a positive trend – so when you complete a cycle, you will be at a higher temperature than you were at the start of the cycle.

ScottM
Reply to  Burl Henry
October 15, 2016 10:10 pm

If you read carefully, you will not find that I hypothesized a cycle of any kind; merely described what the temperatures did.

David Bennett Laing
Reply to  William Everett
October 17, 2016 7:17 am

William Everett: One important consideration is that stratospheric ozone concentration is quite evanescent, fluctuating rapidly during ozone’s short lifespan of several days, whereas the atmospheric concentration of CO2 is quite steady. This is consistent with the temperature effects being erratic.

William Everett
October 12, 2016 3:16 pm

The years in the previous warming period were from about 1974 until about 2002. Temperatures in 2014-2016 were caused by a strong El Nino effect which has subsided. There have been other temperature spikes since 1880 caused by El Nino effects. These short term effects have not erased the longer range of temperature change which features periods of warming and periods of pause in the warming. Refer to the global temperature record published by NOAA and GISS.

Reply to  William Everett
October 12, 2016 7:48 pm

William Everett:
For the period 1972 to 2000, global Sulfur Dioxide emissions fell by 25 Megatonnes, which resulted in O.5 deg. C. of anomalous temperature rise in land-ocean surface temperatures..
Between 2000 and 2013, global Sulfur Dioxide emissions fell by 8 Megatonnes, for an anomalous temp. rise of 0.16 deg.C.(the “pause”, although they never did actually stop rising).
Your cycles have to occur for a reason, and it appears that they are .related to the amount of SO2 emissions in the atmosphere. Between about 1955 and 1972 SO2 emissions were rising, which would cause cooling, and your previous “down” cycle probably spans those years.
Going forward, I believe there should be an “up” cycle, and never a down cycle beyond some La Nina cooling, unless we have some large volcanic eruptions, because of continuing reductions in SO2 emissions.

David Bennett Laing
Reply to  Burl Henry
October 17, 2016 7:46 am

Burl Henry: As I noted previously. Peter ward found that there was a twenty-year lag between the anthropogenic rise of SO2 in the atmosphere and the rise in global temperature, but the rise in ozone depletion curve only lagged temperature by some five years. He therefore concluded that ozone depletion was a more likely cause than SO2.

David Bennett Laing
Reply to  William Everett
October 17, 2016 7:42 am

William Everett: Peter Ward attributes the warming spike in 2015 to 2016 to ozone depletion caused by halogens emitted during the eruption of Iceland’s non-explosive, basaltic volcano Bardarbunga from August, 2014 to February, 2015, the largest such eruption since Laki of 1783.

William Everett
October 13, 2016 5:20 am

I believe that the reason for the 500 year warming (or cooling) cycle is because of a change in Earth’s relationship to the Sun. I think the apparent 30 year pattern of warming followed by a pause in warming is also caused by change in the Earth’s relationship to the Sun. The sulfur dioxide emissions are probably in the same category as carbon dioxide emissions, insignificant as an influence on global temperature.

Reply to  William Everett
October 13, 2016 6:55 am

William Everett:
AT this time, I cannot speak to earlier cycles, but over the past 40 years temperature projections based solely upon the amount of reductions in SO2 emissions are accurate to within .02 deg. C., or less.
For this time period, they are highly significant with respect to average global temperatures.

David Bennett Laing
Reply to  Burl Henry
October 17, 2016 7:47 am

Burl Henry: Could be a spurious correlation.

William Everett
October 13, 2016 9:05 am

Until it is shown otherwise I think that the mean global temperature will remain level until about 2032 reflecting the temperature history available to us since 1880.

David Bennett Laing
Reply to  William Everett
October 17, 2016 7:49 am

William Everett: On what data do you base your assumption that temperature will remain level until 2032, and what happens then?

Robert Grumbine
October 13, 2016 2:25 pm

Schrumpf and Ferdinand make some valid points above, which I’ll not comment further about.
The main article, really doesn’t show what it thinks it does. Some things to look at:
* You’ve ignored the fact that both temperature and CO2 respond to a third variable (Sun)
* Does the answer change if the period is changed? 1998 was quite a remarkable outlier. If the start/end points are moved by 10 years, do your answers change?
* 24 years is a very peculiar time span to look at for a climate time series. What happens to your answer if the period is made 20 years, or 30 years instead?
* What point of science dictates your choice of time span rather than to use the entire period for which monthly data are available?
* ‘normalized’? Why not use ppm and K for your analysis? They’re much more physical. The ‘normalization’ process itself could be producing the timing of the peaks.
*From your description, you’re using only those 12 data points for your analysis of T vs. CO2. And have not looked at all at the variances in the monthly estimates.
* More informative will be to look at the monthly anomalies of T and CO2 (un-normalized) through the period of record.
A point mentioned by Ferdinand is important. Time scale matters. Nobody expects the climate system to respond instantaneously to changes in CO2, or anything else. Even if it did, you couldn’t tell instantly because there’s so much natural variability.
If you examine glacial ice at short time scales, it is absolutely a solid. You can even send acoustic shear waves through it, one of the hallmarks of a solid. But that’s looking at short time scales (seconds to hours). Over long time scales (years to decades and up), it is a fluid. You see that in the fact that ice flows downhill, flows out in to ice shelves, and the front of the ice shelf advances through time.
The mathematical analysis which would let you address this issue is spectral coherence, where you’ll find the phase (lead/lag) relationship, as well as the correlation, in terms of the time scales. Where there is no coherence, phase relationships are meaningless. Very likely this is where your data are. But at decadal scales you might see something else.

Reply to  Robert Grumbine
October 13, 2016 4:17 pm

Co2 changes to temperatures. 1998 wasn’t unusual.. plotting the temperature and co2 anomolies per year instead of the total in the air and temperature gives a very clear picture that over the last 60 years while there has been a slight warming trend, there is no reason for co2 to track with downward movements in temperature as co2 production increased. The warming trend is evident in the graph where the total co2 is given and temperature is given in year to year tenths of a degree. Co2 anomolies and temperature track every year (except for changes in the last 5 via NOAA ) which is a different graph that isn’t published. 1999 wasn’t a variation. Neither were the years that followed. Every year since 1998 the co2 levels did not reach the same peak even though during that time period production of anthropogenic co2 increased a billion metric tons year each additional year. Only this year with an el nino did the co2 levels exceed 1998, and from what I can see, it was temperature. Co2 played no role in controlling temperature.
Further, co2 anomolies track cosmic ray and solar activity reaching a peak then subsiding during the solar cycle. It’s like clock work. The only thing the AGW crowd has proven is that it’s slightly warmer and not due to co2, and certainly not dramatically .
What’s making it warmer ? I am uncertain. However, I can rule co2 out. And the scientific community will too. Whether it it’s colder or not won’t be the determining factor.
In fact Ferdinand brought that up that it was a variation from 1998 to 1999, so I did all the years. Co2 varies with temperature. It’d be a lot warmer if it were the other way around. That I am also certain of. We wouldn’t be having this discussion.

dikranmarsupial
Reply to  Robert Grumbine
October 14, 2016 1:24 am

Also if the analysis uses the northern hemisphere temperature anomalies, any effect the seasonal variation in CO2 on temperature will already have been deleted from the temperature data as the anomaly for January is the anomaly relative to the January mean, the anomaly for February is the anomaly relative to the February mean, etc. So the analysis is incorrect from the outset, even without all of the other concerns.

Reply to  dikranmarsupial
October 14, 2016 9:17 am

Indeed, if you plot the real CO2 (and δ13C) changes over the seasons, the change at ground level is quite high and more smoothed at the 3400 m heigth of Mauna Loa, here plotted over two periods, :
http://www.ferdinand-engelbeen.be/klimaat/klim_img/seasonal_CO2_MLO_BRW.jpg
It looks like that the more recent biological carbon cycle increased somewhat, but that is barely visible at Mauna Loa. Moreover, the peak difference at Barrow is in August, not in May, where the anomaly should get around -2 ppmv in that month… I wonder what the anomaly percentages in Figure 2 in real life figures are…

David Bennett Laing
Reply to  dikranmarsupial
October 17, 2016 8:53 am

dikranmarsupial: On the NOAA website https://www.ncdc.noaa.gov/cag/time-series/global, at the top, it clearly states that the anomalies are “with respect to the 20th century average.” Below, the user is given various choices of how to display the monthly record. As a matter of fact, though, my graph would have given substantially the same information as it did anyway if the temperature anomalies had, indeed, been deviations from monthly averages over a certain base interval.

David Bennett Laing
Reply to  dikranmarsupial
October 17, 2016 10:04 am

dikranmarsupial: Sorry. I just clarified with NASA that you are quite right, that any monthly anomaly is a departure relative to the normal value for that particular month over the base period. This is actually better than I thought it was for my purposes, because it shows the maximum and minimum variabilities for temperature much more clearly than it would have if the average to which it referred were a simple mean over a base period. Thanks!

dikranmarsupial
Reply to  dikranmarsupial
October 18, 2016 6:08 am

David, no it couldn’t be worse for your analysis because most of the effect of the seasonal variation in CO2 would be in the monthly means that are subtracted off to compute the anomalies. The anomaly doesn’t tell you anything at all about the effect of seasonal variations of CO2 on seasonal variations on temperature. What you see in the graph is the difference in the average seasonal temperature over the period of interest and the average seasonal temperature variation over the baseline period. There is no reason to think that is caused by some change in the seasonal variability in CO2.

David Bennett Laing
Reply to  dikranmarsupial
October 19, 2016 7:03 pm

dikranmarsupial: I think I see, now, what you’re driving at. Because the temperature anomalies during the analysis period are departures from averaged monthly values during the 20th century base period, you’re saying that any seasonal effect of CO2, or any other influential factor, on temperature variation would have been removed by the averaging process, and therefore it would not show up in my graph. I think that if that were, in fact the case, then the temperature anomaly curve in the graph would not have shown such clear seasonality, peaking strongly in March, which is counterintuitive. Why March, and not July, for example? The fact that ozone depletion also peaks in March, and is so well correlated with temperature anomaly, suggests that it, rather than variation in CO2 concentration or high Sun angle, is likely the main driver of temperature anomaly. Nonetheless, I will check the average monthly record of temperature (not anomalies) over the 20th century to see whether the peak of CO2 concentration in May has any kind of seasonal effect. If so, I would expect it to take the form of an early broadening of the seasonal peak from its expected maximum in July back toward May, and I will post the result in this forum. In any case, I want to thank you sincerely for being my smartest and toughest critic on this, and for forcing me to think carefully about my analysis.

David Bennett Laing
Reply to  dikranmarsupial
October 23, 2016 2:21 pm

dikranmarsupial: I did a graph of NOAA’s baseline average monthly global temperature values for the 20th century used to compute monthly temperature values, and it turned out to be a simple sinusoidal curve with a symmetrical peak in July (several attempts to upload the graphic failed, but the monthly values are 12.0, 12.1, 12.7, 13.7, 14.8, 15.5, 15.8, 15.6, 15.0, 14.0, 12.9, 12.2). No effects other than the obvious one of Sun angle are evident in the graph, which suggests that 1) there appears to be no significant long term effect by any forcing agent on baseline monthly temperature in the northern hemisphere, and 2) my 1975 to 1998 graph succeeded in selecting short term variabilities in the three variables, and therefore gives a realistic picture of the effects of CO2 and ozone depletion on monthly temperature anomalies.

ScottM
Reply to  Robert Grumbine
October 15, 2016 10:17 pm

I suspect normalization of the temperature anomaly difference was done to hide the fact that the 0 to 100% range actually represents a very small difference range. There is enough overlap between the base period and the chosen observation period that I would be surprised if this amounted to more than a swing on the order of 0.1 K. More evidence of slayer-style creative accounting.

Robert Grumbine
Reply to  ScottM
October 16, 2016 7:42 am

The normalization itself varies seasonally, it turns out. So these curves themselves say almost nothing about correlation and phase between T and CO2. They say at least as much about what times of year have the least variation in those variables. And science has long known that T depends on more than just CO2, and CO2 depends on more than just T.

David Bennett Laing
Reply to  ScottM
October 17, 2016 8:58 am

ScottM: No, I normalized simply in order to render the three curves at the same scale. The important thing is the shapes of the curves, where they peak and trough and what they do in between (deflections, etc.). Sorry, but I am not a “slayer'” (whatever that may be). I’m simply asking questions.

David Bennett Laing
Reply to  Robert Grumbine
October 17, 2016 8:41 am

Robert Grumbine: In answer to your points,
1) Right. I was only asking the question “Can variations in atmospheric CO2 concentration cause variations in temperature?” and the second question “Can ozone depletion be considered a viable candidate for a cause of global warming?” The answers to these two questions were no and yes, respectively.
2) through 4) The interval 1975 to 1998 that I chose was the time when 1) temperature shot up at a fast rate (i.e., something important was happening then) and 2) when anthropogenic CFCs were massively introduced to the atmosphere. The evidence might have been rather ambiguous if I had chosen a different analysis period, and my conclusions would have been more tentative.
4) I normalized (put the highest value of each data set at 100% and the lowest at 0%) so that I could compare the three curves on the same graph rather than complicate matters by providing a different scale for each variable. This transform did not in any way affect the shapes of the curves.
5), 6), and 7) Correct. I averaged the monthly values in order to remove trends and other variations so that I could arrive at a general conclusion of how, on average, the curves behaved, month-by-month, during the time interval chosen.
In Nature, including the atmosphere, responses to stimuli are usually immediate. Otherwise, a memory storage component is introduced, which only complicates the system in question.
When rheidity (as that of ice) is introduced, naturally response times are lengthened, but the atmosphere has very low rheidity, so response times to stimuli are usually immediate.
Mathematical manipulations of compiled data are intriguing and sometimes even compelling, but they can very often lead to false conclusions, as I have found over my 55 plus years of doing science. For this reason, I tend to use mathematics and theory as tools to help explain the configuration of real data when there is doubt as to what they really mean. A case in point is my taking monthly averages of the three data sets to remove trends and nonseasonal variabilities in this analysis in order to focus on two particular questions of interest.

Robert Grumbine
Reply to  David Bennett Laing
October 17, 2016 4:57 pm

1) You selected a cherry-picked time, and did nothing to see whether your cherry-pick affected your answers. Further, it’s a time you consider to be unusual (that rapid spike) in temperature, which immediately makes it suspect as to being representative of climate.
Your transform of the data affects your answer. Whether it’s standard in other fields for other reasons is irrelevant. Having performed multiple transformations, it’s on you to demonstrate, not merely assert, that the transforms do not affect your results.
Since your transform is itself time-varying, it certainly affects your results.
It’s ironic that you talk so negatively about ‘theory’, this analysis is laced with theory — not least the theory that your analysis is representing the climate system. Further, the problematic issue Schrumpf raised and which you don’t see. It is only by theory that you can select between 2 month lead vs. 10 month lag. While claiming no theory on your part, you apply one here.
Don’t see what relevance your claim of 55 years in science has to anything. Not least because you’re quite hard to find in any of the abstract databases. Doing science for a half century normally leaves more tracks than that.
In any case, I’m minded strongly of Feynman’s comment about doing science. The easiest person to fool is yourself, so you have an obligation to bend over backwards (his term) to avoid fooling yourself. In this case, you should be doing work like checking how your answers change with different (and longer) time periods, without your multiple transforms, and so forth.
On the other hand, since I see you reject photons, which were also a central part of his professional work, I suppose there’s no surprise you reject his principle here, too.

David Bennett Laing
Reply to  David Bennett Laing
October 21, 2016 7:37 am

Robert Grumbine: I’ll gladly answer your objections because responding to sharp criticism helps me to refine my thinking on the matter.
First, yes, I did “cherry pick” the analysis period for two reasons: first because it represented the most dramatic increase in temperature in recent time, and therefore I concluded that “something important was happening then,” so that fact would make 1975 to 1998 an important time to look at. Second, I wanted to test Peter Ward’s contention that anthropogenic chlorine was an important player in global warming through its thinning effect on the ozone layer. Thus, my cherry-picking did, indeed, affect my answers, and I hope that you’ll agree that because of these two reasons, it was to good effect. As for the period being “representative of climate,” I regard that as irrelevant. I specifically eliminated long-term effects from the analysis by rendering the temperature anomalies as monthly averages. I was only interested in the question, “Can month-to-month variations in atmospheric CO2 concentration have a significant effect on temperature in the northern hemisphere?” By showing that CO2 variation peaked in May, whereas temperature anomalies peaked in March, two months earlier, I think I answered that question in the negative, except for a very minor possible effect in June.
No, my objectives in transforming the raw data were to focus on the information therein in the most efficient manner, specifically 1) to remove long term effects from the analysis so as to concentrate on the causality question above, and 2) to render the three curves represented at the same scale on a single comparison graph as percentages instead of providing a separate scale for each curve, which I felt would be unnecessarily confusing (perhaps I was wrong in assuming this!) These transformations did nothing whatever to change the information contained in the raw data. I hope that you find this is an adequate defense of my methodology.
No, the time-varying aspect of my analysis doesn’t affect my results at all; in fact it reveals them in that it clearly shows that CO2 could not influence temperature because its peak concentration occurs two months before the peak concentration in the temperature anomaly.
Again, no. What I object to in theory is when people come to some general conclusion about reality when they lack the solid data from the real world to back it up. Such is the case with Arrhenius’s 1896 geometric/arithmetic argument concerning CO2 and temperature. In 1900, Angstrom tested it for him and came up with essentially negative results. The theory has never been tested against hard data since except for my northern hemisphere analysis here, which evidently shows, on the basis of real data from the Earth system, that Angstrom was right, after all.
Frankly, I’m surprised that you succeeded in finding me at all in abstract databases. I am a polymath and a synthetic scientist (as opposed to an analytic one, although this is, indeed, an analysis), with a broad range of interests, and the normal peer review publishing process detests polymaths. I realized this about myself fairly early in my career (I also have Asperger’s syndrome, which actually explains a lot), and so I made a conscious decision not to finish my PhD work and to be content instead with my masters degree from Harvard rather than fight the peer-review system that likes narrowly-focused studies that are in line with accepted dogma, and I’ve not regretted the decision. Therefore, instead of finding me by journal articles, you’re more likely to find me under books, because independent publishing gives me a good opportunity to “go where no man should presume to go.” On the one hand, this should raise a big red flag in that no one but me provides a check on my ideas, but that’s not quite true. As an Earth systems scientist, I work from two principles: 1) that I should always base my conclusions on an Occam’s razor interpretation of real data from the Earth system, and 2) that connecting the dots is a powerful tool. In other words, if any of my conclusions is consistent with a broad range of real Earth data, then it’s probably correct. I then present my ideas on fora, such as this, or send them to key people in the discipline for their comments, or both. I pay close attention to feedback I get from both sources, and that keeps me honest (I hope!)
You’ll be thrilled to know that I’m taking Feynman’s good advice and subjecting everything I do to the hairy eyeball. I always test everything I come out with with the question, “Does this make sense in terms of all that I have already learned from Earth and from other people’s data-based research on Earth?” If yes, I proceed to seek out other hairy eyeballs, such as yours, to ferret out possible flaws in my methodology and conclusions, so thanks!

ScottM
Reply to  David Bennett Laing
October 24, 2016 9:46 am

David Bennett Laing: “First, yes, I did “cherry pick” the analysis period for two reasons: first because it represented the most dramatic increase in temperature in recent time, and therefore I concluded that “something important was happening then,” so that fact would make 1975 to 1998 an important time to look at.”
You realize you have just described the Texas Sharpshooter Fallacy, don’t you?

Nelson Smith
October 13, 2016 3:12 pm

I cannot understand why March would be the month with highest northern hemisphere temperature anomaly. Seems like it should be July or August

dikranmarsupial
Reply to  Nelson Smith
October 14, 2016 1:29 am

The analysis uses the northern hemisphere anomaly temperature dataset, which already has the normal seasonal cycle subtracted from it. Basically you pick a baseline period (which I think may be the entire 20th century) and compute the mean temperature for each month of the year. You then subtract those monthly means from the corresponding months in the dataset to give you the anomaly. However if you pick a period that is not exactly the same as the baseline period, then you will get a non-zero signal. The “anomaly” that is plotted just shows how the mean seasonal variation over period of interest differed slightly from the mean seasonal variation over the whole baseline period, and has nothing whatsoever to do with the seasonal variation of CO2. This of course immediately invalidates the the analysis.

Nelson Smith
Reply to  dikranmarsupial
October 14, 2016 6:37 am

thanks for this answer. I agree with you the analysis seems wrong if anomaly is calculated this way, although I still believe evidence is strong for very low sensitivity with zero or negative feedback

dikranmarsupial
Reply to  dikranmarsupial
October 14, 2016 7:26 am

I disagree, paleoclimate (e.g. PETM) for a start is very difficult to explain if climate sensitivity is very low, I don’t see any strong reason not to accept the IPCC range, but the key point is that this analysis is fundamentally flawed, due to the use of the anomalies, as well as for the other reasons outlined above by myself and others.

Reply to  dikranmarsupial
October 14, 2016 8:55 am

Dikran,
The PETM is probably caused by a huge meteor impact, which increased tempertatures and CH4/CO2 levels due to burning forests and increased seawater temperatures, direct release of clathrates at the impact place and increased volcanic activity. One can’t tell from that impact that CO2 was the main driver for the temperature changes… See:
https://wattsupwiththat.com/2016/10/13/study-extraterrestrial-impact-preceded-ancient-global-warming-event/
Have a look at the end of the previous interglacial (the Eemian): CO2 remained high while temperatures (and CH4 levels) dropped to a new minimum and ice sheets did grow to a new maximum. Only then CO2 started to drop some 40 ppmv. That had no clear influence on temperature or ice sheet growth. The uncertain relative timing doesn’t play a role in this case as CH4, CO2 and N2O (a proxy for global ice sheet volume) are measrued in the gas phase and CH4 directly follows the δ18O changes (a proxy for SH ocean temperature) in the ice. Here for the Vostok ice sheet:
http://www.ferdinand-engelbeen.be/klimaat/klim_img/eemian.gif
Which shows that the impact of CO2 on temperature and ice sheet formation is minimal…

dikranmarsupial
Reply to  dikranmarsupial
October 14, 2016 9:37 am

Ferdinand, I think it is a bit of a leap to say that the “PETM is probably caused by a huge meteor impact” given the abstract of the paper says “…indicating that an extraterrestrial impact occurred during the carbon isotope excursion at the P-E boundary.” (emphasis mine), i.e. the paper doesn’t say the impact was the cause of the CO2 excursion, indeed the actual paper doesn’t seem to say anything much about the cause of the CO2 excursion it at all. The CO2 excursion apparently took place over millenia, rather than suddenly, which also argues against a meteor having a big impact (if you will excuse the pun ;o). As far as I can see there is very little in the earlier WUWT article to support the idea that the rise in temperature during the PETM was cause by anything other than an excursion of GHGs, which is hard to explain if climate sensitivity is very low.
I’ll look into the Emian episode you mention, however CO2 is not the only thing that affects climate, so we can’t draw strong conclusions from a single paleoclimate event in isolation unless we know that “all things were otherwise equal” on that occasion, we want the best explanatory theory for all that we see in paleoclimate, and at the moment AFAICS CO2 has a substantial role to play (mostly as a positive feedback).

Reply to  dikranmarsupial
October 14, 2016 11:36 am

Dikran,
It seems that most of the change was from seabed methane, probably from a huge meteor impact in an ocean.
http://www.pnas.org/content/113/28/7739.abstract
At current low methane emissions, the half life time to convert it into CO2 is only 10 years, but that depends of the amount of OH radicals in the upper troposhere, which are limited in production (by UV). Thus huge quantities of CH4 released at once need much more time to get destroyed.
CH4 is a much more potent GHG than CO2 and may be the main cause of the temperature increase.
Some beg to differ about the speed of the change:
http://news.rutgers.edu/research-news/new-finding-shows-climate-change-can-happen-geological-instant/20131003#.WAEj74Kt9Ey

Morgan Schaller and James Wright contend that following a doubling in carbon dioxide levels, the surface of the ocean turned acidic over a period of weeks or months and global temperatures rose by 5 degrees centigrade – all in the space of about 13 years.

That also looks like a huge meteor impact somewhere in one of the oceans (and therefore no impact crater visible on land)…

Reply to  dikranmarsupial
October 14, 2016 11:59 am

Dikran,
In addition, the article itself at:
http://www.pnas.org/content/110/40/15908.full?sid=58b79a3f-8a05-485b-8051-481809c87076
Shows the estimated quantities of low-13C released:

Our observations and revised release rate are consistent with an atmospheric perturbation of 3,000-gigatons of carbon (GtC).

Wow! That is about eight times all what humans have burnt in the past 166 years, released in less than 10 years…
Remains to be found what the meteor impact itself was on earth’s temperatures, it seems quite impossible to me that temperatures did go up in less than a decade even not from a doubling of CO2 (or even extreme quantities of methane) in such a short time span, as the oceans’ inertia is much too large. The opposite may be more appropriate: the impact may have heated the oceans instantly high enough to give the CH4 and CO2 releases…

Chimp
Reply to  dikranmarsupial
October 14, 2016 12:09 pm

Ferdinand Engelbeen
October 14, 2016 at 11:36 am
Has the surface of any large ocean area ever actually been acidic?

dikranmarsupial
Reply to  dikranmarsupial
October 14, 2016 12:50 pm

Ferdinand, that appears to be the very paper that was criticised in the comment paper for which I provided a link, showing it couldn’t have taken place over a decade or so, but took millenia. I’m no expert on this, but the existence of Zeebe et al suggests we should be extremely cautious about attributing PETM to a metor strike (as indeed the authors are in the new paper, as I pointed out).

Reply to  dikranmarsupial
October 14, 2016 1:44 pm

Chimp,
Not that I know and normally never, even if you burn lots of coal and oil and gas…
But 3000 GtC as extra CO2 in less than a decade, that is something different.
3000 GtC instantly released means an instantly 3.75 fold increase of the current 800 GtC in the atmosphere or 400 ppmv increased to 1500 ppmv.
I am not sure about what pH drop that gives in the surface, as most pH calculations of that period (-0.3 pH unit) still assume a long period (~10 kyear) of release, which makes it possible to have a total mix with the whole ocean depth, while a sudden release only has an immediate impact on the surface layer (average 100 m depth). I think that the surface layer may have been slightly acidic for a short (a few decades) period.

Reply to  dikranmarsupial
October 14, 2016 2:13 pm

Dikran,
Zeebe follows the “models show” lead, that is based on no-impact, GHGs do it all. But now is proven that there was a huge impact, which may have triggered not only a clathrate release (and partly immediate burning), + forest fires (with reduced δ13C compared to methane) plus a heating up of the oceans if the impact was large enough…
On the other hand assuming that the sediment layers were yearly, based on oxygen isotope changes is a little triggy, as there may be other reccurent periods which can trigger similar changes: the solar cycle which changes rain patterns / river discharge in mid-latitudes, the ~60 year ocean cycles (PDO, NAO), the ~1000-1200 climate cycle (Roman period – MWP – current warm period)…
Without detailed confirmation of the age structure it remains controversial…
Will certainly be followed…

Chimp
Reply to  dikranmarsupial
October 14, 2016 2:35 pm

dikranmarsupial
October 14, 2016 at 7:26 am
Observed reality, ie ECS of ~1.0 to 2.0 degrees C per doubling of CO2 concentraion, overlaps with the unscientifically derived IPCC range of 1.5 to 4.5 C, but just barely.

dikranmarsupial
Reply to  dikranmarsupial
October 15, 2016 12:46 am

“which may have triggered not only a clathrate release…”
I am happy to agree with may have triggered a clathrate release, just not that it probably caused the PETM. For me the meteor is one of many plausible hypotheses about the cause of the PETM, and I don’t want to jump to conclusions.
Regarding models, they are an embodiment of our best knowledge of the physics. If you can make a physical model that explains the observations, your hypothesis is better than a hypothesis for which you can’t construct a physical model, as it shows that your hypothesis fits in with our existing physical knowledge and so this shouldn’t be ignored. The other thing you can do with a physical model is to move on from correllation by testing whether the proposed mechanism can explain the magnitude of the effect.
My intuition on the direct heating is that much of the energy of the impact would be quickly radiated away (firstly by vapourising the water in the immediate area of the impact) and the thermal conductivity of water isn’t high enough to spread the heat through the oceans, rather than to boil it locally. It is an idea worth considering, but I would want to see the physics demonstrated first.
Interesting collection of papers though,including the authors response to Zeebe et al.

Reply to  dikranmarsupial
October 15, 2016 4:43 am

Dikran,
Indeed the response of the authors of the rapid release is worth reading too, as they show the flaws in the model(s) Zeebe e.a. used:
https://www.ncbi.nlm.nih.gov/pmc/articles/PMC3970519/
Will certainly be followed by more discussion and hopefully more constraints by new discoveries…

Nelson Smith
Reply to  dikranmarsupial
October 16, 2016 6:15 am

thinking about this paper some more, it would be interesting to see same graph during the pause We should see lower zone depletion and lower temperature peaks, still in phase if Mr. Laing’s thesis is true. Am I right?

David Bennett Laing
Reply to  dikranmarsupial
October 17, 2016 10:27 am

dikranmarsupial: I don’t think it invalidates my analysis at all. As you yourself pointed out, these anomalies are in reference to the normal monthly values over the base period, which is the 20th century. My analysis therefore shows a curve of relative sensitivity of temperature, which has its peak in March and a small uptick in June. The maximum concentration of CO2 over the analysis period comes in May, and is therefore two months later than the month (March) in which temperature is experiencing its maximum deviation from the average for that month over the base period. This implies that CO2 can’t be causing this maximum departure, but that ozone depletion could. This makes a lot better sense that if the anomalies were deviations of T from an annual mean.

David Bennett Laing
Reply to  dikranmarsupial
October 17, 2016 11:28 am

Ferdinand Engelbeen: Notice that In the graph you present here, CO2 goes up following temperature, which one would expect from the exsolution of CO2 from a warmed ocean, but that it goes down again as temperature again plunges, this time consistent with solution of CO2 by a cooler ocean. Otherwise, CO2 has very little correlation with temperature.

David Bennett Laing
Reply to  dikranmarsupial
October 17, 2016 11:52 am

dikranmarsupial (Oct 13, 9:37): What’s wrong with the interpretation that the PETM temperature increase was caused not by carbon dioxide but by ozone depletion by chlorine and bromine emitted during the massive eruption of non-explosive, rift-related basaltic lava due to plate tectonic activity between Greenland and Scandinavia at the time? This would require subaerial eruption, of course, but that would be a possibility, considering the present subaerial exposure of Iceland.

David Bennett Laing
Reply to  Nelson Smith
October 17, 2016 9:42 am

Nelson Smith: The graph shows that March is the month during which the greatest effect on global temperature is felt (i.e., the greatest variation from March norms), and that is a very good reason to consider ozone depletion as the cause of that maximum variation.

Chimp
October 14, 2016 2:22 pm

Ferdinand Engelbeen
October 14, 2016 at 1:44 pm
Thanks.
Benthic forams suffered a major extinction at the PETM, but surface dwelling shelly plankton, dunno.
As for coccoliths, “calcification and net primary production in the coccolithophore species Emiliania huxleyi are significantly increased by high CO2 partial pressures”:
http://science.sciencemag.org/content/320/5874/336
Ocean acidification in response to rising atmospheric CO2 partial pressures is widely expected to reduce calcification by marine organisms. From the mid-Mesozoic, coccolithophores have been major calcium carbonate producers in the world’s oceans, today accounting for about a third of the total marine CaCO3 production. Here, we present laboratory evidence that calcification and net primary production in the coccolithophore species Emiliania huxleyi are significantly increased by high CO2 partial pressures. Field evidence from the deep ocean is consistent with these laboratory conclusions, indicating that over the past 220 years there has been a 40% increase in average coccolith mass. Our findings show that coccolithophores are already responding and will probably continue to respond to rising atmospheric CO2 partial pressures, which has important implications for biogeochemical modeling of future oceans and climate.

Chimp
Reply to  Chimp
October 14, 2016 2:23 pm

Also wonder about the combo of sudden CH4 and CO2 increases on ocean pH.

Reply to  Chimp
October 14, 2016 3:27 pm

Chimp,
CH4 has no influence on pH, but is converted into CO2 in the higher troposphere and in part by bacteria in the oceans… With a huge impact, lots of clathrates may have been burned immediately…

Chimp
Reply to  Chimp
October 14, 2016 3:43 pm

Thanks.
Some think that if sudden GHG rise accounts for the PETM, methane is a likelier culprit than carbon dioxide.

Reply to  Chimp
October 14, 2016 3:22 pm

Chimp,
Ah the Ehux, responsible for the nice white cliffs of Dover and most of the South England underground and similar in French Normandy…
They thrived in much higher CO2 levels during the Cretaceous…
Nice pages of Ehux at: http://www.noc.soton.ac.uk/soes/staff/tt/eh/

David Bennett Laing
Reply to  Chimp
October 17, 2016 12:08 pm

Chimp: I find it strange that no one has implicated the NOx and SO2 that emerges from smokestacks and tailpipes along with CO2 in ocean acidification. CO2 is buffered, meaning that its acidifying effect is minimal, whereas these other oxides are not buffered, which gives them correspondingly greater acidifying power. Also, I understand that ocean acidification is more of a problem near continents than it is in the open ocean, which makes the land-based, anthropogenic nitrogen and sulfur oxides doubly suspect, yet it is never mentioned. Why is this?

Reply to  David Bennett Laing
October 19, 2016 4:19 am

They’re not mentioned because they don’t have the effect you suggest. Sulphate ions are a conserved species in seawater, meaning that it is at a constant concentration in the ocean. Nitrate is at such a low concentration that it would have no effect on ocean pH.

David Bennett Laing
Reply to  David Bennett Laing
October 19, 2016 4:32 am

Phil.: How do you know this? Yes, sulfate is a conserved species, but this is sulfur dioxide, and the conservation of sulfate in seawater of itself doesn’t mean that the local addition of more sulfur dioxide won’t have a short-term effect, which will, in time, be reduced by the sulfate conservation effect. The same goes for nitrate. I see no sense at all in the statement that “Nitrate is at such a low concentration that it would have no effect on ocean pH.” If anything, I would expect that its low concentration in seawater would mean that added NOx would have even more of an effect.

Reply to  David Bennett Laing
October 19, 2016 9:01 am

David Bennett Laing October 19, 2016 at 4:32 am
Phil.: How do you know this? Yes, sulfate is a conserved species, but this is sulfur dioxide, and the conservation of sulfate in seawater of itself doesn’t mean that the local addition of more sulfur dioxide won’t have a short-term effect, which will, in time, be reduced by the sulfate conservation effect.

SO2 (or more likely SO3 by the time it reaches the ocean) will react with water to form sulphate ions instantly and the solubility product of species like gypsum would precipitate out. When seawater infiltrates freshwater gypsum precipitates.
The same goes for nitrate. I see no sense at all in the statement that “Nitrate is at such a low concentration that it would have no effect on ocean pH.” If anything, I would expect that its low concentration in seawater would mean that added NOx would have even more of an effect.
I take it that you have no understanding of chemistry? The principle process which controls the pH of seawater is the equilibrium between bicarbonate and carbonate, nitrate is less than 50 micromole/kg compared with ~2000 micromole/kg of bicarbonate.

David Bennett Laing
Reply to  David Bennett Laing
October 21, 2016 5:52 am

Phil.: I take it that you have a bit of trouble with civil discourse. I have always assumed that such ad-hominem remarks are a certain sign of someone who is defensive and unsure of his facts. Both of your arguments are theoretical and based on equilibrium conditions. My question is, could there be a local, kinetic effect of these oxides on marine life before such equilibrium conditions as you mention could be established.

Robert Grumbine
Reply to  David Bennett Laing
October 21, 2016 7:36 am

The chemical reaction time is order microseconds even for the (buffered) carbonate system, too fast for your stated concerns to apply.
That CO2 is buffered in the ocean does not mean that its acidification effects are minimal. Merely that you need more CO2 to get a given amount of acidification. The ratio is a lab result. Look it up before dismissing it.
CO2 is also emitted in far greater tonnage than SO2 or NOx. Find that ratio and compare with the chemistry, rather than dismiss these items that disagree with your wishes as ‘theory’.
see also Feynman regarding your obligation to not fool yourself. You’re spending zero effort to avoid that.

David Bennett Laing
Reply to  David Bennett Laing
October 21, 2016 7:57 am

Robert Grumbine: Au contraire, I take Feynman’s admonition very seriously. In the interest of that, can you please identify for me the specific references that you refer to on this? Tx.

Robert Grumbine
Reply to  David Bennett Laing
October 21, 2016 8:47 am

David: If you took Feynman’s admonition seriously, you would (for instance) have looked up the chemistry of oceanic CO2 buffering before dismissing CO2 as a source of ocean acidification.
Ref: Surely You’re Joking: Adventures of a Curious Character.

David Bennett Laing
Reply to  David Bennett Laing
October 21, 2016 10:13 am

Robert Grumbine: I’m quite familiar with the ocean carbonate buffer system and how it works, thank you (BTW, why are you so quick to use ad-hominem remarks?; they’re usually a sign of insecurity in the person who asks them). I was simply asking the question as to whether SOx and NOx might also have some effect, and pointing out that the question hasn’t, to my knowledge, been addressed in the literature.

Robert Grumbine
Reply to  David Bennett Laing
October 21, 2016 12:28 pm

It isn’t ad hominem to observe that you don’t understand the chemistry. That’s just reality — you could not have had the questions you did if you understood the chemistry, nor could you have made the assertions you did.
Nor is it ad hom to observe that you aren’t following Feynman’s dictum given that you conflate you not being aware of what’s in the literature with what’s true or not. Your not being aware merely means that you have work to do to obey the dictum.

October 18, 2016 9:17 am

Rainwater condensing from cloud formations dissolves CO2 to form weak carbonic acid, it always has and it always will. It has been responsible for stalactites and stalagmites in caves over thousands of years. Rainwater of course is initially pure water in which there are few ionic species; seawater however is quite different and contains many soluble cations and anions. Sodium and magnesium, which will form stable crystalline solid bicarbonates, are present in abundance. Carbon dioxide in seawater yields salts such as sodium carbonate which are soluble in water and are hydrolysed in solution thus:
Na2CO3 + H2O = NaHCO3 + NaOH
and their solutions are in fact alkaline. For the anti carbon green warmist lobby and the BBC to pronounce that the simple addition of carbonic acid or dissolution of CO2 in seawater will make it acidic is nonsense and he clearly does not understand the complex ionic system pertaining in the oceans. The capacity of seawater to buffer pH changes is well known and its pH always remains in range 7.5 to 8.4 which is alkaline.

Reply to  chemengrls
October 18, 2016 10:30 am

+1 on that.

Editor
October 19, 2016 11:07 am

David Bennett Laing October 12, 2016 at 4:01 pm

Willis, this is a THIRD attempt to reply to your latest post! I now see what you’re driving at. First, my graph doesn’t take long-term effects into account, focusing instead on immediate ones, as did, as far as I know, Svante Arrhenius, Knut Angstrom, and more recently, Suki Manabe. Second, again, as far as I know, you’re the first to suggest that there’s a difference between short- and long-term effects, and the validity of that really needs to be established with hard data before my analysis can be reasonably faulted for leaving it out.

David, thanks kindly for your reply.
As to the short- and long-term relationship of CO2 and temperature, both of them have been discussed for years. The short-term effect is the one you discuss above—annual termperature-driven variations in the biosphere cause following and corresponding changes in CO2 level. These annual changes in atmospheric CO2 concentrations are on the order of a percent of the CO2 level or so. That effect we have lots of evidence for.
On the other hand, there is the long-term effect of CO2. This involves a much larger change in CO2 levels, such as the ~ 40% rise in CO2 levels since pre-industrial times. There are two parts to this long-term effect. We have what you call “hard data” for one, but not for the other.
The greenhouse hypothesis goes like this:
1. An increase in CO2 or other greenhouse gas increases the ongoing atmospheric absorption of upwelling longwave radiation leaving the surface. Since energy is neither created nor destroyed, that absorbed energy is then radiated by the atmosphere. About half of that radiation goes downwards towards the surface.
2. This small (~1%) increase in surface radiative forcing will then perforce increase the surface temperature.
As I said, we have hard evidence for #1, the increased atmospheric absorption of upwelling radiation. This well-understood effect has a clear basis in physics. It can be measured from satellites, and is accurately emulated by programs like MODTRAN.
On the other hand, we have almost no hard evidence for #2, the response of temperature to a less than !% change in total surface forcing at a time when the system is already in general long-term thermal steady-state (e.g. a variation of global surface temperature of only ± 0.3°C over the 20th century).
I ascribe this to the fact that the temperature of the earth is set by the physics of wind, wave, and water, and not by the forcing. The climate systems responds to such small change by slightly increasing the albedo, and by slightly increasing the surface cooling from thunderstorms and dust devils and other emergent climate phenomena. This response of the climate system is temperature-based and not forcing-based—the various phenomena emerge when temperature exceeds certain limits, not when forcing exceeds certain limits.
And as a result, the system is relatively insensitive to small variations in long-term average forcing.
The surprising fact about the climate is not the change in temperature over the 20th century. The surprise is how tiny that change is, about a tenth of a percent, less than one degree C.
I hope this explains my position.
My best to you, and thanks for your inquiring mind and your interesting post,
w.

Robert Grumbine
Reply to  Willis Eschenbach
October 21, 2016 7:51 am

Just a check: in talking about small % changes in temperature, you’re doing this as a percentage of the Kelvin temperature, right? Current earth average surface temperature being ~288 K.

David Bennett Laing
Reply to  Robert Grumbine
October 21, 2016 8:34 am

Robert Grumbine: I’m using the NOAA database, which is in degrees C, but I’m also using temperature anomalies, and thus deviations from a base value, which could be either K or C and still give the same result. The objective was simply to see whether or not ANY change in monthly atmospheric CO2 concentration could cause ANY change in the curve for monthly temperature anomalies. The absolute value of temperature or CO2 concentration has nothing whatever to do with the analysis.

Robert Grumbine
Reply to  Robert Grumbine
October 21, 2016 8:40 am

David: That is a question to Willis.

David Bennett Laing
October 20, 2016 6:31 pm

Willis,
Thanks! It’s nice to have a rational thinker in our midst to offset all this monkey motion that seems to be prevalent nowadays.
BTW, relative to point #2 in your description of AGW, I’ve seen the same thought expressed time and again, but no one seems to have put it up against the second law of thermodynamics, which, of course, states that a radiant body (and that calls up all sorts of irrelevant thoughts, doesn’t it?) can’t add heat to an object that’s as warm, or warmer, than itself. Now, considering the half of thermal radiation that’s absorbed by CO2 and reradiated back at Earth, it can’t possibly be any warmer than when it was emitted by Earth’s surface, and the CO2 has cooled significantly due to the lapse rate, which is likely to make its radiant output still cooler. Therefore, the CO2 blanket that supposedly warms Earth actually can’t do so, and can only slow the rate of heat loss from the planetary surface. By analogy, a blanket over a person can only prevent heat loss from the underlying person, and can raise that person’s temperature only up to a maximum of 98.6 degrees F. It can’t possibly rise above this limit, unless there is some additional heat source under the blanket with the person. Similarly, Earth’s CO2 “blanket” can’t possibly heat the planet in any significant way. Am I missing something here?

Robert Grumbine
Reply to  David Bennett Laing
October 21, 2016 7:48 am

yes, you’re missing:
the law of conservation of energy
the second law of thermodynamics (the real one, not the verbal shorthand which requires many caveats that you’ve ignored, and which show you why your description doesn’t apply here)
that blankets work by suppressing convection
that the greenhouse effect (whether CO2 or H2O) works by radiative transfer
that photons don’t have a temperature, merely an energy
then again, you’ve already said you don’t believe photons exist, so the list is longer:
quantum mechanics
start with Planck’s derivation of the black body law (to explain observations). The Theory of Heat Radiation by Max Planck is a good place to start.

David Bennett Laing
Reply to  Robert Grumbine
October 21, 2016 8:23 am

Robert Grumbine: Thanks for your input on this!
How, specifically, am I missing the first and second laws of thermodynamics? I invoked the second law in my first sentence above.
Would you please expand on your statement that “blankets work by suppressing convection?” Forgive me, but I had thought that they worked by preventing heat loss, whether by convection or by some other mechanism.
I’m quite well aware that the “greenhouse effect” is supposed to work by radiative transfer, as an even cursory reading of my reply, above, reveals.
Photons and temperature: First, I disagree with A. Einstein that photons are present in EMR (electromagnetic radiation), and therefore I don’t think that EMR contains energy at all. Second, be that as it may, EMR induces resonant vibrations in the molecular bonds of receiving matter (thus generating energy). Hotter sending bodies emit higher-frequency radiation than cooler ones do. In order for there to be a resonant response in receiving matter (in other words, for the EMR to be absorbed), the bonds in that matter must be vibrating at a lower frequency than that of the incident EMR, in other words, the receiving matter must be cooler than the transmitting matter. CO2 in the atmosphere is cooler than Earth’s surface, so no effect should be expected from returning radiation.
You will find an extensive discussion of Planck’s postulate and Planck’s Law, as well as my ideas on the non-existence of photons in EMR (and in space, generally), in my book “The Real World, a Synthesis” on amazon.com.

Robert Grumbine
Reply to  Robert Grumbine
October 21, 2016 9:19 am

That you ‘invoke’ something does not mean that you understand it (e.g. also your statements about CO2, buffering, acidity, …) nor does it mean you invoked it correctly. For a starter on thermodynamics, see, for example, Atkins _Physical Chemistry_. It will also help you with your non-understanding of solution chemistry and quantum mechanics.
That you don’t understand how blankets work is yet another reminder that you don’t take Feynman’s admonition seriously.
But the crux of the problems regarding the laws of thermodynamics and more general errors is that you really, really, are ignoring Feynman’s admonition. In rejecting quantum mechanics, you reject most of 20th century physics. Yet you do not first provide explanation of the observations that QM was developed to explain. Start with the ultraviolet catastrophe (Planck), but also include photoelectric effect (Einstein), and spectral lines (Bohr for atoms, Herzberg for molecules). Thence to technologies which can exist only due to QM, including lasers and semiconductors.
In the mean time, you have an overwhelmingly large problem the instant you say radiation does not carry energy. Energy is transferred only by conduction, convection, and radiation (in normal physics, not, apparently, in yours). Since the earth is surrounded by vacuum, ruling out conduction and convection, the only way for it to gain or lose energy is radiation.
In saying radiation does not carry energy, you’re saying that the sun does not warm the earth. Your theory is falsified every day.
[snip]

David Bennett Laing
Reply to  Robert Grumbine
October 21, 2016 10:18 am

Robert Grumbine: Your angry, negative tone and ad-hominem remarks indicate to me that further communication with you would be non-productive. I will therefore not take the trouble to respond to you further.

Robert Grumbine
Reply to  Robert Grumbine
October 21, 2016 12:35 pm

Any anger merely comes from your mirror.
But, by all means, don’t respond. Hide from criticism, which is another part of Feynman’s bending over backwards to avoid fooling yourself. Doesn’t change the fact that you are flagrantly ignoring a century of science. Nor does it change the fact that your theory of radiation prohibits the sun from warming the earth.

David Bennett Laing
Reply to  Robert Grumbine
October 23, 2016 4:33 pm

Willis: I remain to be convinced that a candle flame can heat Sun. As I understand the situation, absorption in matter occurs by resonance when the vibration of an atomic bond is either 1) of lower intensity but of the same frequency as the incident radiation or 2) of a lower frequency than that of the incident radiation, regardless of intensity. The second law of thermodynamics and common experience holds that a cooler body (candle) cannot transfer heat to a hotter one (Sun). Do you have hard data that refutes either of these statements?

Reply to  David Bennett Laing
October 23, 2016 6:21 pm

David:
An El Nino event occurs when ENSO sea surface temperatures rise by 0,5 – 2.3 deg.C., and this temperature rise causes average global temperatures of, say,14.5 deg. C. to also rise.
Would this be an example?

Reply to  Burl Henry
October 24, 2016 2:21 am

Very unlikely.

Reply to  David Bennett Laing
October 24, 2016 2:27 am

All ‘bodies’ above absolute zero radiate energy according to the Stefan Bolztmann Law ie to the 4th power of absolute T; a candle will radiate and the sun will radiate.

Reply to  David Bennett Laing
October 22, 2016 2:08 pm

David Bennett Laing October 20, 2016 at 6:31 pm

Willis,
Thanks! It’s nice to have a rational thinker in our midst to offset all this monkey motion that seems to be prevalent nowadays.
BTW, relative to point #2 in your description of AGW, I’ve seen the same thought expressed time and again, but no one seems to have put it up against the second law of thermodynamics, which, of course, states that a radiant body (and that calls up all sorts of irrelevant thoughts, doesn’t it?) can’t add heat to an object that’s as warm, or warmer, than itself. Now, considering the half of thermal radiation that’s absorbed by CO2 and reradiated back at Earth, it can’t possibly be any warmer than when it was emitted by Earth’s surface, and the CO2 has cooled significantly due to the lapse rate, which is likely to make its radiant output still cooler. Therefore, the CO2 blanket that supposedly warms Earth actually can’t do so, and can only slow the rate of heat loss from the planetary surface. By analogy, a blanket over a person can only prevent heat loss from the underlying person, and can raise that person’s temperature only up to a maximum of 98.6 degrees F. It can’t possibly rise above this limit, unless there is some additional heat source under the blanket with the person. Similarly, Earth’s CO2 “blanket” can’t possibly heat the planet in any significant way. Am I missing something here?

David and Robert, I fear that you both are conflating heat and energy. Heat is the NET flow of energy, and can only go from hot to cold.
Radiant energy, on the other hand, always exists in two separate and independent flows, one from A to B, and the other from B to A.
FOR EXAMPLE: If you have a sphere radiating energy at 390 W/m2 and another radiating at 300 W/m2, there is a net HEAT flow of 90 W/m2 between the two, going of course from warmer to cooler.
But this is the net of the two physical flows, one of 390 W/m2 and the other of 300 W/m2.
This means, of course, that when you light a candle in the daytime, the sun ends up warmer than it would without the additional energy flowing from the candle to the sun … crazy, I know, but true. When a photon is emitted by a candle, it knows nothing about the temperature of the object it will hit … and when it is absorbed by that object it hits, it will transfer its energy to that object.
Please take a look at a few of my posts on the subject, linked below.
Best regards to you both,
w.
The Steel Greenhouse 2009-11-17

There is a lot of misinformation floating around the web about the greenhouse effect works. It is variously described as a “blanket” that keeps the Earth warm, or a “mirror” that reflects part of the heat back to Earth, or “a pane of glass” that somehow keeps energy from escaping. It is none of these things.

People Living in Glass Planets 2010-11-27

Dr. Judith Curry notes in a posting at her excellent blog Climate Etc. that there are folks out there that claim the poorly named planetary “greenhouse effect” doesn’t exist. And she is right, some folks do think that. I took a shot at explaining that the “greenhouse effect” is a…

The R. W. Wood Experiment 2013-02-06

Pushed by a commenter on another thread, I thought I’d discuss the R. W. Wood experiment, done in 1909. Many people hold that this experiment shows that CO2 absorption and/or back-radiation doesn’t exist, or at least that the poorly named “greenhouse effect” is trivially small. I say it doesn’t show…

Robert Grumbine
October 21, 2016 12:37 pm

(er, the criticism is part of Feynman’s advice, not the hiding)

Editor
October 23, 2016 10:24 pm

David Bennett Laing October 23, 2016 at 4:33 pm

Willis: I remain to be convinced that a candle flame can heat Sun. As I understand the situation, absorption in matter occurs by resonance when the vibration of an atomic bond is either 1) of lower intensity but of the same frequency as the incident radiation or 2) of a lower frequency than that of the incident radiation, regardless of intensity. The second law of thermodynamics and common experience holds that a cooler body (candle) cannot transfer heat to a hotter one (Sun). Do you have hard data that refutes either of these statements?

David, if you truly don’t understand that a candle flame can heat the sun, you desperately need more help than I can give you. It is clear that you still haven’t grasped the distinction between heat and energy. Let me suggest that you grab a good book on introductory thermodynamics. I say this because the nature of the radiative interaction of the two bodies is often used as an example in these texts.
Best regards,
w.

David Bennett Laing
Reply to  Willis Eschenbach
October 24, 2016 8:57 am

Willis: I really don’t need this kind of gratuitous insult to my intelligence from a colleague, thank you very much. In my opinion, you need to do the very same reading that you recommend for me. Be careful, however. It seems that you have quite a penchant for putting your own spin on things, which is not bad for an inquiring mind, such as yours, but remember that all conclusions, especially idiosyncratic ones, always need to be backed up by hard evidence to be credible.

ScottM
Reply to  David Bennett Laing
October 24, 2016 10:09 am

By denying that a candle flame can increase the temperature of the Sun, you are being fooled by scale. The effect is measurable if we change the scale (two objects relatively close in temperature, and both of a size that is significant relative to the distance between them). The equations governing this are smooth; there isn’t a discontinuity where the effect suddently drops to zero when a certain separation is reached. Rather, the increase in temperature slowly diminishes, approaching zero as the distance becomes infinite. Willis Eschenbach is right in this matter.

Reply to  David Bennett Laing
October 24, 2016 10:27 am

David Bennett Laing October 24, 2016 at 8:57 am

Willis: I really don’t need this kind of gratuitous insult to my intelligence from a colleague, thank you very much. In my opinion, you need to do the very same reading that you recommend for me

David, my apologies, you’ve taken my meaning wrong, likely because I was getting exasperated.
I did not mean to insult your intelligence. I merely stated a simple fact. I’ve done my level best to explain to you that if you light a candle during the daytime, it leaves the sun warmer than if you don’t light the candle. It appears that either you’ve ignored the three readings I suggested above, or you don’t understand them, or you’ve read them and disagreed with them. I don’t know, because you have neither commented on them nor asked questions.
In any case, it’s clear I can do no more. Your problem is not your intelligence, as you are obviously a smart guy. Your problem is your education, or more precisely, your incorrect beliefs. As Mark Twain said, “It ain’t what you don’t know that gets you into trouble. It’s what you know for sure that just ain’t so.”

In my opinion, you need to do the very same reading that you recommend for me.

Thanks for the suggestion, David, but there’s only one of us who doesn’t understand that when you light a candle outdoors during the day the sun ends up warmer than if you didn’t light the candle … and it’s not me.
Yes, the NET flow of HEAT is from the sun to the candle … but that HEAT flow is the net of two real physical ENERGY flows, both of which add energy to the object that they hit, and thus leave that object warmer than it would be otherwise. Come back when you understand that, and we can continue the discussion.
w.

David Bennett Laing
Reply to  David Bennett Laing
October 24, 2016 10:55 am

Scott: Common experience and the second law of thermodynamics both support the reality that a hotter object will not absorb radiation from a cooler one. Please cite for me the hard data on which you base your statement to the contrary. Thanks.

David Bennett Laing
Reply to  David Bennett Laing
October 24, 2016 11:03 am

Willis: Would you also like to tell me how many angels can dance on the head of a pin? I hear your didactic words, but I’m neither willing to “understand” nor to accept them without some kind of evidence. As I’ve asked Scott, please cite the hard data on which you base your assumption.

Robert Grumbine
Reply to  David Bennett Laing
October 24, 2016 11:22 am

David, the first law of thermodynamics is the law of conservation of energy. Not heat, not temperature.
btw, where is your _hard data_ that nature behaves as you’re assuming? ‘common experience’ is not hard data.
In any case, my favorite illustration of the effect is a frost fall. Temperature has to be just so, or the full effect is lost (either everywhere is too warm, or nowhere can get warm enough).
But, when conditions are right, a tree in a large, otherwise open area will be surrounded by a frost-free zone, with frost on the grass farther away. Tree temperature is colder than grass temperature, but the grass that has a good radiative view of the tree remains above the frost point. This is the extra radiation (energy) it is receiving from the tree, even though the tree is still colder than the grass.

David Bennett Laing
Reply to  David Bennett Laing
October 24, 2016 12:56 pm

Willis: Again, show me the hard data that prove your point, and chances are good that I’ll agree with you. Otherwise not.

David Bennett Laing
Reply to  David Bennett Laing
October 24, 2016 1:01 pm

Robert Grumbine: No, radiation can escape to space more easily from outside the perimeter of the tree crown than it can from within that perimeter, hence frost forms more easily away from the tree.

ScottM
Reply to  David Bennett Laing
October 24, 2016 2:01 pm

David, Dr. Roy Spencer has conducted experiments to measure exactly such a thing (not with candles and the Sun, obviously). http://www.drroyspencer.com/2016/08/experiment-results-show-a-cool-object-can-make-a-warm-object-warmer-still/
You stated above that “I am not a “slayer’” (whatever that may be)” but here you are acting as a proponent of exactly those arguments put forth by the self-styled “slayers”.

ScottM
Reply to  David Bennett Laing
October 24, 2016 3:15 pm

Also, David, if “a hotter object will not absorb radiation from a cooler one”, then this device has no chance of working: https://en.wikipedia.org/wiki/Multi-layer_insulation
But NASA and JPL use it all the time.

David Bennett Laing
Reply to  David Bennett Laing
October 24, 2016 5:07 pm

ScottM: Dr. Spencer’s crude experiment was interesting, but I don’t think that it succeeded in demonstrating that a cooler object could transfer heat to a hotter one. When the painted sheet was not present, heat loss from the heated flashing source to the ice sink was at a maximum, and this caused the flashing to show a lower temperature, but when the painted sheet was inserted, it reduced the heat loss to a lower value by shielding the ice sink, meaning that more heat was retained by the heated sheet, whereupon its temperature went up. In other words, the flashing was being heated by the lamp taped to its upper surface, and due to its high heat loss to the ice below, its lower surface was unable to reach the temperature of the lamp. The inserted painted sheet, by slowing some of the heat loss, allowed the flashing to approach more closely the temperature of the lamp, but the experiment did not show that any heat was actually transferred from the inserted sheet to the flashing.
BTW, I remain blissfully unaware of the meaning of “slayer.” Can you explain, please?

David Bennett Laing
Reply to  David Bennett Laing
October 24, 2016 5:16 pm

ScottM: Again, MLI works to slow heat loss from a source of radiation. The principle does not include the transfer of heat from the cooler object to the warmer one.

ScottM
October 24, 2016 10:23 am

What the graph really shows is the difference between the measurement period 1975 – 1998 and the baseline period 1981 – 2010. Only the years 1975 – 1980 and 1999 – 2010 contribute to the graph (and the latter period contributes in the negative direction). We can conclude from the graph that March was either warmer during the late seventies compared to the 2000s by a greater amount, or cooler during the late seventies compared to the 2000s by a lesser amount, than October was. (The normalization hides the direction of change.) Argh, I know that’s hard to parse, maybe this is easier: October warmed more than March did, going from the earlier period to the later one.
But we can’t conclude that October was cooler than March (or that June was cooler than March). All of the true seasonal variation is obscured by the inappropriate methodology.

David Bennett Laing
Reply to  ScottM
October 24, 2016 12:53 pm

ScottM: No, sir. The analysis period is 1975 to 1998 and the base period is the 20th century, so the methodology you gratuitously disparage is appropriate after all. Thanks!

ScottM
Reply to  David Bennett Laing
October 24, 2016 1:52 pm

Okay, I rechecked NOAA’s website and they have different base periods for different data sets. One base period is stated to be for the 1981-2010 base period, and another is the 20th century. Excuse my confusion.
So the graph shows the arithmetic negative of the average anomaly for the years 1901 through 1974,1999, and 2000. Not very useful.
However, please withhold unfair commentary like “gratuitously disparage”. There is nothing gratuitous about my comments. Your methodology has deep flaws that I and others have pointed out above. Your reply does nothing to address my criticism, which is summed up in the last paragraph of my previous comment: “But we can’t conclude that October was cooler than March (or that June was cooler than March). All of the true seasonal variation is obscured by the inappropriate methodology.” The choice of base period is irrelevant to that conclusion. The fact that the base period matters in determining the shape of the graph you produced is evidence enough.

ScottM
Reply to  David Bennett Laing
October 24, 2016 3:17 pm

“average anomaly *by month* for the years 1901 through 1974, 1999, and 2000”, is what I meant.

David Bennett Laing
Reply to  David Bennett Laing
October 24, 2016 4:16 pm

ScottM: The graph shows the average monthly anomaly from the monthly 20th century base for the period 1975 to 1998. I don’t know what you mean by “arithmetic negative.” Please refrain from judgments like “not very useful” and “your methodology has deep flaws.” They’re…well…, not very useful. If you have objections to my approach, please state them clearly without resorting to such gratuitous disparagements. Thank you. I do excuse your confusion, but your commentary is also confused as written. Can you possibly do any better?