Suggested Disclaimer: Climate Model Outputs Have Been Manipulated By NOAA to Make Models Appear to Perform Well
Guest Post by Bob Tisdale
This post introduces readers to a newly revised “product” from NOAA, called “Climate Explorer”, which is part of their U.S. Climate Resilience Toolkit. NOAA released this misleading product on July 27, 2016 and so far it has received little attention by the blogosphere and mainstream media.
That’s a good thing.
NOAA has manipulated the climate model outputs to make the models stored in the CMIP5 archive appear to perform well regionally on an absolute basis.
Also, both data and model hindcast outputs are available on the related NOAA Climate Explorer webpages, and when we compare their linear trends, we rediscover what we already know: climate models do not properly simulate surface temperatures in the United States.
IMPORTANT INITIAL NOTE: The NOAA Climate Explorer is not to be confused with the KNMI Climate Explorer, the latter of which IS a very useful tool.
INTRODUCTION
The NOAA press release Climate change in your county: Plan with this new tool begins:
Residents, communities and businesses now have easy access to climate projections, through a few easy keystrokes, for every county in the contiguous United States.
NOAA’s newly updated Climate Explorer offers downloadable maps, graphs, and data tables of observed and projected temperature, precipitation and climate-related variables dating back to 1950 and out to 2100.
Built to accompany the U.S. Climate Resilience Toolkit, the Climate Explorer helps community leaders, business owners, municipal planners, and utility and resource managers understand how environmental conditions may change over the next several decades.
It continues (my boldface and underline):
Climate Explorer projections are based on two global climate model scenarios that describe how the abundance of heat-trapping gases in Earth’s atmosphere may change through 2100. The tool provides projections for parameters such as changes in the number of days over 95 degrees F, number of days with heavy rain, and heating and cooling degree days.
“The Climate Explorer is designed to help users visualize how climate conditions may change over the coming decades,” said David Herring, communication and education program manager at NOAA’s Climate Program Office. “Projections of how much and how fast change is happening is crucial to help communities prepare and become more resilient.”
I enjoy weasel words: may, might, could, etc. NOAA used a few in the above quotes. Weasel words are prevalent in climate studies and their press releases. With their constant use, over the past decades of reading climate-related weasel words, I’ve come to read a phrase such as “may change over the coming decades” as “may (or may not) change over the coming decades”. That’s the reality.
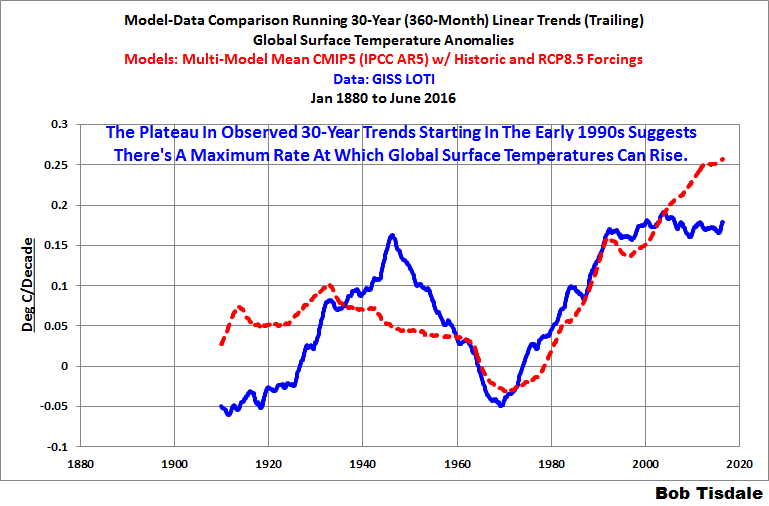
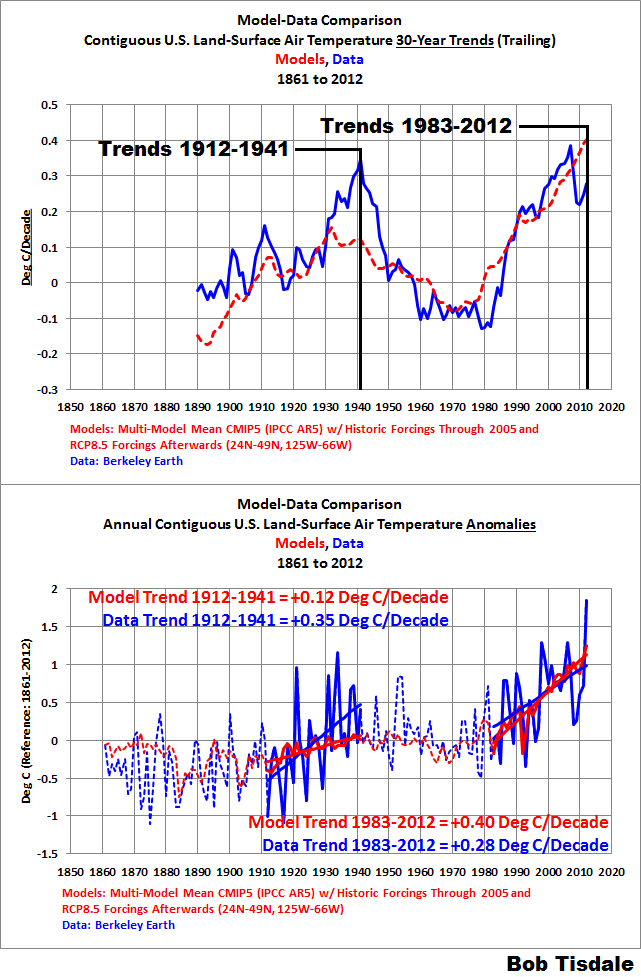
I’ve also highlighted the appearance of the word global in the quotes. The climate models used by NOAA for projections in their Climate Explorer are those stored in the CMIP5 archive, with the climate model forcings associated with the RCP4.5 and RCP8.5 emission projections. They are global models, not regional models. We already know that climate models can’t simulate the multidecadal variations in the surface temperature trends globally or for the contiguous United States. See Figure 12 from the June 2016 Global Surface and Lower Troposphere Temperature Anomaly Update and Figure 5 from In Honor of the 4th of July, A Few Model-Data Comparisons of Contiguous U.S. Surface Air Temperatures. Yet with their Climate Explorer, NOAA is presenting regional outputs from global climate models.
NOTE: If climate model forcings are new to you, see Chapter 2.3 of my free ebook On Global Warming and the Illusion of Control – Part 1 (25MB pdf), and if you’re new to RCPs (Representative Concentration Pathways), see Chapter 2.4.[End note.]
Let’s see how well and poorly those climate models supposedly simulated the surface temperatures of the 4 largest U.S. cities – Chicago, Houston, Los Angeles and New York – according to the data and model outputs supplied by NOAA’s Climate Explorer. As examples we’ll also present sample actual outputs of the CMIP5-archived climate model simulations (hindcasts) of Chicago’s annual minimum daily minimum temperatures and compare them to the spread provided by NOAA. Reality is quite different than what NOAA presents. And there’s something very obviously absent from the data provided by NOAA for coastal communities.
But first…
SAMPLE MODEL-DATA PRESENTATIONS BY NOAA AT THEIR CLIMATE EXPLORER
Please visit the NOAA Climate Explorer website, and select “Search by Location” from the blue menu. Enter your home town in the field, and select the appropriate county from the drop-down menu. I’ve chosen “Chicago IL, United States”, one of my old stomping grounds, which provides information for Cook County. Figure 1 is the time-series graph supplied by NOAA of the Mean Daily Maximum Temperature for Cook County on an annual basis, from their Chicago – Cook County webpage. It includes:
(1) the (optional) observations-based data from 1950 to 2010,
(2) the spread of the climate model hindcasts from 1950 to 2005, and
(3) the spreads and medians of the climate model projections from 2006 to 2100 for the RCP4.5 and RCP8.5 scenarios.
The data and model outputs are in deg F for U.S. audiences. Note that you can click on and download the data and model outputs from the link above and to the right of the graph, which are the sources of the data for many of the illustrations to follow. The data and model outputs provided by NOAA are in deg C, so you’d have to convert the data to deg F to match the NOAA presentation. There are also “Monthly” and “Seasonal” graphs available.

Figure 1
Note also that the left-hand menu also includes Mean Daily Minimum Temperatures, Days with Maximum above 95 Deg F and Days with Minimum below 32 deg F. Figure 2 is the time-series graph of the Mean Daily Minimum Temperature for Cook County on an annual basis, similar to Figure 1.

Figure 2
Scrolling down on the Chicago – Cook County webpage, there are model-data comparisons for precipitation, then heating and cooling degree days, and a map of the local weather station locations.
IMPORTANT NOTE: When discussing the model hindcasts, NOAA includes the following note in their “How to Read This” discussions (my boldface and underline):
The light gray band shows the range of model data (hindcast) for the historical period. To get a sense of climate models’ predictive ability for this variable in this county, compare the year-to-year variability of observations (dark gray bars) with the range of modeled projections.
But as you’ll discover later in this post, NOAA has manipulated the model outputs to make them appear to perform well, when the reality of the models is very different.
MODEL-DATA TEMPERATURE TREND COMPARISONS FOR THE BIG-4 CITIES/COUNTIES
Figures 3 through 6 are time-series graphs of the modeled and observed Mean Daily Maximum Temperatures (Tmax) and Mean Daily Minimum Temperatures (Tmin) on an annual basis, and their linear trends, for the four most-populous cities/counties in the United States:
- New York City (New York County),
- Los Angeles (Los Angeles County),
- Chicago – Cook County and
- Houston (Harris County).
The sources of the observations-based data and climate model hindcasts are linked to their respective NOAA Climate Explorer webpages. The graphs cover 1950 to 2005, which is the period provided by NOAA for the “Historical Modeled Data”. The linear trends for the data and model output median are as calculated by MS EXCEL. The graphs also include the supposed upper and lower bounds of the climate model outputs. I’ve also left the model and data in deg C, not deg F as NOAA shows in their graphs (Figures 1 and 2).
The notes at the bottom of each graph read Climate Model Outputs Have Been Manipulated By NOAA To Show Better Model Performance Than Actual Outputs. We’ll confirm that in a moment.
Let’s start the model-data comparisons with the better performances on the parts of the models and work our way toward horrendous.
Figure 3 includes the model-data comparisons for Los Angeles (Los Angeles County), using the data and model outputs provided at the NOAA Climate Explorer. Mean Daily Maximum Temperatures (Tmax) are included in the top graph and Mean Daily Minimum Temperatures (Tmin) are shown in the bottom one. Based on the linear trends of the model median and data provided by NOAA, the models do a good job of simulating the Mean Daily Maximum Temperatures from1950 to 2005 (top graph), but the models grossly underestimate the observed warming in the Mean Daily Minimum Temperatures for Los Angeles County (bottom graph).

Figure 3
Let’s also keep track of the average spans of the model maximum and minimum temperatures for 1950-2005, because, very oddly—very, very oddly—the ranges seem to capture the observations-based data almost perfectly. The average model spans are calculated simply as average modeled maximum values for a variable for 1950 to 2005 minus its average minimum values. For the Los Angeles Mean Daily Maximum Temperatures, the span of the modeled temperatures averages 2.3 deg C for 1950-2005. And for the Los Angeles Mean Daily Minimum Temperatures, the span averages 1.8 deg C.
The model-data comparisons for New York are next, Figure 4. For the New York Mean Daily Maximum Temperatures, the models double the observed warming rate, and for the New York Mean Daily Minimum Temperatures, the trend of the model median matches the observed trend.

Figure 4
There is apparently no consistency in model performance. For New York, the models performed poorly for the Mean Daily Maximum Temperatures, while for Los Angeles, the models performed poorly for the Mean Daily Minimum Temperatures. That’s a problem for users.
For the New York Mean Daily Maximum Temperatures, the span of the modeled temperatures averages 2.2 deg C for 1950-2005. And for the New York Mean Daily Minimum Temperatures, the span averages 2.5 deg C. Again, the ranges of the modeled maximum and minimum temperatures seem to capture the observations-based data remarkably well.
Figure 5 includes the model-data trend comparisons for Houston (Harris County). The trends of the data for both variables indicate very little warming from 1950 to 2005, and the models overestimated the observed warming for both variables by very noticeable amounts.

Figure 5
For the Houston Mean Daily Maximum Temperatures, the span of the modeled temperatures averages 2.2 deg C for 1950-2005. And for the Houston Mean Daily Minimum Temperatures, the span averages 2.1 deg C. The models continue to perform unbelievably well. The operative word in that sentence is unbelievably.
Last but not least, Figure 6, the model-data comparisons for Chicago (Cook County). Like Houston, the Chicago data show very little warming from 1950-2005 for both variables. In fact, the Mean Daily Minimum Temperatures for Chicago show no warming at all based on the linear trend. But according to the models, there should have been noticeable warming rates for both the Mean Daily Maximum and Minimum Temperatures for Chicago, if Chicago temperatures were governed by the forcings that drive the climate models.

Figure 6
For the Chicago Mean Daily Maximum Temperatures, the span of the modeled maximum and minimum temperatures averages 3.4 deg C for 1950-2005. And for the Chicago Mean Daily Minimum Temperatures, the span averages 3.1 deg C.
Contrary to what NOAA suggests with their statement, the climate model outputs presented by NOAA indicate the models have a very poor “predictive ability”.
WHY THE MODEL SPANS SHOWN BY NOAA LOOK ODD
We discussed and illustrated modeled and observed surface temperatures on a global basis in the November 2014 post On the Elusive Absolute Global Mean Surface Temperature – A Model-Data Comparison. There we discovered that the span of the modeled global mean surface temperatures on an absolute basis was roughly 3 deg C.
Yet, supposedly using the same models, NOAA is showing comparable and smaller spans for their absolute Daily Minimum Temperatures and Daily Maximum Temperatures on regional bases. Would we expect the model spans to be comparable both regionally and globally or would we expect the regional spans to be much greater than the global spans?
ACTUAL SIMULATED ANNUAL MEAN DAILY MINIMUM TEMPERATURE OUTPUTS FOR CHICAGO (COOK COUNTY) FROM THE MODELS STORED IN THE CMIP5 ARCHIVES
As examples of the actual modeled ranges and spans of simulated annual mean daily minimum temperatures for Chicago (Cook County), I downloaded and plotted the model hindcasts (1950-2005) that are part of the runs with the RCP4.5 and RCP8.5 scenarios. Both are available from the KNMI Climate Explorer, specifically the Monthly CMIP5 scenario runs webpage. To get a rough idea of the modeled Tmin ranges and spans for Chicago, I used the coordinates of 40N-42.5N, 90W-87.5W, with land-only values due to its proximity to Lake Michigan (assumes the models simulate that Great Lake). I’ve also shown in thicker red curves the values presented by NOAA.

Figure 7
# # #

Figure 8
Figures 7 and 8 show the actual modeled ranges and spans of simulated (hindcast) annual mean daily minimum temperatures for Chicago (Cook County) for the RCP4.5 (Figure 7) and RCP8.5 (Figure 8) scenarios. In both cases, the average minimum simulated daily Tmin for Chicago is roughly -6.0 deg C for the period of 1950-2005 and the average maximum simulated daily Tmin roughly +10.0 deg C, giving a modeled Tmin span of roughly 16.0 deg C, which is far greater than the hindcast and forecast changes in temperature.
Yet NOAA is showing a span of roughly 3 deg C and saying, in the text accompanying their presentation, one “can get a sense of climate models’ predictive ability for this variable in this county”.
Really?
HOW DID NOAA ACCOMPLISH THIS ILLUSION?
I suspect (but don’t know for certain) NOAA determined the climate-model simulated temperature anomalies for the variables, which drastically reduces the ranges and spans, and then shifted the results so that they capture the observations-based data. See Animation 1. It includes the Chicago Tmin data and model output presentations from the NOAA Climate Explorer in anomaly and absolute forms. The curves are exactly the same, where in reality they would not be because the actual range and span of the model outputs in absolute form is significantly different than shown.

Animation 1
And as a spot check, Animation 2 includes the same NOAA graphics for the Los Angeles annual Tmin. Similar results.

Animation 2
SOMETHING VERY IMPORTANT IS OBVIOUSLY MISSING
At NOAA’s Climate Explorer, visit a coastal city or town like Miami (Miami-Dade County), or New York City (New York County), or Los Angeles (Los Angeles County). What’s missing?
Sea level.
For communities near coastlines, possible sea level rise is the primary concern, not temperature, not precipitation, not heating or cooling degree days.
Is sea level addressed elsewhere in the NOAA U.S. Climate Resilience Toolkit? Dunno. I haven’t searched through all of the webpages. For coastal communities, it would have been logical for NOAA to include sea level on their Climate Explorer output pages. There’s tide-gauge-based data available from NOAA’s Tides and Current website. Makes one wonder what’s wrong with the climate model-based prognostications of future local sea levels.
CLOSING
For NOAA’s climate model output presentations at their newly updated Climate Explorer website and their claim there that users can “get a sense of climate models’ predictive ability for this variable in this county”, I nominate NOAA for the prestigious Handy Bullshit Button, first introduced by Roger Pielke Jr.

With Tom Karl retiring from NOAA, maybe the new head there will put an end to NOAA’s continued efforts to mislead the public about global warming and climate change. Sadly, I don’t think that’ll happen.
Discover more from Watts Up With That?
Subscribe to get the latest posts sent to your email.
Computer models have their limitations. They often fail to take PDO and solar activity into account. These models may even be wrong about how much carbon dioxide people put into the atmosphere. But, climate models are not the basis of the fact that carbon dioxide is a greenhouse gas. Direct measurement of the infrared spectrum of carbon dioxide is.
http://www.woodfortrees.org/plot/gistemp/from:1972/scale:200/plot/gistemp/from:1972/trend/scale:200/plot/sidc-ssn/from:1972/plot/sidc-ssn/from:1972/trend/plot/esrl-co2/from:1972/offset:-320
And, while the Sun cools, Earth continues to warm.
http://www.woodfortrees.org/plot/gistemp/from:1972/scale:200/plot/gistemp/from:1972/scale:200/trend/plot/sidc-ssn/from:1972/plot/sidc-ssn/from:1972/trend/plot/jisao-pdo/from:1972/scale:50/plot/jisao-pdo/from:1972/scale:50/trend/plot/esrl-co2/from:1972/offset:-320
Correction for the first link
http://giantsoftheinfinitesimal.co.uk/images/education/large/panel-f-spectra-co2.jpg
Jim:
Mylar balloons of CO2 cast no heat shadow.
i.e.; CO2 is actually IR-transparent.
My biggest peeve now with all the climate forecasts is the inclusion of the extreme case of 1200-1400ppm CO2. Today we are at 400ppm and in 1945 we were at 310 so we’ve gained 90 ppt in 70 years. In another 85 years, we will probably gain LESS THAN 90ppm because I assume that by then we will not be as dependent on fossil fuels for a million reasons besides the effort to reduce them today. Technology will have changed so much that it is inconceivable that we are using the same energy sources or that they have the same outputs. So, this means we will have at most 500ppm by 2100 or maybe on the farthest fringes of possibility 600ppm.
Putting in the 1400ppm case is simply a matter of propaganda. By putting this scenario into all their projections they can have these lines you see in the charts they produce which go off to ridiculous temperature increases. When you put the uncertainty in the charts produced by their explorer show that temperatures could rise 6 degrees C or so. Of course this depends on their CO2 supercharged models which produce massive temp change from CO2 so having a ridiculously high top end scenario biases viewers to believe that this is remotely possible when it isn’t.
I believe the IPCC does this in all its graphs for exactly the same reasons. By showing the 1400ppm line they have graphs that look scary because everyone focuses on the highest line as being the likely line since the other lines are all bunched up at lower temperatures one gets the feeling like the trend is massively up and you are driven psychologically to look at the potential increase.
If they removed the 1400ppm line and produced 3 scenarios which are more realistic say 400ppm in 2100, 500ppm in 2100 and 600ppm the graphs would look dramatically different. Of course, if they also cut their absurdly high supercharging of sensitivity to CO2 to a more realistic number it would also show that the total temperature change in 2100 would be under 1C more than today. Of course, they could always still exaggerate the graphs with their anomaly presentations so every tenth of a degree looks like a huge thing and still make it look somewhat scary people do have a sense that tenths of a degree aren’t a big deal.
I believe we should eliminate all graphs with the top line estimate and simply show the scenarios I suggest or the 600ppm scenario from the IPCC I believe this is called the 2.5 scenario.