From the National Snow and Ice Data Center.
A cool and stormy Arctic in July
An extensive area of lower than average temperatures in the Central Arctic and the Siberian coast, attended by persistent low pressure systems in the same region, led to slightly slower than average sea ice decline through the month. The stormy pattern contributed to a dispersed and ragged western Arctic ice pack for July, with several polynyas beginning to form late in the month. A new record low September ice extent now appears to be unlikely.
Overview of conditions

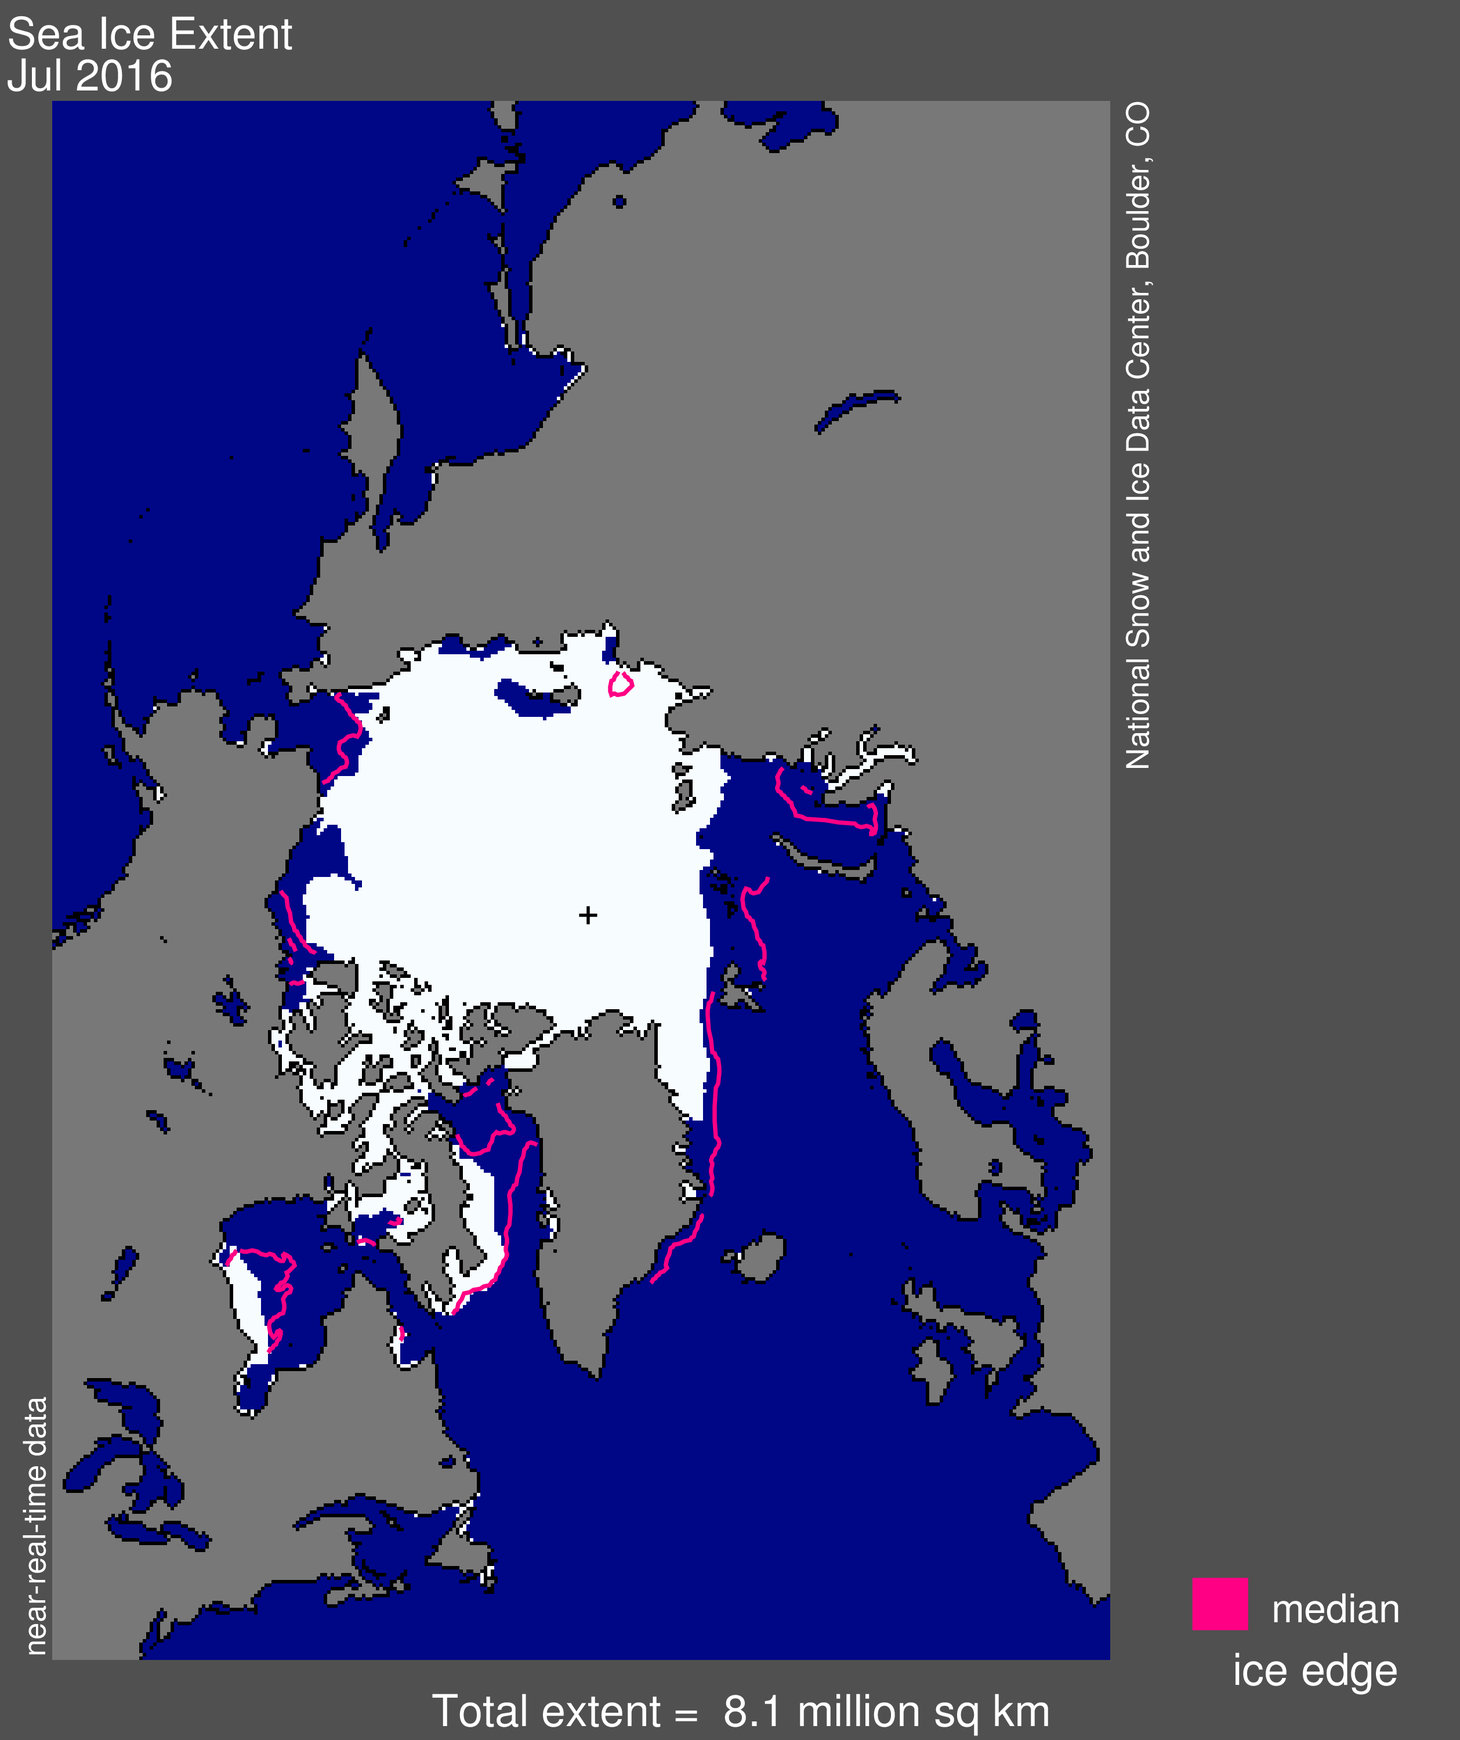
Figure 1. Arctic sea ice extent for July 2016 averaged 8.13 million square kilometers (3.14 million square miles). The magenta line shows the 1981 to 2010 median extent for that month. The black cross indicates the geographic North Pole. Sea Ice Index data.About the data
Credit: National Snow and Ice Data Center
Arctic sea ice extent for July averaged 8.13 million square kilometers (3.14 million square miles), the third lowest July extent in the satellite record. This makes July only the second month so far this year that did not have a record low extent. July’s extent is 190,000 square kilometers (73,000 square miles) above the previous record low set in 2011, and 1.65 million square kilometers (637,000 square miles) below the 1981 to 2010 long-term average.
Ice extent continues to be far below average in the Kara and Barents seas, as it has been throughout the winter and spring. Extent also remains well below average in the Beaufort Sea, but in the Laptev and East Siberian seas, sea ice extent is near average.
Conditions in context

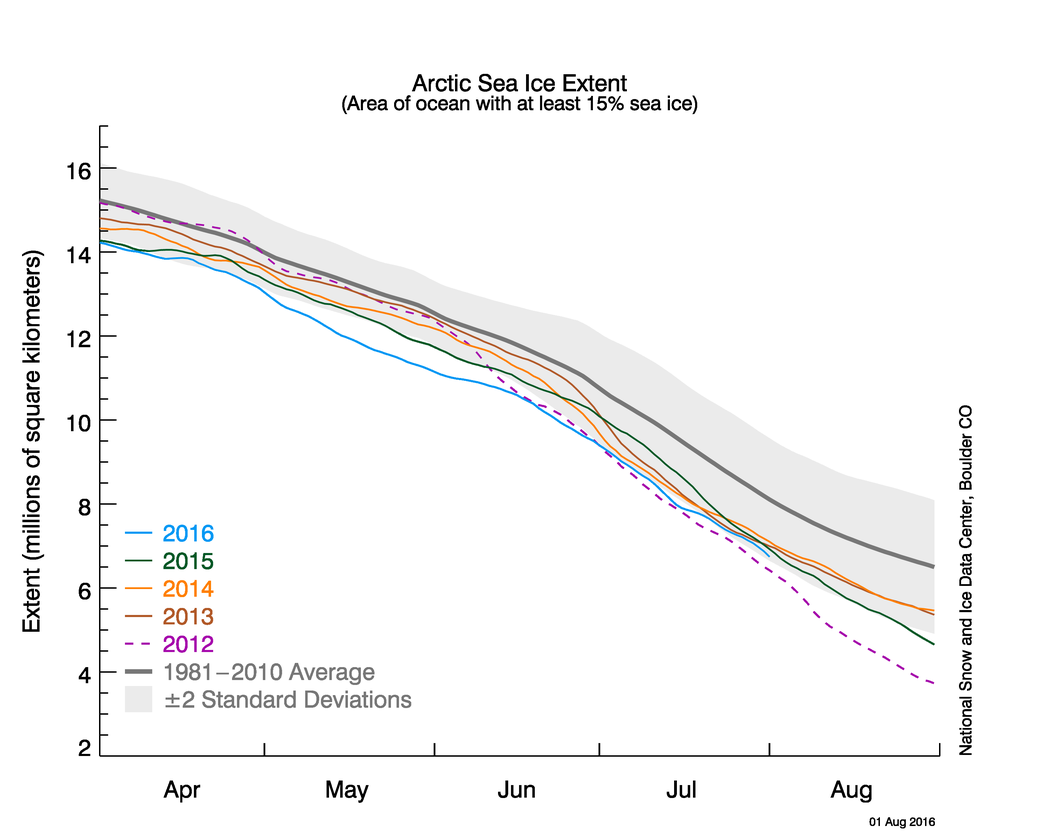
Figure 2a. The graph above shows Arctic sea ice extent as of August 1, 2016, along with daily ice extent data for four previous years. 2016 is shown in blue, 2015 in green, 2014 in orange, 2013 in brown, and 2012 in purple. The 1981 to 2010 average is in dark gray. The gray area around the average line shows the two standard deviation range of the data. Sea Ice Index data.
Credit: National Snow and Ice Data Center

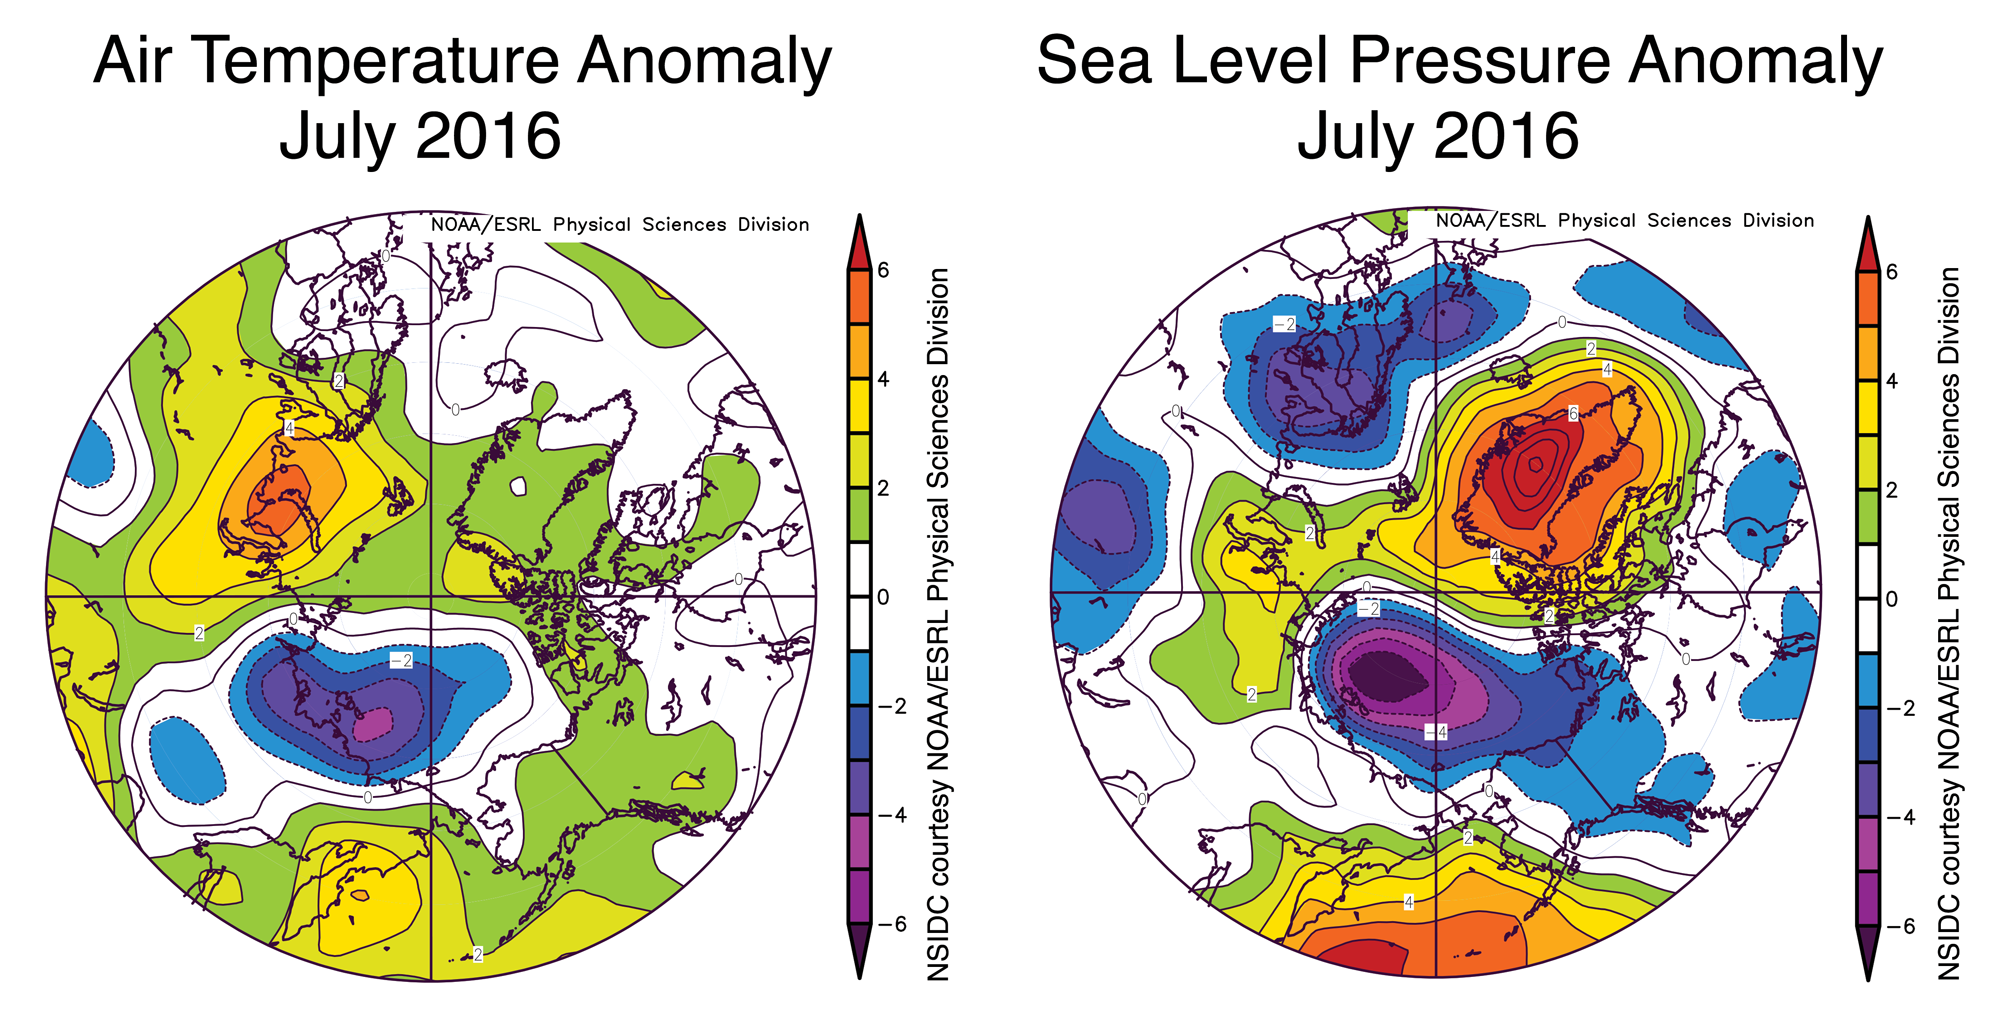
Figure 2b. The plot above shows July 2016 Arctic air temperature anomalies at the 925 hPa level in degrees Celsius and sea level pressure anomalies. Yellows and reds indicate higher than average temperatures and pressure; blues and purples indicate lower than average temperatures and pressure.
Credit: NSIDC courtesy NOAA Earth System Research Laboratory Physical Sciences Division
The rate of ice loss during July 2016 was slightly below average at 83,800 square kilometers (32,400 square miles) per day. The 1981 to 2010 average rate of ice loss for July is 86,800 square kilometers (33,500 square miles) per day.
Warm conditions with temperatures at the 925 hPa level of 1 to 2 degrees Celsius (2 to 4 degrees Fahrenheit) above average graced the northernmost coasts of Alaska, Canada, and Greenland, but the thick sea ice that is typical of this region is unlikely to melt out. Very warm conditions continued in the Kara and Barents seas, with temperatures as much as 3 to 6 degrees Celsius (5 to 11 degrees Fahrenheit) above average, consistent with the retreat of the ice cover to the northern edge of the Svalbard, Franz Josef, and New Siberian Islands. However, the main feature of the climate conditions for the month was a large area of below-average pressure centered over the Laptev Sea, and associated cooler than average conditions in the same area (1 to 4 degrees Celsius or 2 to 7 degrees Fahrenheit). This continues the pattern seen in June, with conditions unfavorable to pronounced sea ice retreat: cloudy and cool, with winds that tend to disperse the ice and increase its extent, rather than compact it.
July 2016 compared to previous years

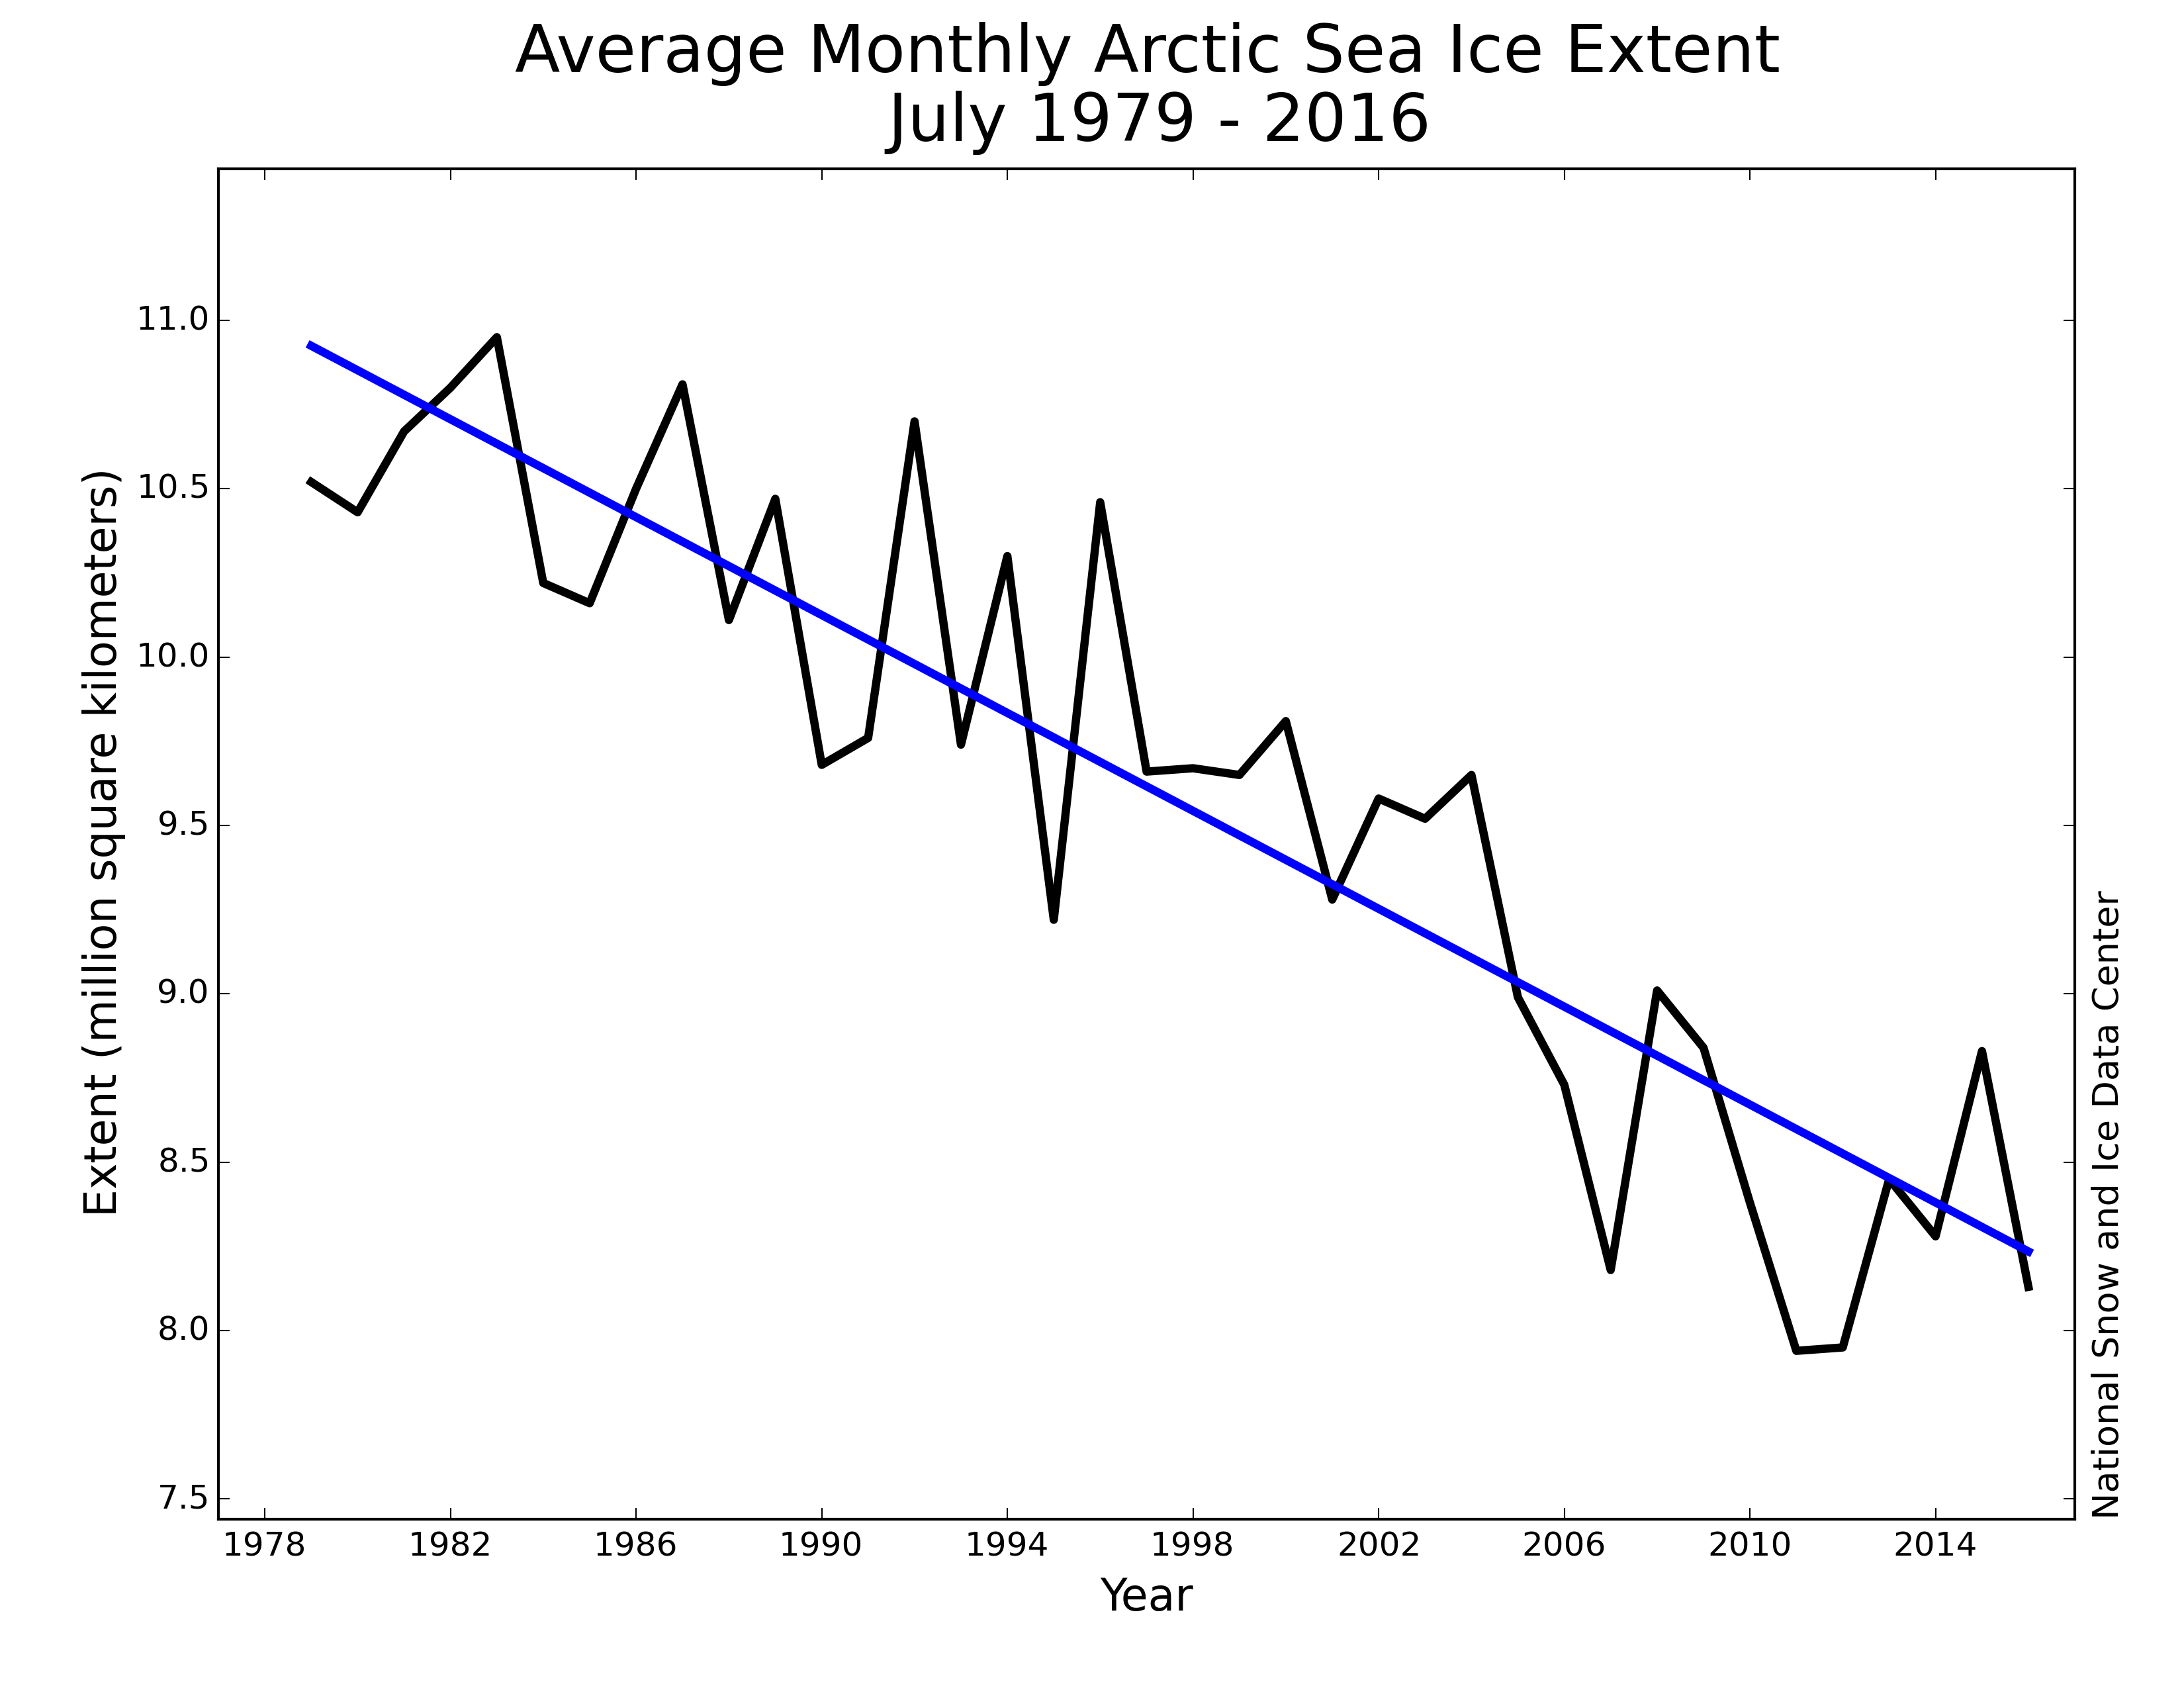
Figure 3. Monthly July ice extent for 1979 to 2016 shows a decline of 7.3 percent per decade.
Credit: National Snow and Ice Data Center
Through 2016, the rate of decline for the month of July is 72,700 square kilometers 28,070 square miles) per year, or 7.3 percent per decade. July extent remained above 2011 and 2012 levels throughout the month, but it was below the 2007 extent for the first half of the month.
A shift in pressure
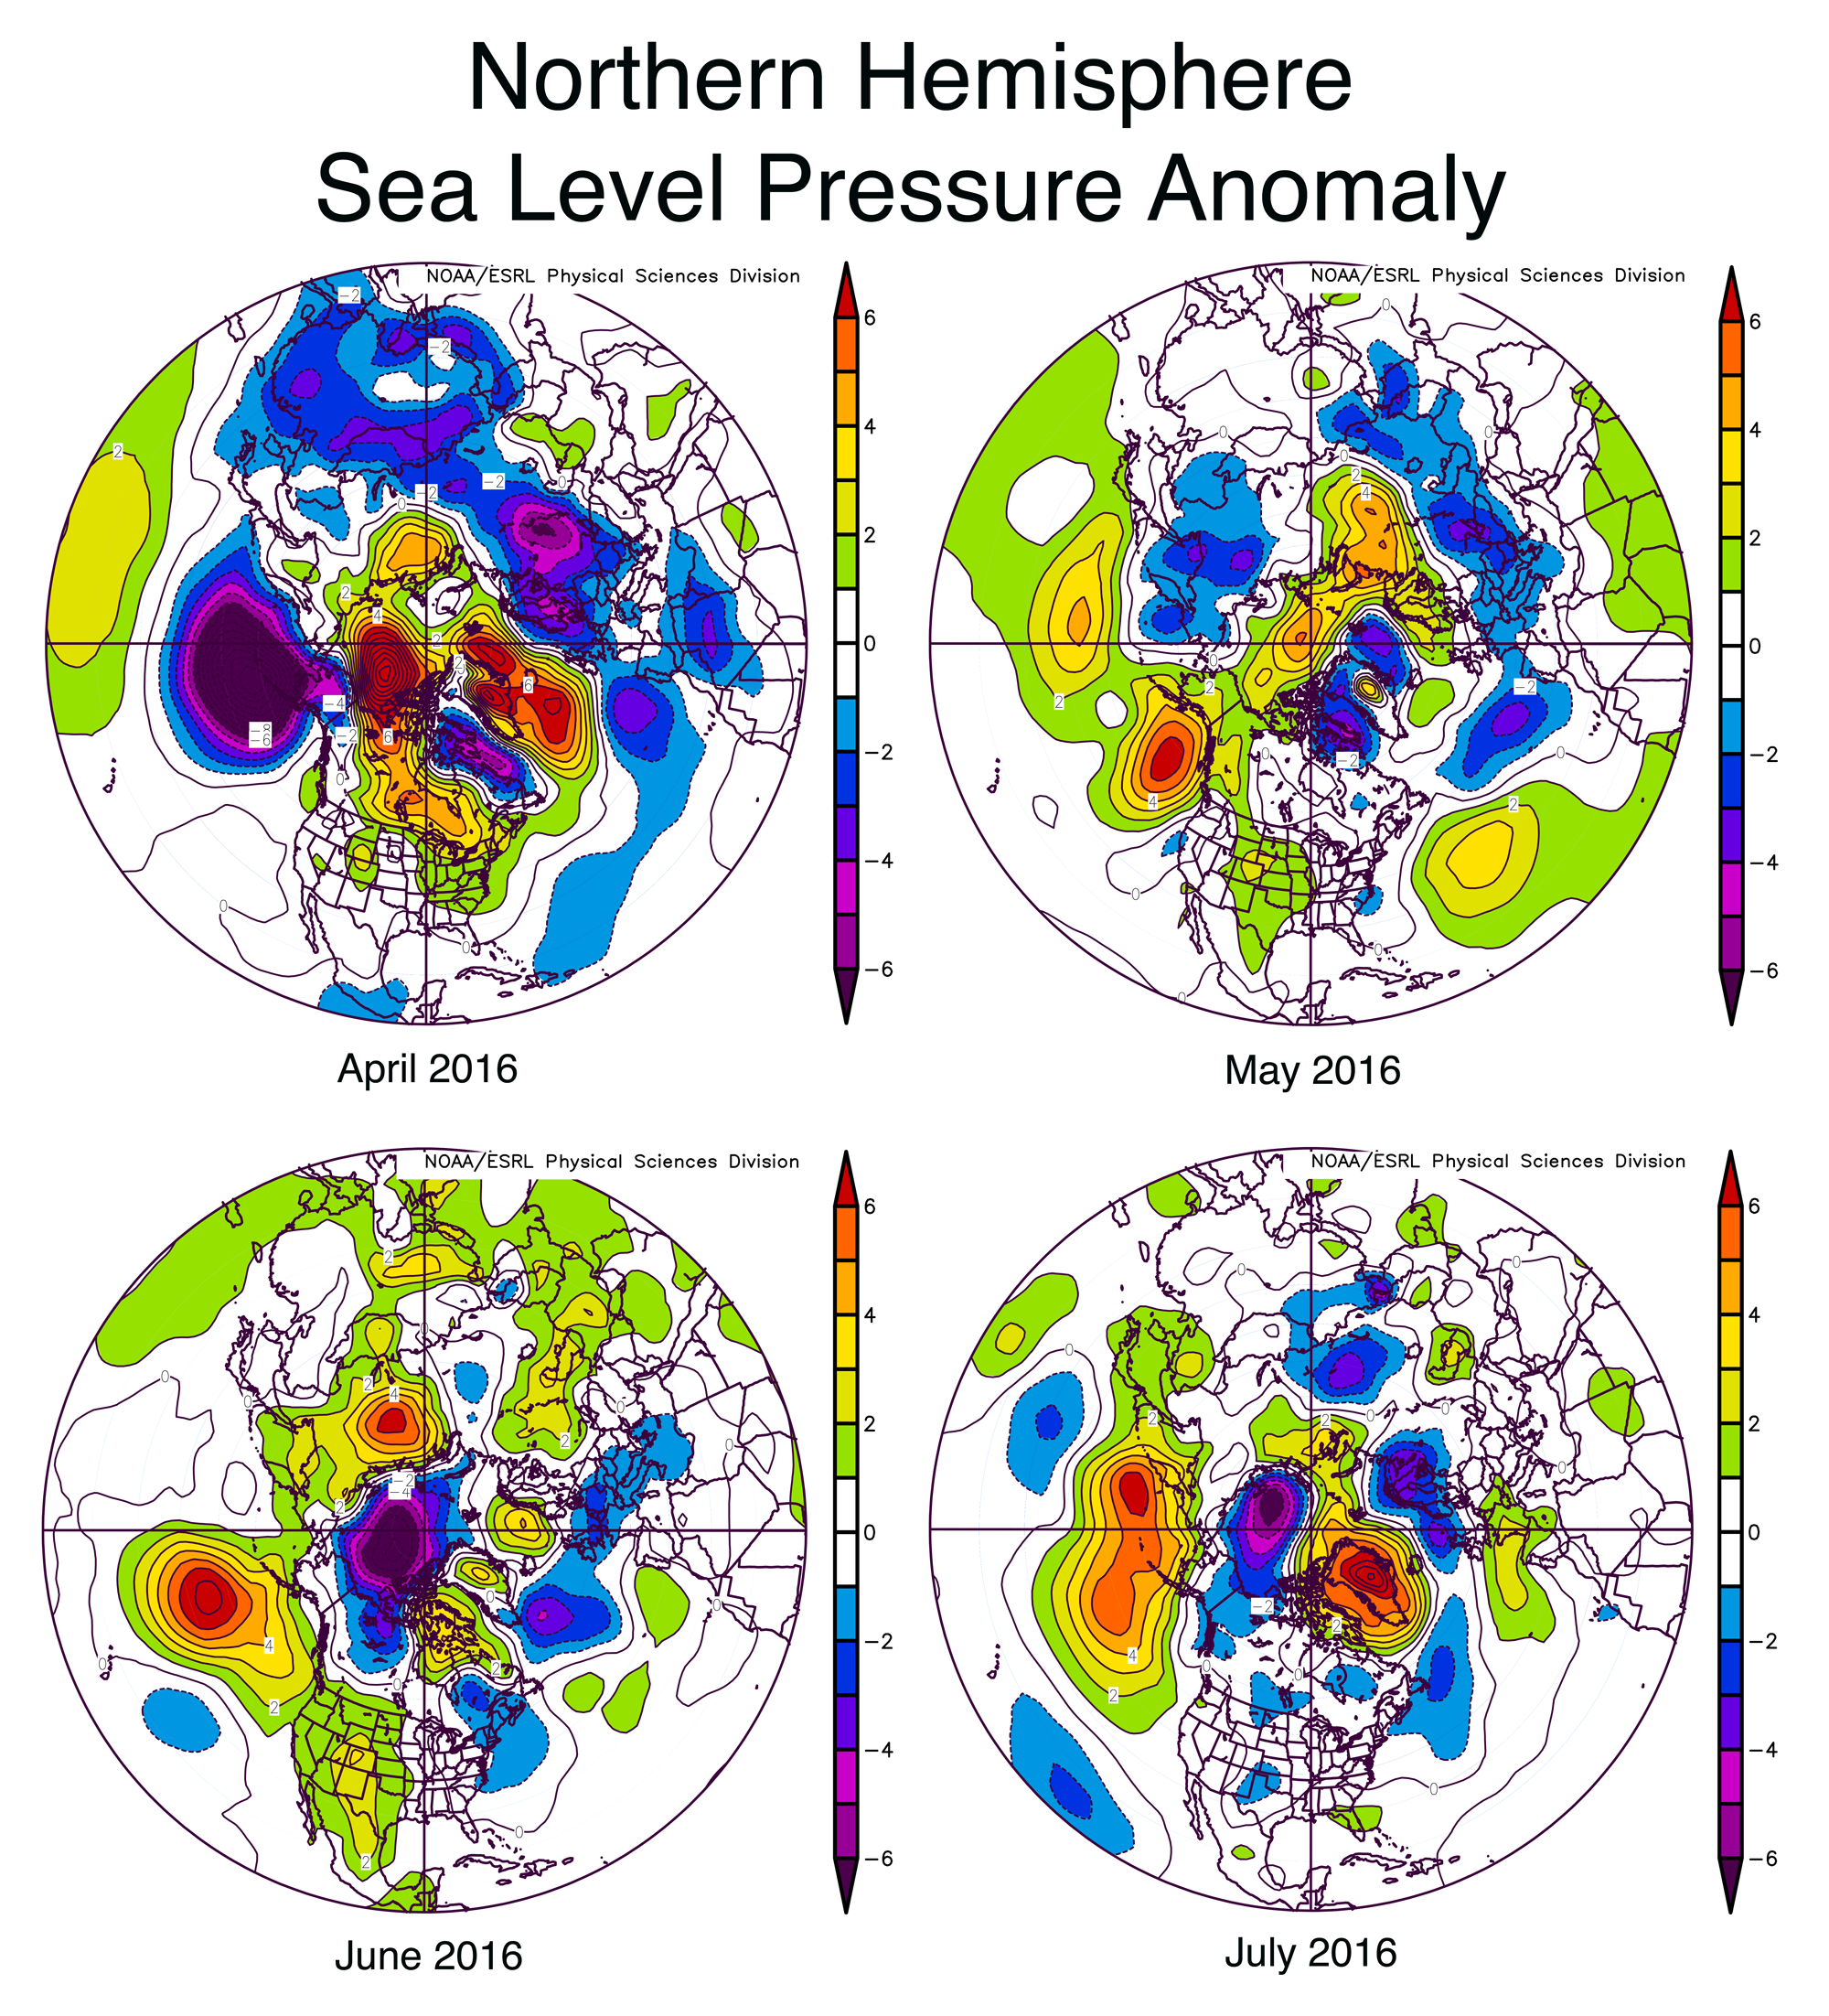
Beginning in June there was a significant change in the atmospheric circulation over the Arctic. May was characterized by high pressure over the Arctic Ocean which had persisted since the beginning of the year. However, in June the pattern shifted to lower than average pressure. This brought clouds and fairly low temperatures to the region, slowing ice loss. The change in circulation also shifted the pattern of ice motion, slowing the earlier movement of ice away from the coast in the Beaufort Sea (as depicted in ourMay 3rd post).
This pattern shift is associated with the development of a large and persistent area of moderate high pressure over the northeastern Pacific (south of Alaska) that formed beginning in mid-May. This may be related to an ongoing shift in the Pacific Decadal Oscillation over spring and early summer this year.

Figure 4. These graphs show sea level pressure anomalies or differences from average sea level pressure in the Northern Hemisphere for April, May, June, and July 2016.
Credit: NSIDC courtesy NOAA Earth System Research Laboratory Physical Sciences Division
More here in there complete post: https://nsidc.org/arcticseaicenews/2016/08/a-cool-and-stormy-arctic-in-july/
Looking at the satellite pics through Modis and Worldview, I don’t think the ice looks too healthy right now. It is broken up and there are lots of open areas.
But if one views the ice export out of the Fram Strait this year, it is far, far lower than normal which means more of the sea ice stays in the basin where it is less likely to melt and turns into multi-year ice after the winter.
Try looking at this Bill and you’ll see you are right – the ice is far from healthy.
but there has been a lot of ice pushed out of the CAB by storms/drift other than to the Fram – e.g into the Beaufort which melted out widely and early…
http://www.iup.uni-bremen.de:8084/amsr2/
Lots of ice that didnt melt at all and was just blown too, and claimed to be melting
It blew, then it melted…
Record July cold from Greenland. Early winter? A Limerick.
On August 1, 2016 the Danish Meteorological Institute’s measuring station registered an appalling -30.7 ° C at the ice cap’s summit as the month of July expired. (elevation 10500 feet)
“This is the lowest temperature for July we have from this station,” said DMI senior climatologist John Cappelen.
The previous record was -27.7 ° C on 30 July 1992.
Winter came early to Greenland
Nature has dealt it a mean hand.
It begins to unfold,
record temperature cold.
Melting? In fantasy dreamland. https://lenbilen.com/2016/08/07/record-july-cold-from-greenland-early-winter-a-limerick/
best as it ever was.
+10, for Talking Heads ref.
In 10 minutes I will be older than I’ve ever been before.
A new record,
An obvious trend.
But I’m gaining mass, so it’s not a problem. .
[The mods note that your message appeared at the local speed of light in the current environment, therefore you must be sane, but not heard. Relativistically speaking, off course. .mod]
Does it matter that much since it doesn’t support the AGW conjecture anyway since as AndyG55 stated,it has had little to no summer ice in the Arctic for periods of time in the early part of the Holocene,despite the CO2 being around 260-280 level.
http://www.passengership.info/news/view,is-icrystal-serenityi-in-treacherous-waters-with-new-arctic-cruise_43987.htm
…
http://onlinelibrary.wiley.com/doi/10.1002/2015GL065704/full
The same Dr. Meier right here on this blog six years ago,stated what I mentioned,that there was times EARLIER in the Holocene of little to no ice in the Summer:
“Can the Arctic really become sea ice-free during summer?
It has been suggested that the Arctic really can’t lose all its sea ice during summer because there isn’t enough energy to melt all of the ice in the short summer. There are a couple of reasons why this thinking is faulty.
First, we know the Arctic can potentially lose all its sea ice during summer because it has done so in the past. Examination of several proxy records (e.g., sediment cores) of sea ice indicate ice-free or near ice-free summer conditions for at least some time during the period of 15,000 to 5,000 years ago (Polyak et al., 2010) when Arctic temperatures were not much warmer than today.”
https://wattsupwiththat.com/2010/07/14/nsidcs-dr-walt-meier-part-2/
sunsettommy
The entire question is nonsense when at realistically.
The arctic sea ice reaches a maximum in late March – NOT the middle of winter up north! – when the arctic sun is present about half the time, and when it is dark about half the time. Thus, when it is -25- to -28 degrees C out there and completely dark for 24 hours of every day, the sea ice is still freezing up, gaining area and mass.
April-May-June-July, the arctic sun IS out, and the sunlight DOES reflect from the arctic sea surface and from the sea ice present up there. This is, obviously, “summer” … But the arctic sea ice is merely reducing from its March-April maximum of 14.0 Mkn^2. It is NOT anywhere close to “zero”, nor any fraction of “zero sea ice.”
Now, by August 12, the arctic sea ice melt ponds are receiving so little sunlight and so little heat that they begin re-freezing over each night. The total solar energy into the melt pond water (into the Arctic Ocean if the sea ice is melting at all) over an entire 24 hour day of 24 hours of sun is so little that the ice begins re-freezing on August 12.
Obviously, you are SUPPOSED to amuse that the “complete loss of sea ice” means that the arctic sea ice vanished in March and stayed away all “summer” only to begin refreezing during the darkness of “winter between September and March.
Now, there is STILL a large amount of sea ice loss between August 12 and the sea ice minimum in middle September. But does it matter – as Anthony asked the same question so effectively last September?
Let’s assume that a “complete loss of sea ice” does occur at some September minimum. Well, the difference in area between September’s AVERAGE sea ice minimum of 3.0 Mkm^2 and 0.0 Mkm^2 is .. well, 3.0 Mkm^2. So we lost “one Greenland”s ” worth of sea ice. Not the entire Arctic Ocean’s worth of sea ice by any means.
Further, we lost that sea ice between its “normal” sea ice edge latitude of 80 degrees north! There’s not much sun at 80 degrees north in September 1- September 30. And every day after 12 August, every hour after 1 September there is even less sunlight every day.
And, every hour of every day after 1 September, there is even less sunlight, striking at an even lower angle above the horizon, and striking through an ever-longer, ever-thicker atmospheric attenuation blanket.
So, even IF the entire arctic ocean were “ice free” on September 15, it would be receiving very little solar energy, the melt ponds would have been refreezing for 4-6 weeks already, the snow on top of the sea ice would be building up, and the sun would be underground for more and more hours every day after the sea ice minimum was reached.
So what? if all of the arctic sea ice melted one September, the Arctic ocean would lose more heat energy from the exposed ocean water than it would gain from the sunlight into that exposed ocean water.
Now, if “all of the arctic sea ice were lost earlier” – say by 1 August somehow, when the sun is higher in the sky for more hours of the day than it is in mid-September?
If so, the question becomes: What happens next?
Well, by 1 September, the increased losses from increased evaporation, convection, conduction and LW radiation losses STILL mean 1 September will mark a time when heat losses exceed heat gains from solar radiation into the newly exposed ocean water. The sea ice melt ponds will continue refreezing each night – just like they did on 12 August when Judith Curry was observing them at 79 north. And so, the minimum sea ice point comes a little bit earlier that year (due to the increased losses of ocean surface heat) and the sea ice looks the same in October as it did the previous October.
So, more sea ice loss between 1 September and 30 March = more heat loss to space through evaporation, convection, and conduction and radiation!
So, even IF the entire arctic sea ice vanishes in September one year, there is no effect the following months, years, or decades on the arctic.
Over the winter, regardless of how much sea ice is present in September, the arctic ocean will refreeze. A claim that the next five years of multi-year ice is “gone” can be made, but there is no evidence that that event has any effect. Most multi-year ice vanished in 2007, and the sea ice recovered.
Most of the multi-year ice melted in 2012, and the sea ice recovered. In fact it increased in area – and area is the thing that counts in reflecting solar energy from the sea ice or from the ocean water.
Yes, but when the arctic was ice free at that time, we were in a different part of a Milankovitch cycle – the orbital effects seen then are not in play now, yet still ice declines
Oh Griff with his “theories” are “facts” arguments. ROFL
https://en.wikipedia.org/wiki/Eemian
“The Eemian climate is believed to have been about as stable as that of the Holocene. Changes in the Earth’s orbital parameters from today (greater obliquity and eccentricity, and perihelion), known as Milankovitch cycles, probably led to greater seasonal temperature variations in the Northern Hemisphere, although global annual mean temperatures were probably similar to those of the Holocene. The warmest peak of the Eemian was around 125,000 years ago, when forests reached as far north as North Cape, Norway (which is now tundra) well above the Arctic Circle ”
Evidence, not theory, Mark…
RACookPE1978,
A fine reply you made,but I was pointing out that there are evidence from several published papers that it has been nearly or all ice free during the Summer earlier in the Holocene. I agree that temperature alone could not have made most or all of the ice dissipate during the “melting” season.
Only they haven’t gotten terribly far.
Not peanut butter banana smoothies? Well, enough vodka makes any day just slip on by. Nights too.
Not to worry!
I am sure that if one hurries, they can still ride out of port tomorrow on a Northwest passageway cruise.
Leaving Anchorage August 16th!
http://www.crystalcruises.com/img/cruise/large_map/6319.png
And if you look, the southern route through the NW passage is already open…
http://www.iup.uni-bremen.de:8084/amsr2/Arctic_AMSR2_visual.png
Griff is a joker, Finnish? Adolf Erik Nordenskiöld went through the NWP in 1878. As I said, late 1800s, less ice than today, seems to be 30-40 year cycles
Also the polar ocean challenge boat is stuck, their prognosis is not looking good. Currently waiting on ice maps.
Stop talking pseudo nonsense
Mark – Helsinki August 8, 2016 at 6:24 am
Griff is a joker, Finnish? Adolf Erik Nordenskiöld went through the NWP in 1878. As I said, late 1800s, less ice than today, seems to be 30-40 year cycles
Afraid not, you have the wrong passage, Nordenskiöld transited the NE Passage, and required two seasons to complete the voyage having being iced up for the winter. In contrast, Ousland successfully transited both the NE and NW Passages in a single season a few years ago.
There was certainly not less ice in the NW Passage in the late 1800s, it took Amundsen 3 years to make the journey in 1903-1906, whereas the route is open every year these days.
You’re right Phil lol, good shout mate
Also the polar ocean challenge boat is stuck, their prognosis is not looking good. Currently waiting on ice maps.
They have left their anchorage and are en route to the entrance of the Vilkitsky strait now.
Interesting take, Phil, that ‘en route’ phrase; must mean ‘stuck waiting and hoping’ in CAGW terms.
From the “ships log 8/8/2016”
The boat is moving to ‘be in a position’ to take advantage of the ice getting blown away from the shore’!
Only as David puts it, luck, time and winds will tell if they can actually be ‘en route’ soon; even then, for just how long?
Yup, the Southern route is so clear of ice… Not!
There are sections where the ice coverage might allow a giant cruise ship and their attending ice breakers to smash through.
Maybe.
ATheoK August 8, 2016 at 3:44 pm
Yup, the Southern route is so clear of ice… Not!
There are sections where the ice coverage might allow a giant cruise ship and their attending ice breakers to smash through.
Maybe.
I don’t know what you’re looking at, it looks fairly clear to me.
ATheoK August 8, 2016 at 3:44 pm
Interesting take, Phil, that ‘en route’ phrase; must mean ‘stuck waiting and hoping’ in CAGW terms.
From the “ships log 8/8/2016”
“Frances GardShips log
N76 31, E098 32 Pressure 1004 wind 15/20k NW water temp 3.5 outside temp 2 8/8 foggy
Well they were ‘en route’ to the Vilkinsky Strait, now they’ve reached it and are sailing into it NNE at ~10km/hr,
current position Lat: 77.59ºN Lon: 102.68ºE
About 250km (as the crow flies) since leaving harbor.
The boat is moving to ‘be in a position’ to take advantage of the ice getting blown away from the shore’!
Only as David puts it, luck, time and winds will tell if they can actually be ‘en route’ soon; even then, for just how long?
Well there’s about 250km of ice to get through to reach the Laptev sea and they’re still about a week ahead of Ousland’s successful voyage. Ousland encountered ice at about the same location in the Laptev and was able to sail through it.
“This is the Expedition Report from the “Northern Passage”. It is the 19th of August and we are now at 75°N, 122 °E, and that means we are headed eastward in the Laptev Sea.
After passing Cape Chelyuskin, we have sailed 300 nautical miles through the ice. It has been quite a slalom run, half of it in fog. The challenging conditions forced us to run double shifts to avoid dangerous ice. Fortunately, we had relatively moderate winds, so that we were able to solve the challenges in a responsible manner. After hugging the coast, we were able to pass through a gap in the ice, and are now sailing eastward through a wider ice corridor, between the ice in the north and dense ice in the south. We are well on our way across the Laptev Sea.”
Yup Phil:
Stuck!
Their delayed August 9th Ships log posting:
They’re waiting for the vagaries of weather to assist them. ?dl=0
?dl=0

A giant cruise ship virtually unequipped for ice wouldn’t dare. They’d have to let the ice breaker clear a path.
And the oh so hot Arctic temperatures are already beginning the winter drop back below freezing. Gonna be chilly for those cruise ship passengers and Northabout sailors.
http://ocean.dmi.dk/arctic/plots/meanTarchive/meanT_2016.png
Oh, and Northabout has just reached the Arctic ice. They better hope for some really strong winds.
Yes, it is ONLY going to be second or third behind 2012 in extent.
and the area/mass/ice thickness/age of ice figures aren’t looking too good…
and this in a season where melt conditions in the critical June weeks were poor…
and we know from the recently published research we are at lower levels than any time since 1850, much lower than the 20s to 40s and that the ice is NOT recovering to pre-2007 levels…
this is good news how? this means it is all going to be OK why? this is somehow showing temps are dropping?
Come on!! I mean really!!!
You sound like you are going to have a breakdown, over melting ice.
I’m just amazed at how little posters here seem to look at the evidence
https://sites.google.com/site/arcticseaicegraphs/
you looked at that?
Pretty clear form all the evidence that unless there is a massive reversal in the trend there wont be much summer ice left in the next few years, but hey what possible harm could that do?
..Yes Toni and Griff, what harm would it do if the Arctic melted ??
Mark,
There could be trouble in Griff’s [trimmed].
Meanwhile, the rest of the world couldn’t care less about sea ice
[That is not needed. .mod]
Griff you have offered no solid evidence of anything. Ice has been lower than today, and as low in since 1850, you just wont accept it because you dont want to
Mark, I linked you to a set of data covering ice levels from all available records from 1850 to the present.
that’s not only evidence, that’s all the evidence there is…
Marcus
this covers the impact from the disappearing ice
http://www.nytimes.com/2016/07/29/magazine/does-the-disappearance-of-sea-ice-matter.html?_r=0
Griff,
Thanx for the NYT link. I just came across your post while looking for something else, but your link is so fascinating that I’d like to comment on it. The author writes:
In recent years, as the earth has endured the warmest annual temperatures on record…
Do you agree? Because that’s factually wrong. They’re just cherry-picking the time frame that supports the climate alarmists’ belief / contention / narrative / scare. That’s confirmation bias; a logical fallacy.
The author also says:
…the extent of sea ice around the southern continent of Antarctica has increased slightly, for reasons probably relating to natural climate variability…
Does “natural variability” only apply to the Antarctic? And does natural variability end at the equator? Because their argument is that only the Arctic is affected:
…the ice that typically covers the North Pole and surrounding areas of the Arctic has declined drastically.
But then:
The Arctic is now warming two to three times faster than the rest of the world, a phenomenon scientists have described as “Arctic amplification.”
Is Arctic amplification natural, or not? If you say it’s caused by human emissions I shall scold you, because your link also states:
One anecdotal measure of amplification is made possible by the accounts of ship captains from centuries ago, who kept meticulous journals…
Were those measurements “anecdotal”? Or were they written records of their measurements?
Answer: Those records were much more than “anecdotal accounts”. The measurements made centuries ago were used to create charts that are still in use today, because those charts are still accurate.
See the problem? Those promoting the “vanishing sea ice” narrative always argue like the scientists in your link. And many of their quotes are meaningless propaganda:
“Where is all the ice?” a NASA project manager named John Woods asked.
In your opinion, Griff, are the records of prior centuries accurate, or not? No cherry-picking, please. You can’t have it both ways.
Also from your link:
We also know that the Northwest Passage, the perilous, ice-choked route from the Atlantic to the Pacific through Northern Canada, is navigable today.
But that doesn’t withstand scrutiny, since we also know that six to seven millennia ago the Arctic was very likely ice free in summer, and probably other times of the year as well. So the NW Passage would have been even more navigable than now, and that was before human emissions could have been a factor.
If you want to use the “record”, you need to use the entire record, not just cherry-pick the part that confirms your bias. So, is there ‘danger’ from the ‘vanishing Arctic ice’ scenario?
The writer feels sure he has the answer:
…the steady retreat of sea ice may have a residual effect on all sorts of other things, like the ice covering Greenland or storms in New England.
Given the fact that not one alarming cAGW prediction has ever come true, why should anyone accept the various speculations in your link—especially since federal grant money rewards those promoting that false alarm. But the scientists who question the Arctic ice scare (or the ‘carbon’ scare, or the ‘accelerating sea level’ scare, etc.) are not similarly rewarded. No doubt the NYT readership head-nods along with quotes like this:
…the pattern of massive snowfalls in Boston in 2015, were brought on by alterations in the atmosphere — what she calls “an extreme waviness” of the jet stream…
“Extreme waviness”? Since observations don’t corroborate their hypotheses and every one of their alarming predictions have failed, their arguments become speculation-based assertions:
Marika Holland, a senior scientist at the National Center for Atmospheric Research in Boulder… remarked that there’s no indication, with global CO2 levels and temperatures steadily rising, that we will somehow buck the direction of the trend.
Actually, there is plenty of evidence that rising CO2 has no effect whatever on polar ice. And since there was no global warming over most of the last twenty years, what does Marika base her conclusions on?
The outcome is the same, and the outcome is bleak, in all of her computer models. “They all go ice-free in the future.”
See the problem, Griff? The Arctic ice scare, like all the other climate false alarms is based on computer models, not on real world observations. Marika Holland is trying to convince the public that CO2 affects only one hemisphere—the hemisphere that supports her models.
Maybe the public believes that model witchcraft, but readers here are more intelligent and better educated in the hard sciences than the general public. So if you want to be convincing, you will have to argue based on observations and verified, data-based measurements—which show that what we’re observing now is neither unusual, nor unprecedented.
What we’re observing now has happened before, repeatedly, and to a much greater degree. And there is no convincing evidence that this time is any different.
A negative PNA Pattern has been the favored mode all summer(as mentioned).
My bet is SH anomaly is ahead of Arctic anomaly, SH anomaly on the up (griff not interested in that) and the arctic is going to follow, it’s a case of when
when?
Dunno, I can make a model, and some predictions of what 2100 will be like.
I am speculating that is why currently Antarctica and Arctic appear to be doing the opposite, because of the lag due to ocean circulation
Of course nothing I say will affect people’s lives or economics
Mark – Helsinki August 8, 2016 at 4:30 am
My bet is SH anomaly is ahead of Arctic anomaly, SH anomaly on the up (griff not interested in that) and the arctic is going to follow, it’s a case of when
According to NSIDC the average NH anomaly for July is -1.5 million sq km and the SH anomaly is -0.3 million sq km. Both show a drop (i.e. more negative) relative to last year.
Yes in an El Nino 2015. yet SH has been on the up until that point, NH has just seen most snowfall in 2 decades with La nina, cant really consider this year, sure Greenland now well below normal temps.
Mind you what’s normal.
What?
JAXA Plots for comparison.

Extent:
Rate:
JAXA is knackered, 10% inaccurate, cant tell melt on top from sea water and poor at ice edge definition. All this from their own site
What makes you think the others are any better?
La Nina is really hitting now. Couple that with the prog I made (and has since come true) that the loss would be mostly in the lower longitudes (Prime Meridian + / – some zone).
Yogi Berra would have advised them against making such a projection, especially on regarding setting a new record: ‘It’s tough to make predictions, especially about the future.’
Funny how hot and bothered Warmists get over a little melted ice. I guess it gives them something to hand-wring about, since overall temps don’t seem to be following the script.
The problem is we get sucked into arguing about ice, but only because of the shrill claims about no ice and doom.
Whether the arctic loses all its ice in summer or not, it does not confirm AGW or CAGW, not even remotely
But if it did (when , sadly, it does) there will have to be a reason for it…
what non-CAGW reason could there be for that?
what reason can there be for the current levels, much lower (and continuing lower for nearly a decade) than the last cycle?
Casper, file not found.
alternative
http://www.google.at/search?site=&source=hp&ei=ENmoV-ydGcH06AT43IPQBA&q=arktische-sommereisschmelze-ein-menetekel-fuer-eine-bevorstehende-anthropogene-klimaerwaermun&oq=arktische-sommereisschmelze-ein-menetekel-fuer-eine-bevorstehende-anthropogene-klimaerwaermun&gs_l=mobile-gws-
testing –
Meanwhile the snows are way up, since 2010 cold has been surging. Records falling like dominoes. Smashing any counter warming hysteria.
Greenland summit broke it’s July cold by a few degrees, Finland recently broke it;’s coldest twice in one year. 10s of thousands of alpacas dead, climbers frozen to death in the alps where there is meant to be no snow by now, US cold records falling by the thousands since 2010.
While there is hysteria over a massively estimated .2 .3 or .4c warming anomalies. R to the O to the F to the L.
If we had balance, cold doom would be far more prevalent in the media.
Here the NSIDC chronicle record low snow…
http://nsidc.org/arcticseaicenews/2016/06/low-ice-low-snow-both-poles/
A major contributor to Arctic sea ice loss this year is the post El Nino warm burst to the AMO, almost as strong as the Summer 1998 and 2010 AMO anomalies:
http://www.esrl.noaa.gov/psd/data/correlation/amon.us.data
Getting close to the minimum now. A few more weeks and we’ll hit inflection.