From the National Snow and Ice Data Center.
A cool and stormy Arctic in July
An extensive area of lower than average temperatures in the Central Arctic and the Siberian coast, attended by persistent low pressure systems in the same region, led to slightly slower than average sea ice decline through the month. The stormy pattern contributed to a dispersed and ragged western Arctic ice pack for July, with several polynyas beginning to form late in the month. A new record low September ice extent now appears to be unlikely.
Overview of conditions

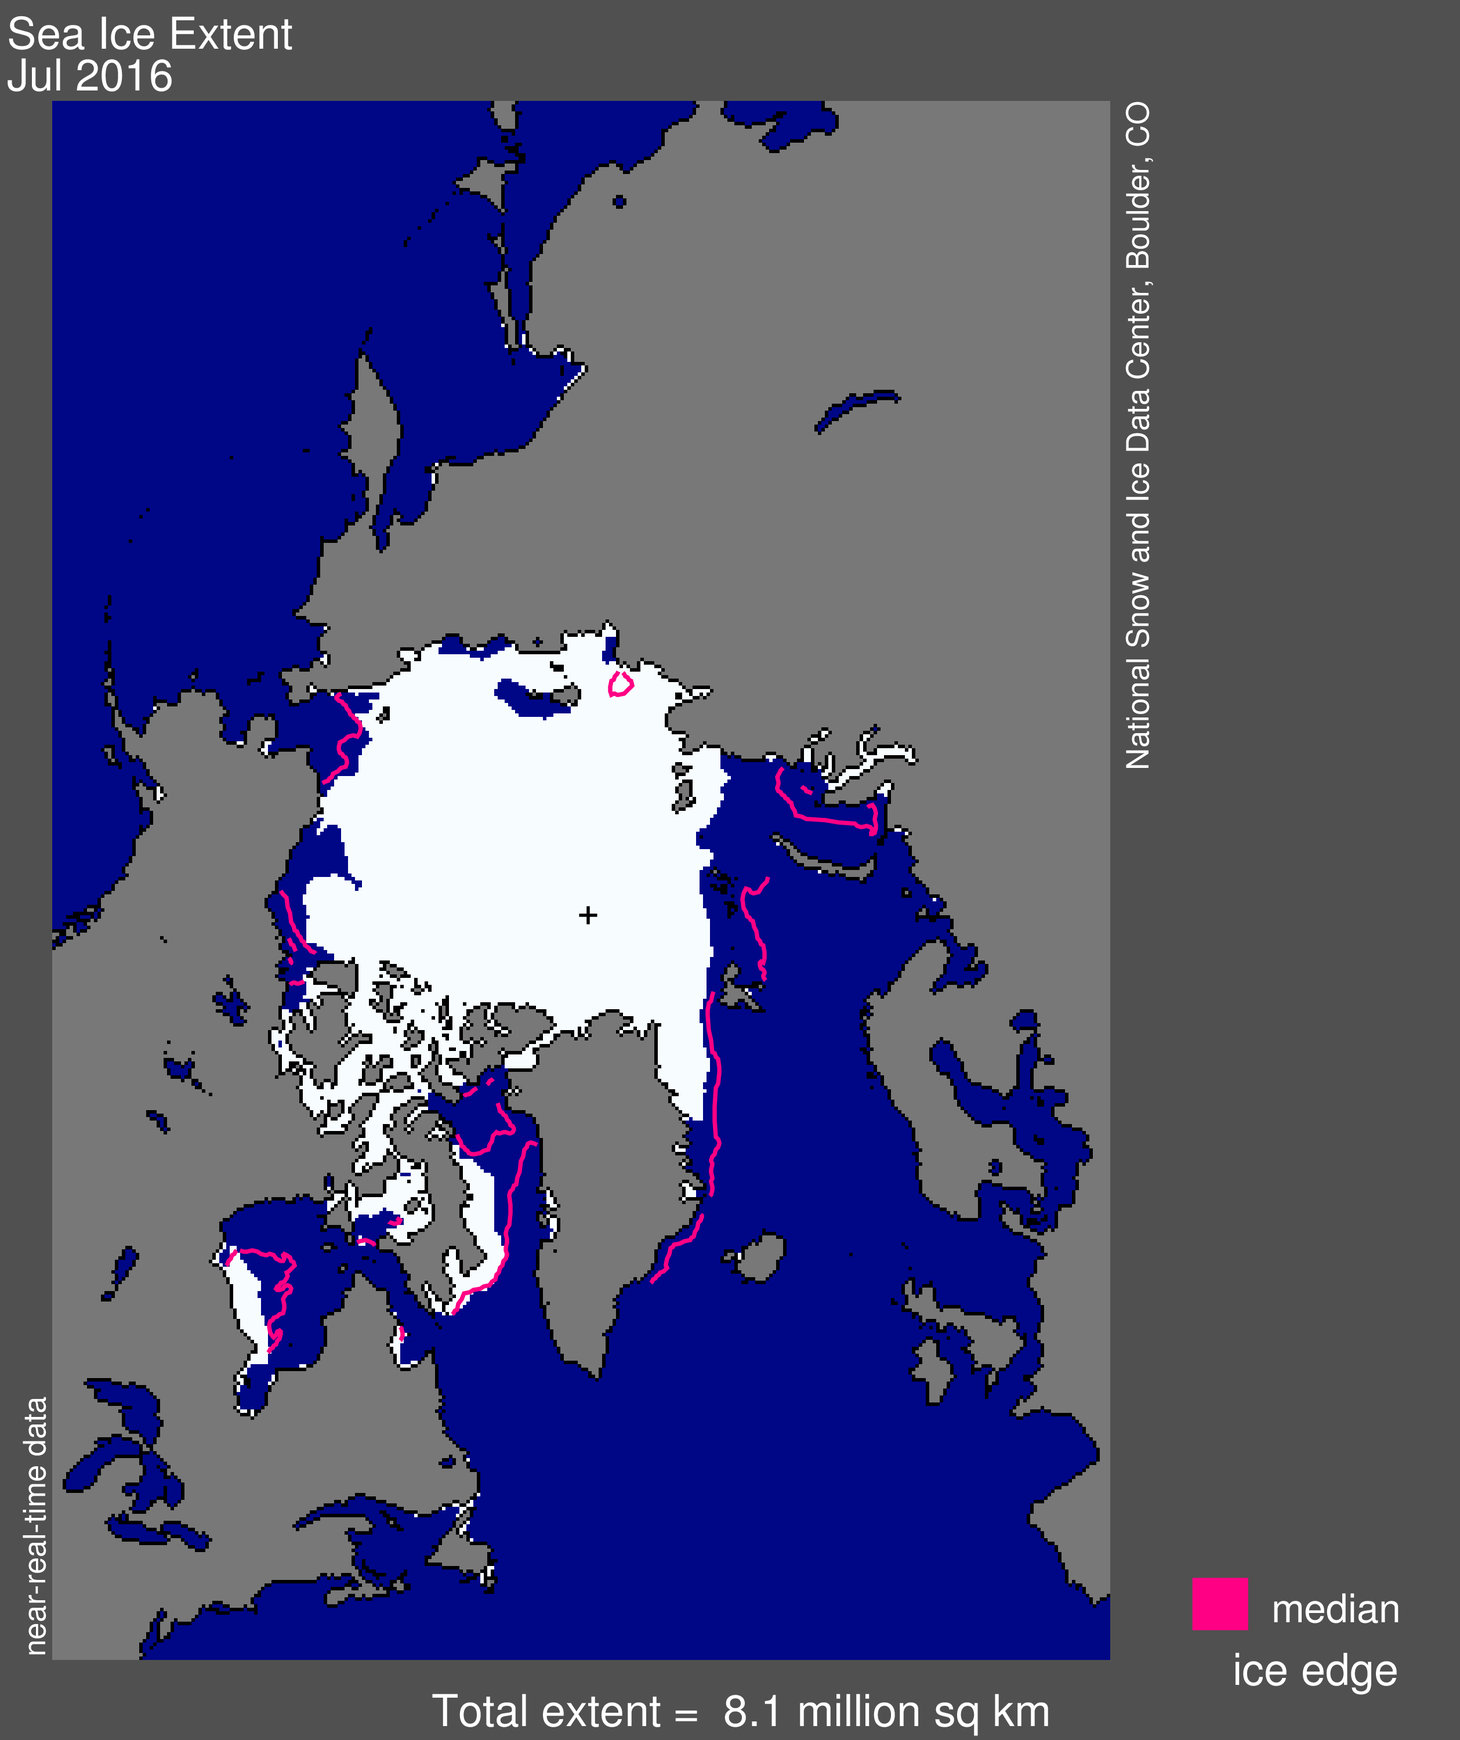
Figure 1. Arctic sea ice extent for July 2016 averaged 8.13 million square kilometers (3.14 million square miles). The magenta line shows the 1981 to 2010 median extent for that month. The black cross indicates the geographic North Pole. Sea Ice Index data.About the data
Credit: National Snow and Ice Data Center
Arctic sea ice extent for July averaged 8.13 million square kilometers (3.14 million square miles), the third lowest July extent in the satellite record. This makes July only the second month so far this year that did not have a record low extent. July’s extent is 190,000 square kilometers (73,000 square miles) above the previous record low set in 2011, and 1.65 million square kilometers (637,000 square miles) below the 1981 to 2010 long-term average.
Ice extent continues to be far below average in the Kara and Barents seas, as it has been throughout the winter and spring. Extent also remains well below average in the Beaufort Sea, but in the Laptev and East Siberian seas, sea ice extent is near average.
Conditions in context

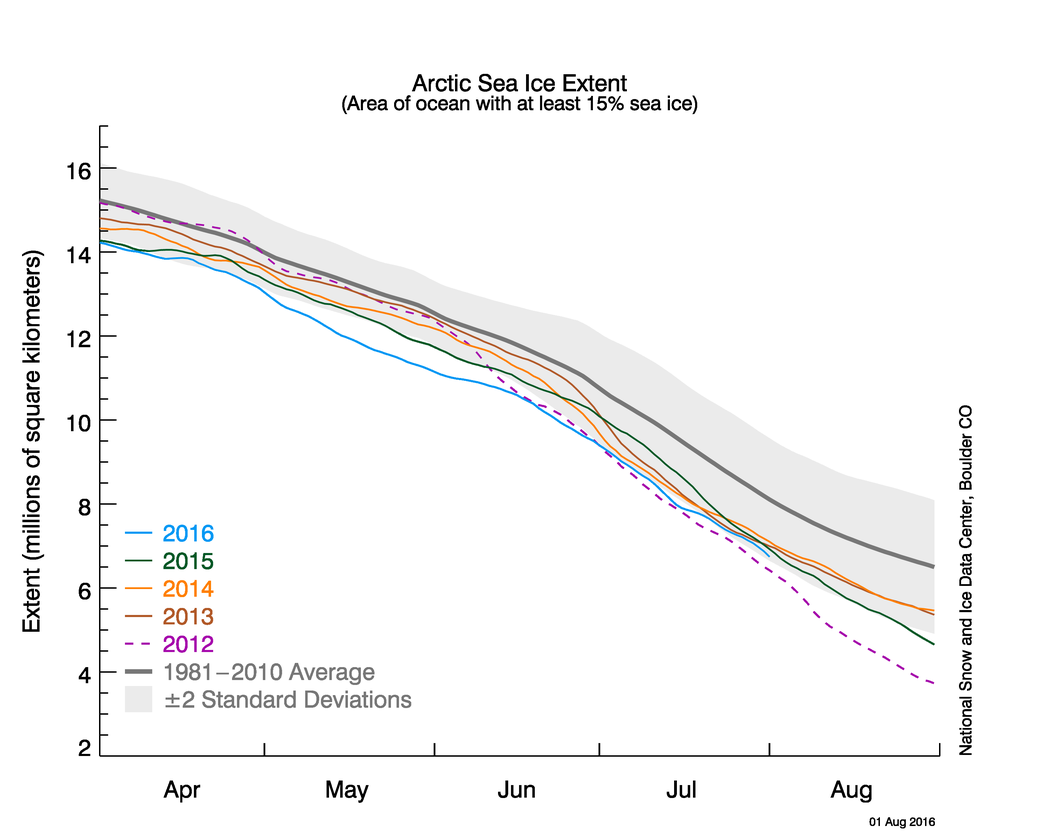
Figure 2a. The graph above shows Arctic sea ice extent as of August 1, 2016, along with daily ice extent data for four previous years. 2016 is shown in blue, 2015 in green, 2014 in orange, 2013 in brown, and 2012 in purple. The 1981 to 2010 average is in dark gray. The gray area around the average line shows the two standard deviation range of the data. Sea Ice Index data.
Credit: National Snow and Ice Data Center

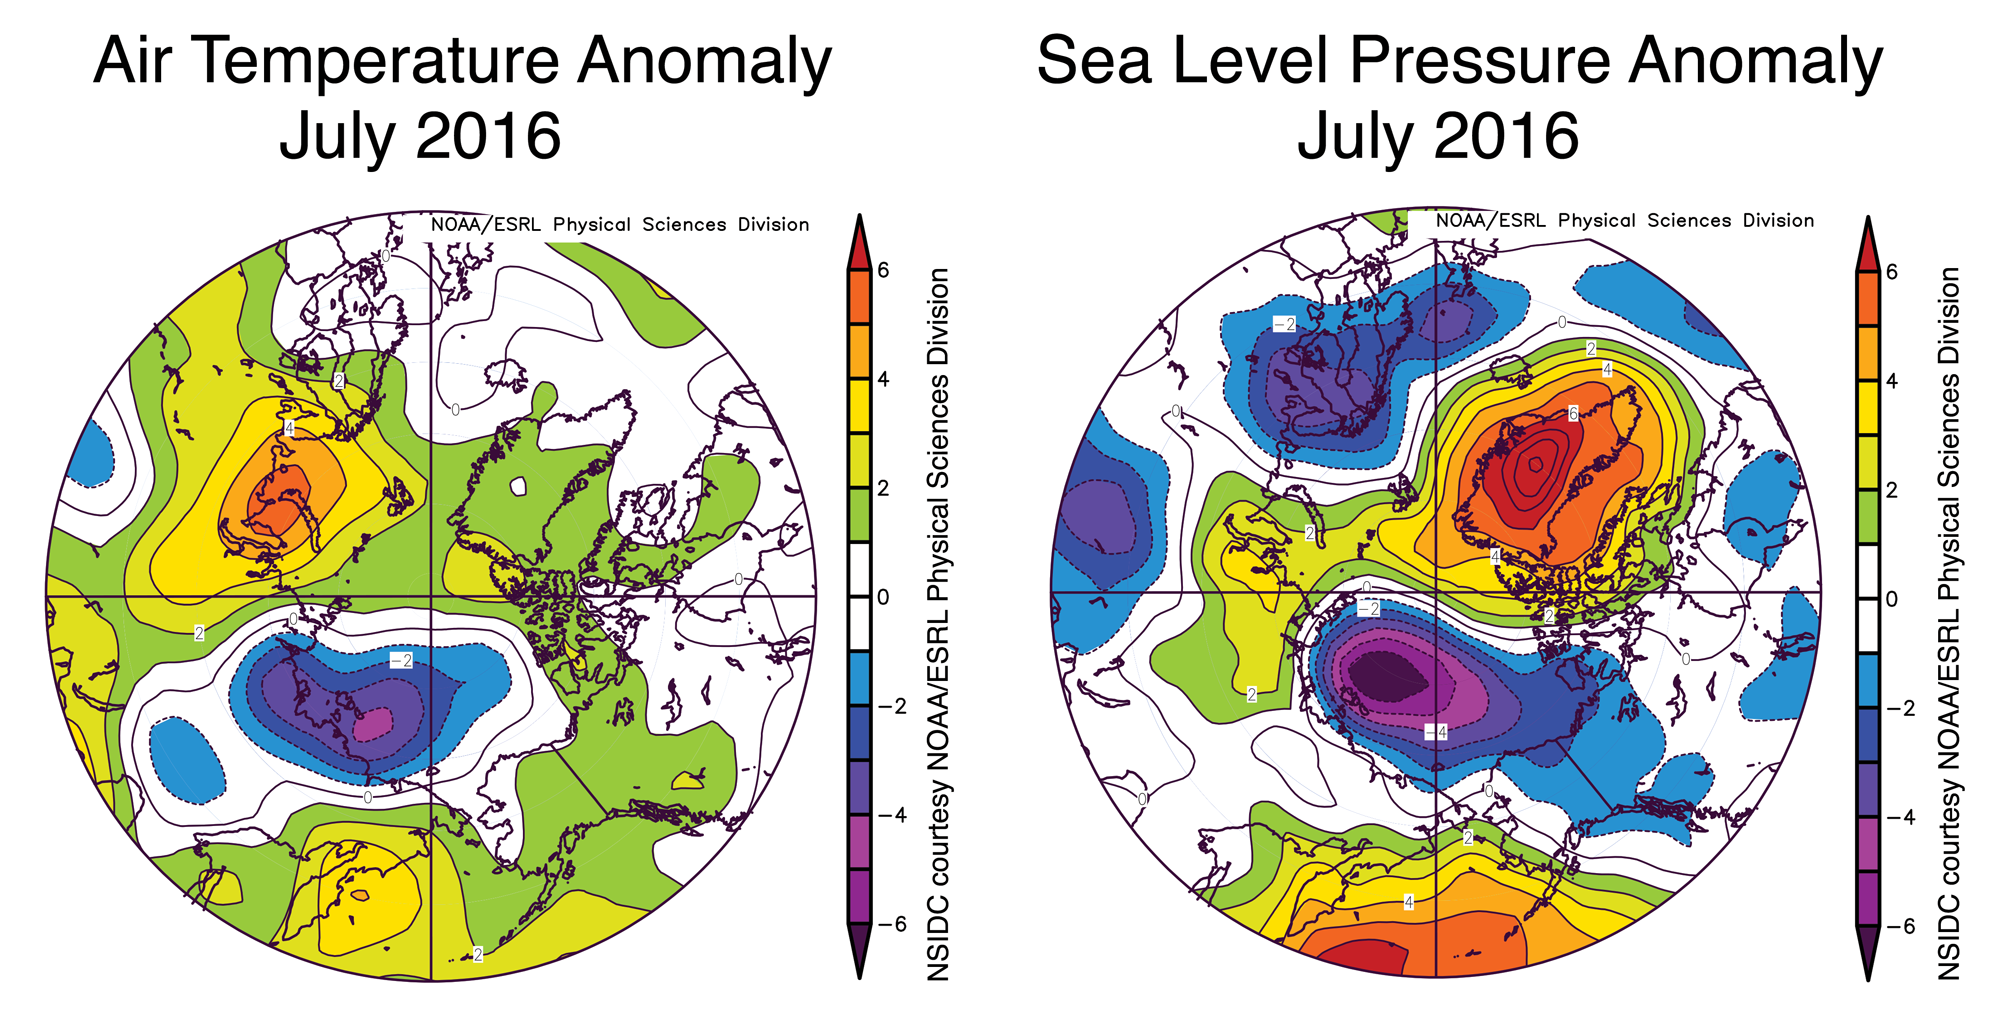
Figure 2b. The plot above shows July 2016 Arctic air temperature anomalies at the 925 hPa level in degrees Celsius and sea level pressure anomalies. Yellows and reds indicate higher than average temperatures and pressure; blues and purples indicate lower than average temperatures and pressure.
Credit: NSIDC courtesy NOAA Earth System Research Laboratory Physical Sciences Division
The rate of ice loss during July 2016 was slightly below average at 83,800 square kilometers (32,400 square miles) per day. The 1981 to 2010 average rate of ice loss for July is 86,800 square kilometers (33,500 square miles) per day.
Warm conditions with temperatures at the 925 hPa level of 1 to 2 degrees Celsius (2 to 4 degrees Fahrenheit) above average graced the northernmost coasts of Alaska, Canada, and Greenland, but the thick sea ice that is typical of this region is unlikely to melt out. Very warm conditions continued in the Kara and Barents seas, with temperatures as much as 3 to 6 degrees Celsius (5 to 11 degrees Fahrenheit) above average, consistent with the retreat of the ice cover to the northern edge of the Svalbard, Franz Josef, and New Siberian Islands. However, the main feature of the climate conditions for the month was a large area of below-average pressure centered over the Laptev Sea, and associated cooler than average conditions in the same area (1 to 4 degrees Celsius or 2 to 7 degrees Fahrenheit). This continues the pattern seen in June, with conditions unfavorable to pronounced sea ice retreat: cloudy and cool, with winds that tend to disperse the ice and increase its extent, rather than compact it.
July 2016 compared to previous years

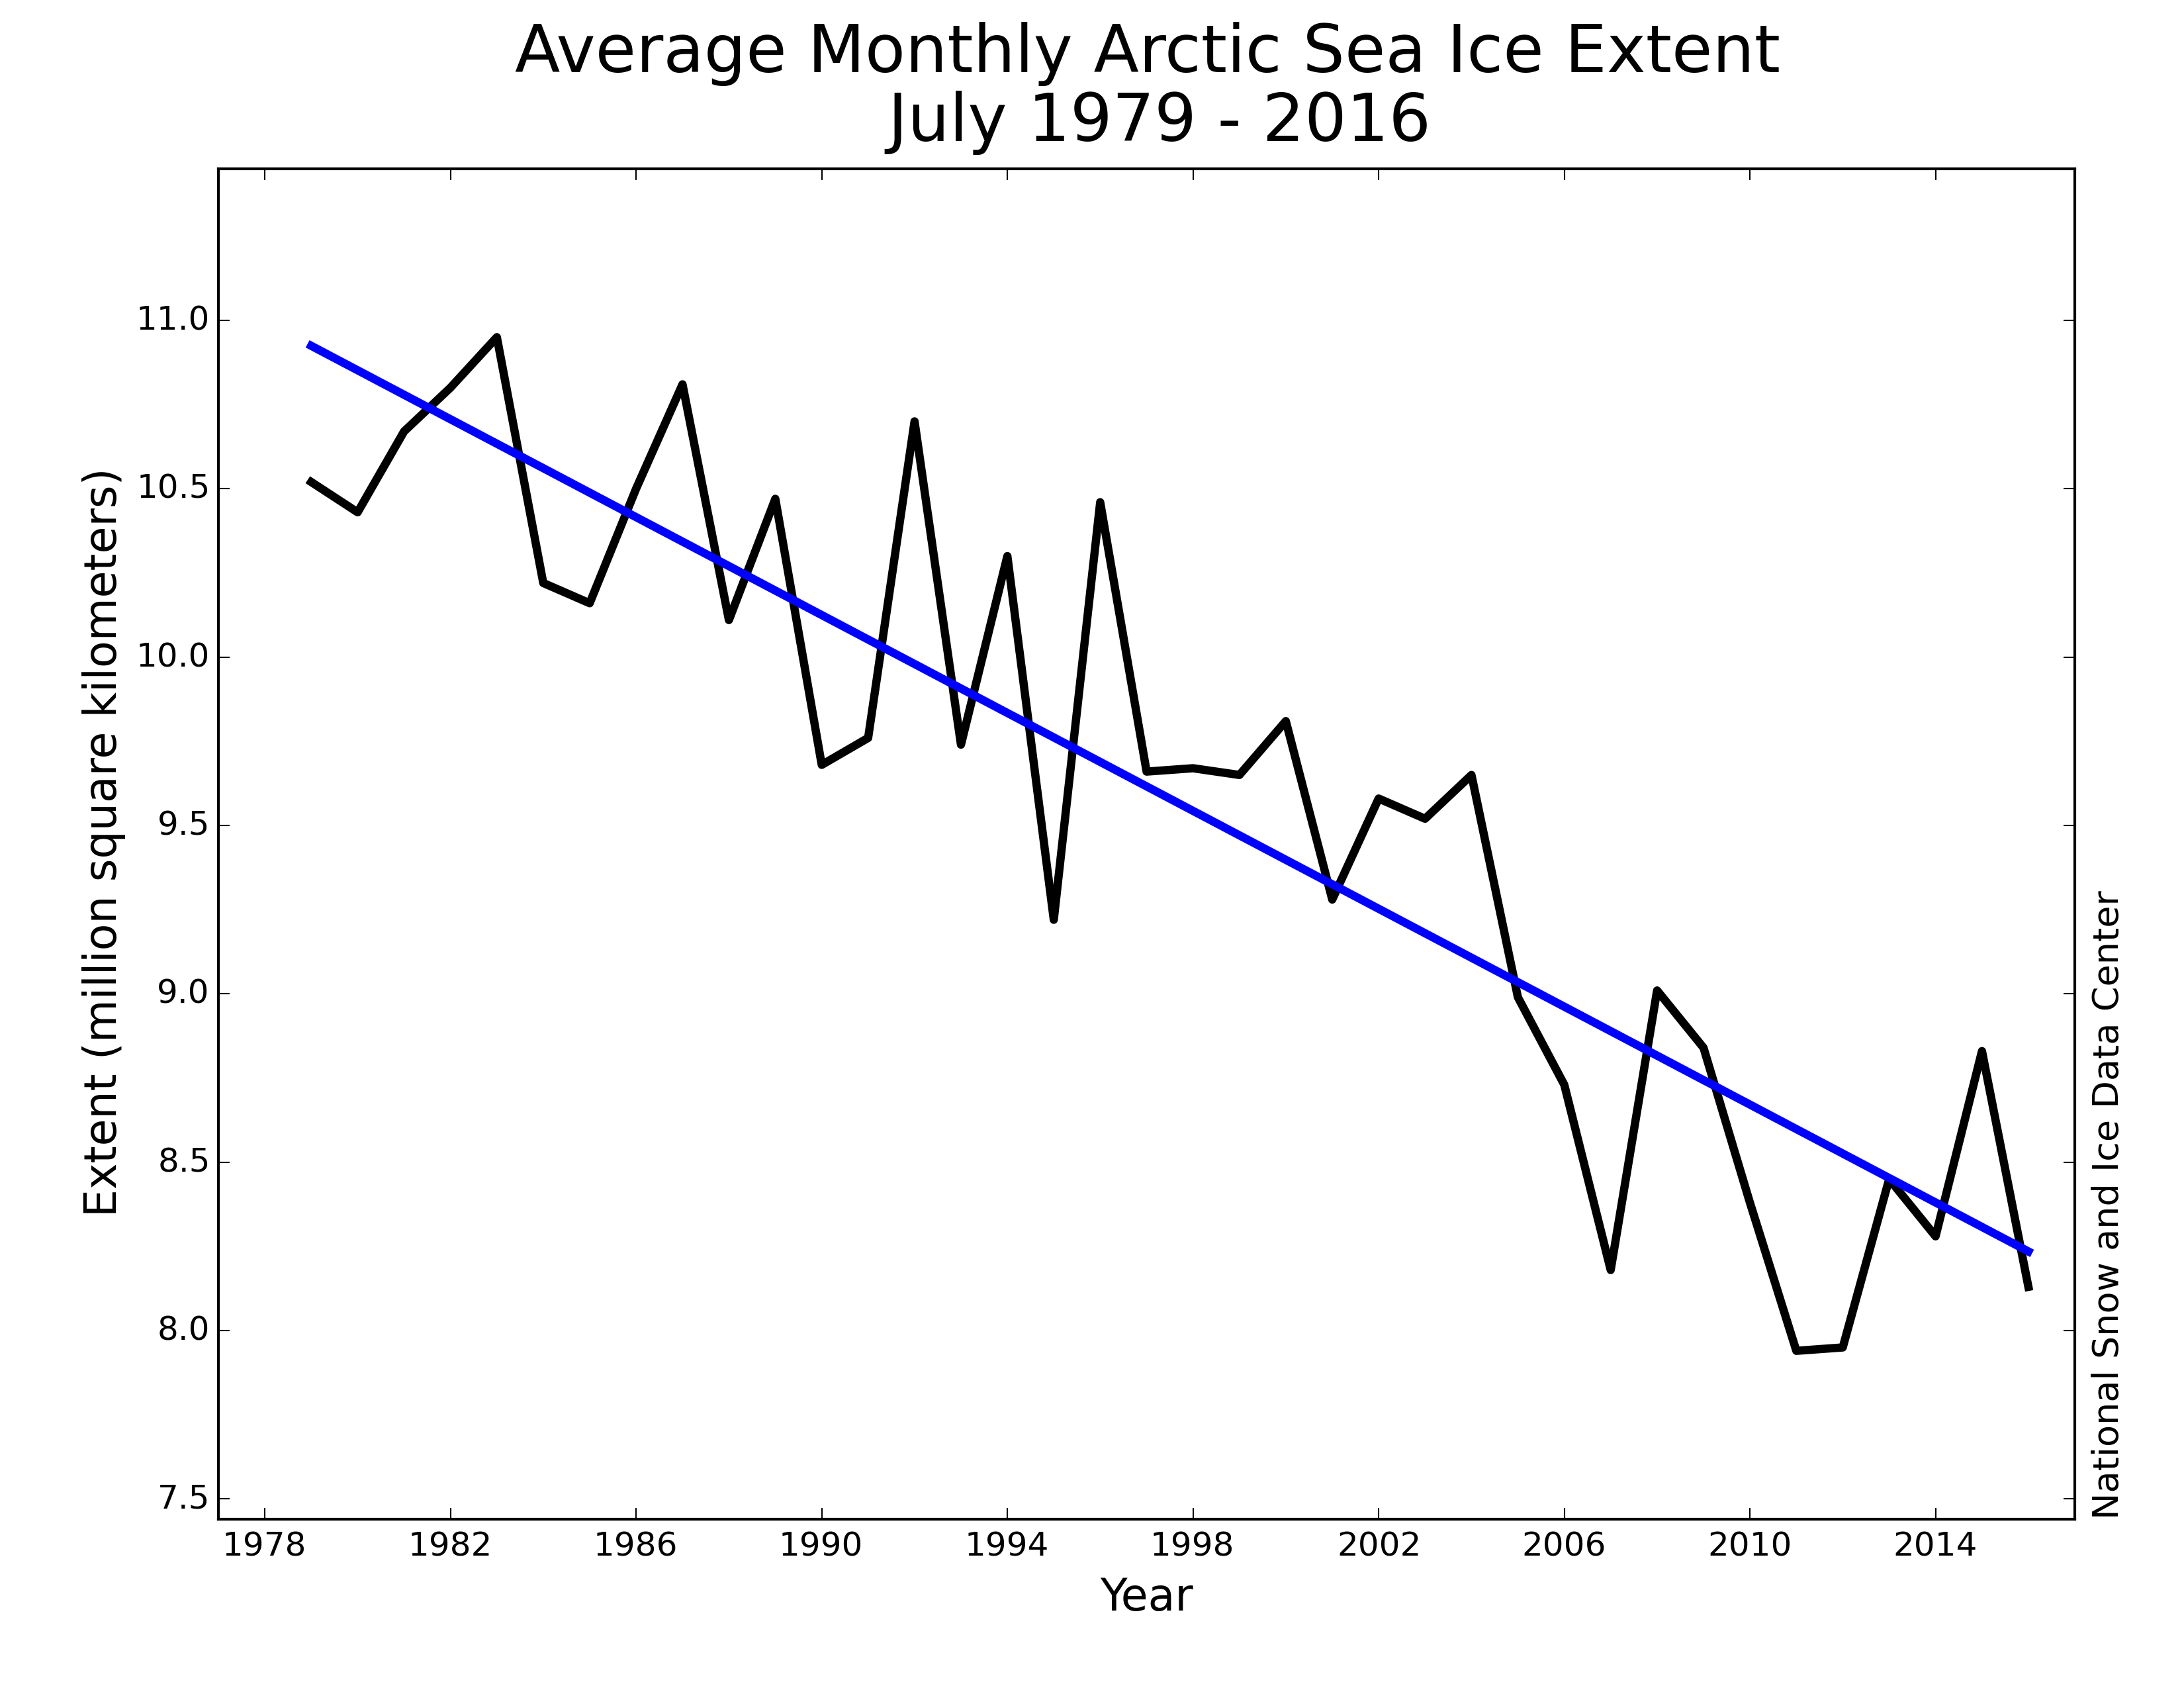
Figure 3. Monthly July ice extent for 1979 to 2016 shows a decline of 7.3 percent per decade.
Credit: National Snow and Ice Data Center
Through 2016, the rate of decline for the month of July is 72,700 square kilometers 28,070 square miles) per year, or 7.3 percent per decade. July extent remained above 2011 and 2012 levels throughout the month, but it was below the 2007 extent for the first half of the month.
A shift in pressure
Beginning in June there was a significant change in the atmospheric circulation over the Arctic. May was characterized by high pressure over the Arctic Ocean which had persisted since the beginning of the year. However, in June the pattern shifted to lower than average pressure. This brought clouds and fairly low temperatures to the region, slowing ice loss. The change in circulation also shifted the pattern of ice motion, slowing the earlier movement of ice away from the coast in the Beaufort Sea (as depicted in ourMay 3rd post).
This pattern shift is associated with the development of a large and persistent area of moderate high pressure over the northeastern Pacific (south of Alaska) that formed beginning in mid-May. This may be related to an ongoing shift in the Pacific Decadal Oscillation over spring and early summer this year.

Figure 4. These graphs show sea level pressure anomalies or differences from average sea level pressure in the Northern Hemisphere for April, May, June, and July 2016.
Credit: NSIDC courtesy NOAA Earth System Research Laboratory Physical Sciences Division
More here in there complete post: https://nsidc.org/arcticseaicenews/2016/08/a-cool-and-stormy-arctic-in-july/
Anyone might think that the scale for fig3 had been chosen to create the impression that the ice was about to disappear.
Mathematically, Fig 3 is almost certainly the equivalent of the first pi radians of a cosine function.
Zero year is the 79-80 winter, where it was maximal in the satellite record.22-26 years from now, the Alarmists will be back on the global cooling scare bandwagon, ala 1975-76.
Yup, the AMO does do that, doesn’t it. The northeast passage was open from the late 1930s into the 1940s. The northwest passage was also navigated in the same period. The northwest passage seems to be a bit less sensitive to the AMO however.
Mathematically, Fig three almost certainly looks like diddley squat, and the blue line on top of it is not a good fit, and doesn’t come close to matching the up and down movements of the real thing.
A typical case of throwing away real information and replacing it with total fiction.
g
1979 / Nimbus-7 is a convenient starting year for sea ice alarmism, as illustrated in the IPCC’s First Assessment Report (“FAR”).
Sea ice extent (F.A.R.), based on data starting with Nimbus-5:
http://sealevel.info/ipcc_far_pp224-225_sea_ice2_1979circled_50pct.png
There’s no graph like that to be found in the TAR, AR4, or AR5.
U.S. Temperatures, Hansen et al 1999:
http://sealevel.info/fig1x_1999_highres_fig6_from_paper4_27pct_1979circled.png
(Note: I added the red circles.)
Striking polar see-saw effect at 1976.
Yes, indeed, it’s a very beautiful cosine function.
with a little mixture of log, and a pinch of arctangent.
or maybe it just goes down.
daveburton
Well, forget 6 years and make it starting in 1985…
PS : your red circles are very nice. Very beautiful.
For the uninformed, it is absolutely essential to have periods of sea ice that are slightly lower than average.
This comes about because there are also periods of sea ice slightly above average, and if that wasn’t counterbalanced by the lows, that would result in a shift of the average.
It doesn’t really matter if the average shifts since we never observe that happening anyway.
g
Not only that. See ice cover is 50% of the time below average.
I remember president Reagan was rather upset when told that 50% of Americans were of average intelligence or lower. I suspect he belonged to that group as well.
Even Fig 2a uses a scale that should have zero as the origin. There is no excuse for such unscientific behaviour.
It has AMO written all over it.
Oh dear. Sad news for the Alarmists. Oh well, maybe they’ll get lucky and a really big hurricane will hit the US mainland.
Not really. The people they most want to influence live in areas that are right now suffering through one heck of a heat wave. The vast majority of those people will never be informed that there are other areas of the world where the temperature is below normal. They are too hot, so the world is too hot.
What heat wave? …https://earth.nullschool.net/#current/wind/surface/level/overlay=temp/orthographic=268.11,41.46,819/loc=-98.265,34.497
I’m sure there will be news articles all over the world retracting the earlier predictions of new record lows. /sarc. I propose a moratorium on all predictions of this type, including this present one..
I really feel for the poor souls who love Arctic sea ice so much that they want it to disappear.
Maybe the disease of Climate Change Personality Disorder should enter the psychiatric literature.
Or Climate Change Psychosis….
What about the poor souls (idiots) like me who live in northern climates and want to see the ice increase just to prove the experts wrong? Do we get our own disorder?
No you’re OK. You’re used to it and will probably enjoy the extra cross country skiing and ice fishing.
Saying they “want it to disappear” is a gross corruption of what they really think. It says much more about those who dispute their evidence.
Ha ha, tony mcleod resembles that remark !!
Amongst the Warmistas and Alarmists, there is much wailing and gnashing of teeth and prayers for a hot autumn and winter.
Yesterday I read a media story which stated that the NWS was expecting above average temps across most of the nation including for the Pacific Northwest. I will be greatly surprised if that turns out to be correct. Look at the change in ssta off of the coast. The last 3 years the coastal waters were all substantially warmer than they currently are. …https://earth.nullschool.net/#current/ocean/primary/waves/overlay=sea_surface_temp_anomaly/orthographic=-129.30,35.86,819/loc=-125.206,41.228
We have to have periods of above average Temps, to balance those times where we have below average temps.
You can’t have one without the other, and they don’t seem to realize that.
Nobody know when the temperature is average any how. When was the last time you remember the temperature having its average value ??
g
g
I go by what Intellicast shows as an average for any location. I see what you are getting at though. Thanks,
Nuts, stole my line….
The period from 1940 to 1974 saw global temperature declines and increased ice. From 1974 to 2003 was conveniently a warming period for Al Gore and the ice decline. Since 2003, global temperatures have been flat and are starting to decline again. If the ice extent chart here were segmented at 2003, the two lines would be consistent with the temperature charts, and extrapolation into the future would not erroneously predict further declines, as this chart regression line does. Instead, it would predict some increase in sea Ice as is happening, especially as the El Niño hot water bubble in thevGulf of Alaska we saw form last year has disappeared. Dramatically increased ice will be undeniable by 2020. See Paullitely.com.
Personally, I think the only reason the temps have been flat since 2003, is because of coordinated weather services attempts to goose up the numbers to make it look like the temps aren’t declining.
Here is a proper graph graph depicting what has happened in the Arctic over the years. It certainly leaves one with a different impression as compared to looking at NSIDC…http://arctic.atmos.uiuc.edu/cryosphere/IMAGES/seaice.anomaly.arctic.png
That chart shows the bogus high 2016 values, that were due to satelite sensor failure. Please find a better one.
I understand that. Still the trend prior to the sat failure makes the point I wanted to show.
Earlier this month, NOAA at NSIDC published a new compilation of Arctic sea ice extent using a variety of historical sources, including whaling ship reports and several historical ice chart series from Alaska, the Russian Arctic, Canada, and Denmark. The compilation provides a synthesized mid-monthly estimate extending back to 1850. The study concludes that the current downward trend in sea ice has no precedent in duration or scale of ice loss since 1850. With the exception of the Bering Sea, none of the areas have seen sea ice extents as low as in the past decade. Historical periods that show a decrease in summertime sea ice extent in the Arctic, such as the late 1930’s and 1940’s, are smaller in magnitude than the current downward-trending period.
https://nsidc.org/data/g10010
Griff, put a plot of the number of icebreakers operating in the Arctic ocean against the one from nsidc. In any other ‘pristine’ ecology greens would be protesting vehemently against the destruction of the environment. But when it is icebreakers breaking up the ice so the greens have their cause celebre supported, they are somehow silent.
It’s nonsense, British Naval reports pre 1900 talk of 2000 leagues of open sea where there was ice before, many reports of the arctic passage being open in late 1800s and early 1900s.
As usual NSIDC cherry pick their reports and forget massive amounts of reports that dont fit their agenda
“Unprecedented”, yeah that’s why crocodiles lived in the arctic. Sure
Ian the NSIDC tell us icebreakers are not a factor. They should know -they’ve been studying the ice since 1957.
https://nsidc.org/cryosphere/icelights/2012/04/are-icebreakers-changing-climate
Mark – you can follow the link and get the data.
Really if you examine all the records, we’re lower than at any time since 1850.
all the records were consulted -all the Danish records from their institute going back into the 19th century, the whaling records, etc.
I also recommend the conclusion from Dr Judith Curry’s extensive historical survey of ice conditions:
https://judithcurry.com/2013/04/10/historic-variations-in-arctic-sea-ice-part-ii-1920-1950/
“The 1920-1940’s arctic sea ice melt can therefore be seen as remarkable, albeit the caveats about apples and oranges need to be applied. Looking at the evidence available from each of the arctic oceans means the ice extent probably lies somewhere within that experienced during the first half of the 2000’s, but was probably not as low as 2007 and 2012.”
and we haven’t recovered to pre 2007 ice conditions yet…
Good
You need to remember that an unusual invasion of low pressure into the Arctic helped break up the floating ice in 2012, substantially contributing to the record September open Arctic of that year. Add to this the Greenland “ice melt” of July 12, 2012 and the incursion of that very warm air into the Arctic zone, and the meteorology was set up for the 40% open Arctic of that year.
No such luck this year. The flattened Jet Stream kept warm air to the south of Greenland. Countering this, warm ocean currents flowing through the gap between Spitzbergen, Bear Island, and Norway still contributed to what may become the second greatest September open Arctic.
Each year is different; this year is no exception. The differences are fascinating!!!
What is fascinating is that with a poor June melt season we have seen such a great break up of arctic ice and still have conditions which are on course for a second/third lowest, beating 2015…
So what? We’ve had less ice in the past and no doubt we’ll have less ice at some point in the future.You have no proof that isn’t just natural cycles.
Get over it Griff, the general public couldn’t care less.
Joe Bastardi also has some notable observations on this year’s Arctic ice record in his Saturday summary at Weatherbell analytics. Worth a watch.
That’s Joe Bastardi whose arctic sea ice predictions have twice now failed to come about?
Shall we stack up the failed ice claims and see where the balance is lol. The m0r0n5 will be off again, 12 months of “no ice in the arctic in 2017”.
What about Wadham’s hopeless “no ice next year” predictions?
Frequently misquoted though he is, Wadhams has been studying the ice in detail for a long time and he is sadly going to be proved right about it going before the decade is out.
Chaos precludes prophecies and predictions. They should stick to forecasting inside limited frames of reference (i.e. scientific domain). Science does not entertain professional oracles.
We have a variety of ” Laws ” in Science, specially in Physics, and maybe chemistry too. These laws usually tell us what the likely result of an experiment will be relating to those laws.
The thing that characterizes these laws of science, is that our tolerance for discrepancies between what we observe and measure, quite often with exquisite accuracy, and what those laws say, is extremely limited to a small space around zero.
In fact any repeatable demonstration of a consistent difference between what we observe and our laws relating to that phenomenon, is grounds for scrapping the law, or at least modifying it in such a way that the discrepancies are resolved.
Compare this approach with what happens in climate science, where people make up laws based on statistical prestidigitation performed on presumably observed climate observations.
This amounts to little more than curve fitting, and the discrepancies between such laws, and the observations, is laughable.
And as often as not the process of eliminating the discrepancies, amounts to simply doctoring what was previously reported as actual measured observational data.
And somehow, this still passes in some minds, as Science.
Amazing !
G
The disappointment is palpable.
Arctic Ice Extents follow PDO and AMO 30-yr warm/cool cycles; especially AMO cycles.
The PDO has already entered its 30-yr cool cycle and the AMO enters its 30-yr cool cycle from around 2020.
La Niña conditions will substantially increase Arctic Ice Extents for the next two years, and the closer the AMO comes to entering its 30-yr cool cycle, the more Artic Ice extents will recover.
“The Blob” also contributed to Arctic Ice Loss over the last 2 years, and still has not disappeared entirely.
When Arctic Ice Extents start to show obvious increasing trends, it’ll be yet another CAGW projection that has failed miserably.
I thought that by now there was not supposed to be any ice, or snow either?
New Zealand has apparently rediscovered snow and cold…http://www.nzherald.co.nz/nz/news/article.cfm?c_id=1&objectid=11689028
My fave line:
With a min of -9.8°C Monday, Mt Ruapehu (Chateau) had its coldest morning in over 25 yrs (since 14-06-1991) #climate
Nah, they already have a backup for the next ice age (falling temps) as also being caused by CO2. So they’ll just switch to that meme to keep the public money rolling in.
“A new record low September ice extent now appears to be unlikely.”
Oh, the humanity!
Oooo. I’m terrified. Especially since the increasing Antarctic sea ice is caused by global warming, just as is the warming west Antarctic peninsula, and the cooling remainder of Antarctica, record cold winter in New Zealand, the hot summer in North America, the drought in the American west, the floods in the southeast, the normal tornado amount, the Atlantic hurricane drought, the super typhoons in the pacific, and, of course, is certainly the cause of Donald Trump being a presidential candidate….
Antarctic sea ice fell back to the norm almost one year ago, and has stayed at the average trend line since then.
I can’t help but wonder if the main reason for the record low months for much of this year had to do with the satellite going on the blink. Here in Northern California temps have certainly gone into a cooler than the normal mode after the very short heat wave from several weeks ago. Last night temps went down to 52F, which is great except for setting the tomatoes back a bit. What a difference between this summer and the last 5 summers.
Another temperature result
In Langley, BC, Canada
July 2015 Avg Low 14.0 Avg High 26.9
July 2016 Avg Low 13.4 Avg High 23.7
I always thought a polynya was a persistent hole in the ice, not just a hole that pops into existence during the melt season.
https://www.britannica.com/science/polynya
Polynya, also spelled polynia, a semipermanent area of open water in sea ice. Polynyas are generally believed to be of two types. Coastal polynyas characteristically lie just beyond landfast ice, i.e., ice that is anchored to the coast and stays in place throughout the winter. They are thought to be caused chiefly by persistent local offshore winds, such as the foehn, or katabatic (downward-driving), winds typically found off the coasts of Greenland and Antarctica. Open-ocean polynyas, the larger and longer-lasting of the two types, form within the ice cover and are believed to be caused by the upwelling of deep warmer water. This type is best exemplified by the vast Weddell Polynya in the antarctic Weddell Sea.
Right. So how can they talk about polynyas developing? Don’t they have to wait long enough to make sure they aren’t just temporary before they can call them that?
I don’t think there is any time limit involved. If the wind blows off shore, and moves the sea-ice away from shore, it is a polynya even if it lasts five minutes. The thing to keep in mind is that the open water is not due to ice melting. It is due to ice moving.
So will the cruise ship transit the North West passage? It does have an ice breaker tagging along, analogous to have fossil fueled generators backing up bird slicers and roasters.
They are very worried atm that they wont get out of there. They also seemed amazed (on their blog) that polar bears are good swimmers, given polar bears spend most of their life sleeping or swimming, hardly surprising.
It seems the econuts know least about those majestic creatures
That is nothing to do with the cruise ship shortly to leave alaska to transit the NW Passage. The account about the polar bears refers to the yacht attempting a circus polar voyage in one season, they are currently waiting for the main bottle-neck en route (the Vilkitsky Strait), they are about a week ahead of the last yacht to make the trip a few years ago). Their blog also indicated that they were aware of the swimming abilities of the bears but thought they could out pace the mother bear in their outboard. I saw no indication of amazement, in fact the blog said: “A hungry bear can do a pretty mean breast stroke.”
Should be circum-polar of course, damn spell checker!
yes…
the southern NW passage has been intermittently open since July 31st and now has a clear passage:
Good – surely better for shipping
“Record low?” I thought it was all gone by now.
Remember, the only signal that matters is the current one that is “catastrophic”. Alarmists jump to the next one like fleas in a dog pack.
If the minor (not the major mind you) sucking singing siphoned simple (not the complex kind) salamander were in some kind of trouble, THAT would be the current canary in the goldmine, got it?
I love me some alliteration.
Whew! I thought you might mention similar sibilant sibling symbiont sophists as well. Glad you did not…
Is the Polar Ocean Challenge still stuck in Murmansk with all its alarmist passengers, unable to proceed due to ice blocking the way?
Anchored in a cove on an island near the ice choked Vitilsky Strait. Unable to proceed yet into the Laptev Sea. And running out of vodka.
They now appear to be stuck in the Nordenshel’da Archipelago just at the start of the Vilkitsky strait. In more somber news, they are almost out of wine and vodka.
The suffering! But I’m sure George is right.
They will get supplies via air drop. Russia always treats valued guests generously.
But the poly bars appreciate fine cuisine delivery.
Wind, clouds, pressure systems???…..and that was stronger than global warming! get out
Extent…and not one word about thickness/volume
Because that is recovering nicely.
..that’s the way they play the game
Do you have a source for that?
Ice thickness is well up on last year
Source?
it isn’t really….
http://polarportal.dk/en/havisen-i-arktis/nbsp/sea-ice-extent/
click on date and animate to compare.
The 2016 ice is much more broken up…
Griff: extent and ice volume are two different metrics.
In general, since the satellite records began in fall 1979, the much-repeated “arctic death spiral” of warmer arctic air temperatures melting sea ice, which abosrbs more sunlight (energy) which heats up the arctic ocean and melts more sea ice …. Simply put, this theory can be easily stated, but it just has not happened in the real world.
Not happened from season to season – though yearly maximum, average and minimum levels have decreased in an apparently almost-sinusoid-type cyclical pattern.
Not happened spring-to-fall, not fall-to-spring.
Instead, the opposite has happened. A very high spring sea ice extents (high anomaly compared to the average) is usually followed by a very low fall sea ice extents. (Spring 2012 was at a satellite record high extents! 2007 arctic sea ice extents was also high compared to the 5 years around it, to cite the two record LOW fall sea ice extents.
This year, the 2015 arctic sea ice anomaly in March-April was high – bouncing right up and down across the -2 standard deviation line from the “established” 1979-2010 trend. (So it was essentially (though not exactly!) “near average” and “within natural variation” from the average. )
Then, June-July, it was remarkably low.
Now, the “experts” are claiming the Sept minimum will be again back near average deviations from the established normals.
A good test of the importance of Arctic sea ice is the following.
The entire area of Greenland is 2.06 million square kilometers, almost all of it covered in light-reflecting ice and snow.
This massive area of highly reflective land ice and snow lies between 60 north and 80 north. All year. (Obviously Greenland’s land-locked ice caps do not move north and south with the seasons.)
The less reflective (much darker) sea ice and melt water ponds of the Arctic sea ice lies much further north (less sunlight per square meter of flat surface, lower sunlight angles and more atmospheric absorption, more days of complete darkness) lies between 70-71 north latitude (at maximum sea ice extents) and 80-81 north latitude at minimum sea ice extents.
Only three relatively “small” isolated areas of sea ice in Hudson Bay (1.0 Mkm^2 at 60 north) and the Sea of Octkosh (also 1.0 Mkm^2 at 59-60 north general latitude) and the Bering Sea are below 71 north latitude. And those three areas melt out EVERY year in mid-summer, and thus do NOT affect the mid-September arctic sea ice minimums so greatly advertised by the alarmist community press released hydrophobic-“experts” …
Compare, for example, the latitudes shown at maximum, and at minimum for two years.
http://nsidc.org/arcticseaicenews/files/2016/05/ASINA_May_Fig4a.png
Now, several times in the satellite era of actual recorded sea ice extents, the arctic sea ice anomaly has jumped – both jump up and jumped down – several times by more than 2.5 Mkm^2 of sea ice, more frequently by 1.0 Mkm^2, 1.2 Mkm^2, and even more than 1.5 Mkm^2 of sea ice in a very short (4-8 month) period. And there was NEVER any consistent response to those jumps – neither positive NOR negative! – in the following 6 months, 9 months, or 12 months after a loss (or gain!) of sea ice of more than the entire area of Greenland. If a gains in arctic sea ice in vvery short period is supposed to reflect more solar energy and thereby prevent heating of the arctic ocean, then a gain of millions of sea ice extents in 4 months “should show” even cooler waters, and even more sea ice gain, right? If a loss of sea ice is supposed to heat up the newly exposed arctic ocean waters, then a loss of 2 Mkm^2 square kilometers should be followed by an even larger loss the next melt season, right? It doesn’t happen. Sea ice extent anomalies regain their previous high!
http://arctic.atmos.uiuc.edu/cryosphere/IMAGES/seaice.anomaly.arctic.png
Now, if an area about the size of Greenland can frequently vanish (or reappear!) that quickly and NOT have any consistent effect on the sea ice the following part of the next year, then either Greenland has no effect on the Arctic ocean’s heat balance, or the arctic sea ice has no real effect on the arctic ocean’s heat balance. Or both.
The simplified theory of arctic sea ice heat absorption and sea ice extents sounds good. It just does not appear to actually work in the real arctic world.
If there is an “Arctic amplification” – or an arctic death spiral as some alarmist term it – it may be present further south – closer to the equator, but it has not observable effect 6 months after each time the real world “tested” its theory up north. (Clever observers should immediately begin applying for government grants to study the relative rates of floating sea ice in the waters off of LA, Miami, Hawaii, Barcelona, and Key West, for example, to verify the arctic death spiral really can be measured.)
in my opinion, and based on my calculations of sea ice albedo over the full year, the solar elevation angle of the sun over the year, and the location of the arctic and antarctic sea ice over the year, the reason the “experts” are failing is that they persist in only using simplified “average” values for all of the above that ARE ONLY VALID below 60 latitude. And there is only year-round sea ice at 60 degrees latitude is around the Antarctic continent.
Because we are still seeing frozen in time vegetation being uncovered by ice sheets in Greenland, we may not be at the end of ice melt. On the other hand, is this the signal, this little sudden plunge in anomaly (or one of the signals) during the interstadial warm period that flags an impending jagged downward slide to a glacial period? As if to signal the last burst of warm sea surface temperature that has migrated to the polar steam vent before the ocean switches to net recharge mode?
So what is causing the dang thing to shrink?
Equatorial warmed water finally migrating, as it should, to the polar regions where it loses heat to the atmosphere. Atmospheric teleconnections that work in concert to melt ice. If we didn’t have these vents, we would fry, and if we didn’t have solar heating at the equator with currents that transport that heat to the polar region, we would be a showball.
Many, especially extreme warmistas, miss the fact that there is a serious ice pile up along the northern shores of Greenland and Canada. It’s subduction and obduction of ice, creating a multi-layered structure that is exceedingly thick. That volume is like the ice boxes of yore. I actually worry about it, vis a vis factors that will ultimately end the interglacial.
Even that piled-up ice is in motion, and spreads like butter over bread along the coasts, and a lot escapes through Fram Strait down the east coast of Greenland, a little through Nares Strait down the west coast of Greenland, and the rest moves east in the Beaufort Gyre and either gets used up cooling Pacific water entering via Bering Strait, or continues on to the coast of Siberia and then crosses the Pole a second time, and smashes up against Greenland and Canada yet again.
Few people understand how mobile the sea-ice really is. It is an ocean, not a frozen lake.
On a day too hot to work, watch the time-lapse movie of O-buoy 9’s voyage from the Siberian side, across the Pole, up against Greenland (with the distant mountains visible), and then down through Fram Strait. It will change your ideas about how open “open water” is, and how amazingly mobile the geology of ice actually is.
http://obuoy.datatransport.org/monitor#buoy9/movie
See on the sea ice anomaly chart how the March maximum extent relatively increases from 2008-2013 following the reduced September minimum’s of 2007-2012. That is a negative feedback in action.
RACook says:
….several times in the satellite era of actual recorded sea ice extents, the arctic sea ice anomaly has jumped..
No kidding. What’s up with this? :
http://arctic.atmos.uiuc.edu/cryosphere/IMAGES/seaice.recent.arctic.png
(source)
That area ‘anomaly’ seems to be dragging down global ice cover (in red) :
http://arctic.atmos.uiuc.edu/cryosphere/IMAGES/global.daily.ice.area.withtrend.jpg
We need answers! Summoning seaice1…
They lost a satellite around the end of March so most of those charts aren’t accurate any more.
When is the cryosphere today expected to be up ?
That’s been explained a number of times here. A satellite failed. It is clearly obvious from the graphs exactly when that happened.
This issue has been dealt with on WUWT, it is a DMSP satellite failure. Neither of those graphs are accurate anymore.
See: https://wattsupwiththat.com/2016/04/13/problems-with-satellite-sea-ice-monitoring-confirmed-by-nsidc-no-timeline-for-fix/
Well, the Cryosphere sea ice reports from the University of Illinois, which used to be useable and functional, started having problems (overnight jumps of millions of sq kilometers – in April this year, and they stalled out and have not changed since May 5.
NO useful data is comping from them at all recently, but I’m sure they have not refudned any of that budget they still receive. Blah.
RACook says:
…Cryosphere sea ice reports from the University of Illinois, which used to be useable and functional, started having problems (overnight jumps of millions of sq kilometers – in April this year, and they stalled out and have not changed since May 5. NO useful data is coming from them at all…
So, why are these charts still being posted every day? Did someone just turn on the Cryosphere autopilot in April, and walk away?
Posting an explanation in place of a totally erroneous chart would be a lot more professional than ‘updating’ and posting these bogus charts every day. And if we look at their home page, we see that the errors propagate through many of their other charts. For example:
http://arctic.atmos.uiuc.edu/cryosphere/arctic.sea.ice.interactive.html
Another “recent” example:
http://arctic.atmos.uiuc.edu/cryosphere/IMAGES/seaice.recent.antarctic.png
Is anyone awake there?
dbstealey August 7, 2016 at 9:08 pm
RACook says:
…Cryosphere sea ice reports from the University of Illinois, which used to be useable and functional, started having problems (overnight jumps of millions of sq kilometers – in April this year, and they stalled out and have not changed since May 5. NO useful data is coming from them at all…
So, why are these charts still being posted every day? Did someone just turn on the Cryosphere autopilot in April, and walk away?
Posting an explanation in place of a totally erroneous chart would be a lot more professional than ‘updating’ and posting these bogus charts every day.
Which, of course they have done for quite some time, in red text at the top of their home page:
“Special Sensor Microwave Imager and Sounder (SSMIS) on the Defense Meteorological Satellite Program (DMSP) F-17 satellite that provides passive microwave brightness temperatures (and derived Arctic and Antarctic sea ice products) has been providing spurious data since beginning of April. Working on resolving problem or replacing this data source.”
See http://arctic.atmos.uiuc.edu/cryosphere/
Calculations based on the F18 satellite show an current area of ~3.6 million sq km.
Phil.,
What didn’t you understand about:
Posting an explanation in place of a totally erroneous chart…
Do you just like to argue by ignoring the key words?
Here is a DMI comparison with last year. (4th August)
Let your eyes be the judge.
not sure if we can continue to compare dmi images from years past andy. they now have a new operational “product” for extent graphs that uses a different algorithm . apparently only small differences with previous method ,would like to see them shown in comparison graphs to see how small though.
not sure if this affects the volume charts . personally i believe the volume “models” of all the agencies producing them are complete junk. they certainly do not show any of the 10m to 50m thick ice that can be seen in any number of photographs taken on various arctic voyages.
having said all that, as bill illis notes below,the ice is more broken up this summer than the previous two.
I see a lot more red and yellow, so that means the ice is getting hotter, doesn’t it?
Or use the Russian image
http://www.aari.ru/odata/_d0015.php?lang=1&mod=0&yy=2016
Try again
note that the Russian image is pretty similar in area to the DMI image
Thing is that biodata from places like Fram Straits shows that for much of the first 3/4 of the Holocene the Arctic was often pretty close to ice free in summer.
If we also look at the Iceland sea ice index we can see that the 1970’s was actually a time of EXTREME sea ice levels, nearly as high as those coming out of the Little ice age in the late 1800’s.
So the small drop since 1979 is actually a RECOVERY from a period of EXTREME sea ice cover, back partly toward the Holocene norm..
Nonsense!
Let’s look at recent history…
Earlier this month, NOAA at NSIDC published a new compilation of Arctic sea ice extent using a variety of historical sources, including whaling ship reports and several historical ice chart series from Alaska, the Russian Arctic, Canada, and Denmark. The compilation provides a synthesized mid-monthly estimate extending back to 1850. The study concludes that the current downward trend in sea ice has no precedent in duration or scale of ice loss since 1850. With the exception of the Bering Sea, none of the areas have seen sea ice extents as low as in the past decade. Historical periods that show a decrease in summertime sea ice extent in the Arctic, such as the late 1930’s and 1940’s, are smaller in magnitude than the current downward-trending period.
https://nsidc.org/data/g10010
Griff, you are embarrassing yourself.
I’m embarrassing you Mark…
There’s objective evidence of a continued sea ice decline, lowest for over 150 years… the ice is not in a good state.
I wonder why you are sniping at me rather than offering evidence?
Are you telling me we have recovered to pre-2007 ice levels?
So the vikings may resettle green land. Ship the cattle on ferries and weekends flights home.
I see this viewing of things as if the people involved are children playing a game where they look at the world through the cardboard core of a toilet roll.
Imagine a group of stone age hunter gatherers who finally arrive at the coast of a continent to see the new wonder of their world, the sea. How long before the shamans and tribal ‘elders’ latch on to the rising tide to leverage it to impending doom if certain sacrificial acts are not performed to assuage the anger of the spirits?
How long before those ‘sacrifices’ give the elder-shaman elite even more power and influence as the controllers of the tidal spirits?
Correct. It’s all esoterica. Without Fig2a or the like, NO ONE would even know there was a difference in sea ice extent year to year. It effects NO ONE. It’s like a weather report for Mars.