Guest Post by Bob Tisdale
NOAA’s weekly sea surface temperature anomalies for the NINO regions (based on the original Reynolds OI.v2 data) are furnished on Mondays. Today’s update for the week centered on March 30, 2016 shows the sea surface temperature anomalies of the NINO3.4 region (5S-5N, 170W-1250W), which NOAA uses to define an El Niño and its strength, is at 1.5 deg C. That’s the threshold of a strong El Niño. Also keep in mind that the uncertainties of the data prevent us from knowing which of the El Niño events (1997/98 or 2015/16) was actually strongest. We illustrated and discussed this in the post The Differences between Sea Surface Temperature Datasets Prevent Us from Knowing Which El Niño Was Strongest According NINO3.4 Region Temperature Data.
The weekly NINO region sea surface temperature anomaly data for Figures 1 and 2 are from the NOAA/CPC Monthly Atmospheric & SST Indices webpage, specifically the data here. The base years for anomalies for the NOAA/CPC data are referenced to 1981-2010.
Figure 1 includes the weekly sea surface temperature anomalies of the 4 most-often-used NINO regions of the equatorial Pacific. They start in January 1991. From west to east they include:
- NINO4 (5S-5N, 160E-150W)
- NINO3.4 (5S-5N, 170W-120W)
- NINO3 (5S-5N, 150W-90W)
- NINO1+2 (10S-0, 90W-80W)

Figure 1
And for Figure 2, the evolutions of the sea surface temperature anomalies in 2015/16 are compared to 1997/98, another very strong El Niño. Recall that 2015 started the year at or near El Niño conditions, where that was not the case in 1997.

Figure 2
And, of course, the data indicate the 1997/98 El Niño was a stronger East Pacific El Niño than the 2015/16 El Niño. Also see the post Is the 2015/16 El Niño an El Niño Modoki?
SUBSURFACE TEMPERATURE ANOMALIES ALONG THE EQUATORIAL PACIFIC
Animation 1 is the most recent animation of the subsurface temperature anomalies from the NOAA Equatorial Pacific Temperature Depth Anomaly Animation webpage. It starts with the pentad (5-day period) centered on January 28, 2016 and ends with the most recent at March 29, 2016. In it, we can see the impact of the recent upwelling Kelvin wave. Cooler-than-normal subsurface temperature anomalies have worked their way eastward along the equator, and they are being drawn toward the surface.

Animation 1 (You may need to click start it.)
Looks like El Niño conditions in the tropical Pacific will be ending within the next couple of months, as expected.
That’s all for now. I’ll try to provide the full update next week when more the data for March are available.
WANT TO LEARN MORE ABOUT EL NIÑO EVENTS AND THEIR AFTEREFFECTS?
I published On Global Warming and the Illusion of Control (25MB .pdf) back in November 2015. It’s free. The introductory post is here. Chapter 3.7 includes detailed discussions of El Niño events and their aftereffects…though not as detailed as another of my ebooks Who Turned on the Heat?
Who Turned on the Heat? goes into a tremendous amount of detail to explain El Niño and La Niña processes and the long-term aftereffects of strong El Niño events. Who Turned on the Heat? weighs in at a whopping 550+ pages, about 110,000+ words. It contains somewhere in the neighborhood of 380 color illustrations. In pdf form, it’s about 23MB. It includes links to more than a dozen animations, which allow the reader to view ENSO processes and the interactions between variables.
In 2014, I lowered the price of Who Turned on the Heat? from U.S.$8.00 to U.S.$5.00. And the book sold well. It continues to do so.
A free preview in pdf format is here. The preview includes the Table of Contents, the Introduction, the first half of section 1 (which was provided complete in the post here), a discussion of the cover, and the Closing. Take a run through the Table of Contents. It is a very-detailed and well-illustrated book—using data from the real world, not models of a virtual world. Who Turned on the Heat? is only available in pdf format…and will only be available in that format. Click here to purchase a copy.
My sincerest thanks to everyone who has purchased a copy of Who Turned on the Heat? as a result of the El Niño posts in 2014 and from the 2015/16 El Nino series.
Bob, thank you for keeping up on this and sharing it.
Nino 3-4 is not at +1.5 as you said, but at +1.25 currently, down from +1.35 last week.
ivanjanko, I provided a link to the data in the post, which are referenced to the base years of 1981-2010. Here it is again:
http://www.cpc.ncep.noaa.gov/data/indices/wksst8110.for
Do you have a link to the other source you’re referring to?
http://www.bom.gov.au/climate/enso/monitoring/nino3_4.png
http://stateoftheocean.osmc.noaa.gov/sur/images/nino34_short.gif
edimbukvarevic and tolou, thanks. According to the BOM webpage here…
http://www.bom.gov.au/climate/enso/indices.shtml?bookmark=nino3.4
…they use the base years of 1961-1990 for anomalies.
In other words, the data I presented from NOAA are not wrong, contrary to ivanjanko’s comment. They’re simply based on different sets of base years for anomalies.
This index is decreasing fast:
http://www.cpc.ncep.noaa.gov/products/analysis_monitoring/enso_update/heat-last-year.gif
Bob: “And, of course, the data indicate the 1997/98 El Niño was a stronger East Pacific El Niño than the 2015/16 El Niño.” This is right. Anyway: The 2015/16 ElNino was also a Modocki- Type, in the end an East-Pacifik ( E- Type) AND a Central Pacific (C-Type) one. The involved area was bigger, so the actual ElNino was in sum bigger than the 1997/98?
frankclimate, here’s a different perspective, Hovmoller diagrams. Which looks stronger?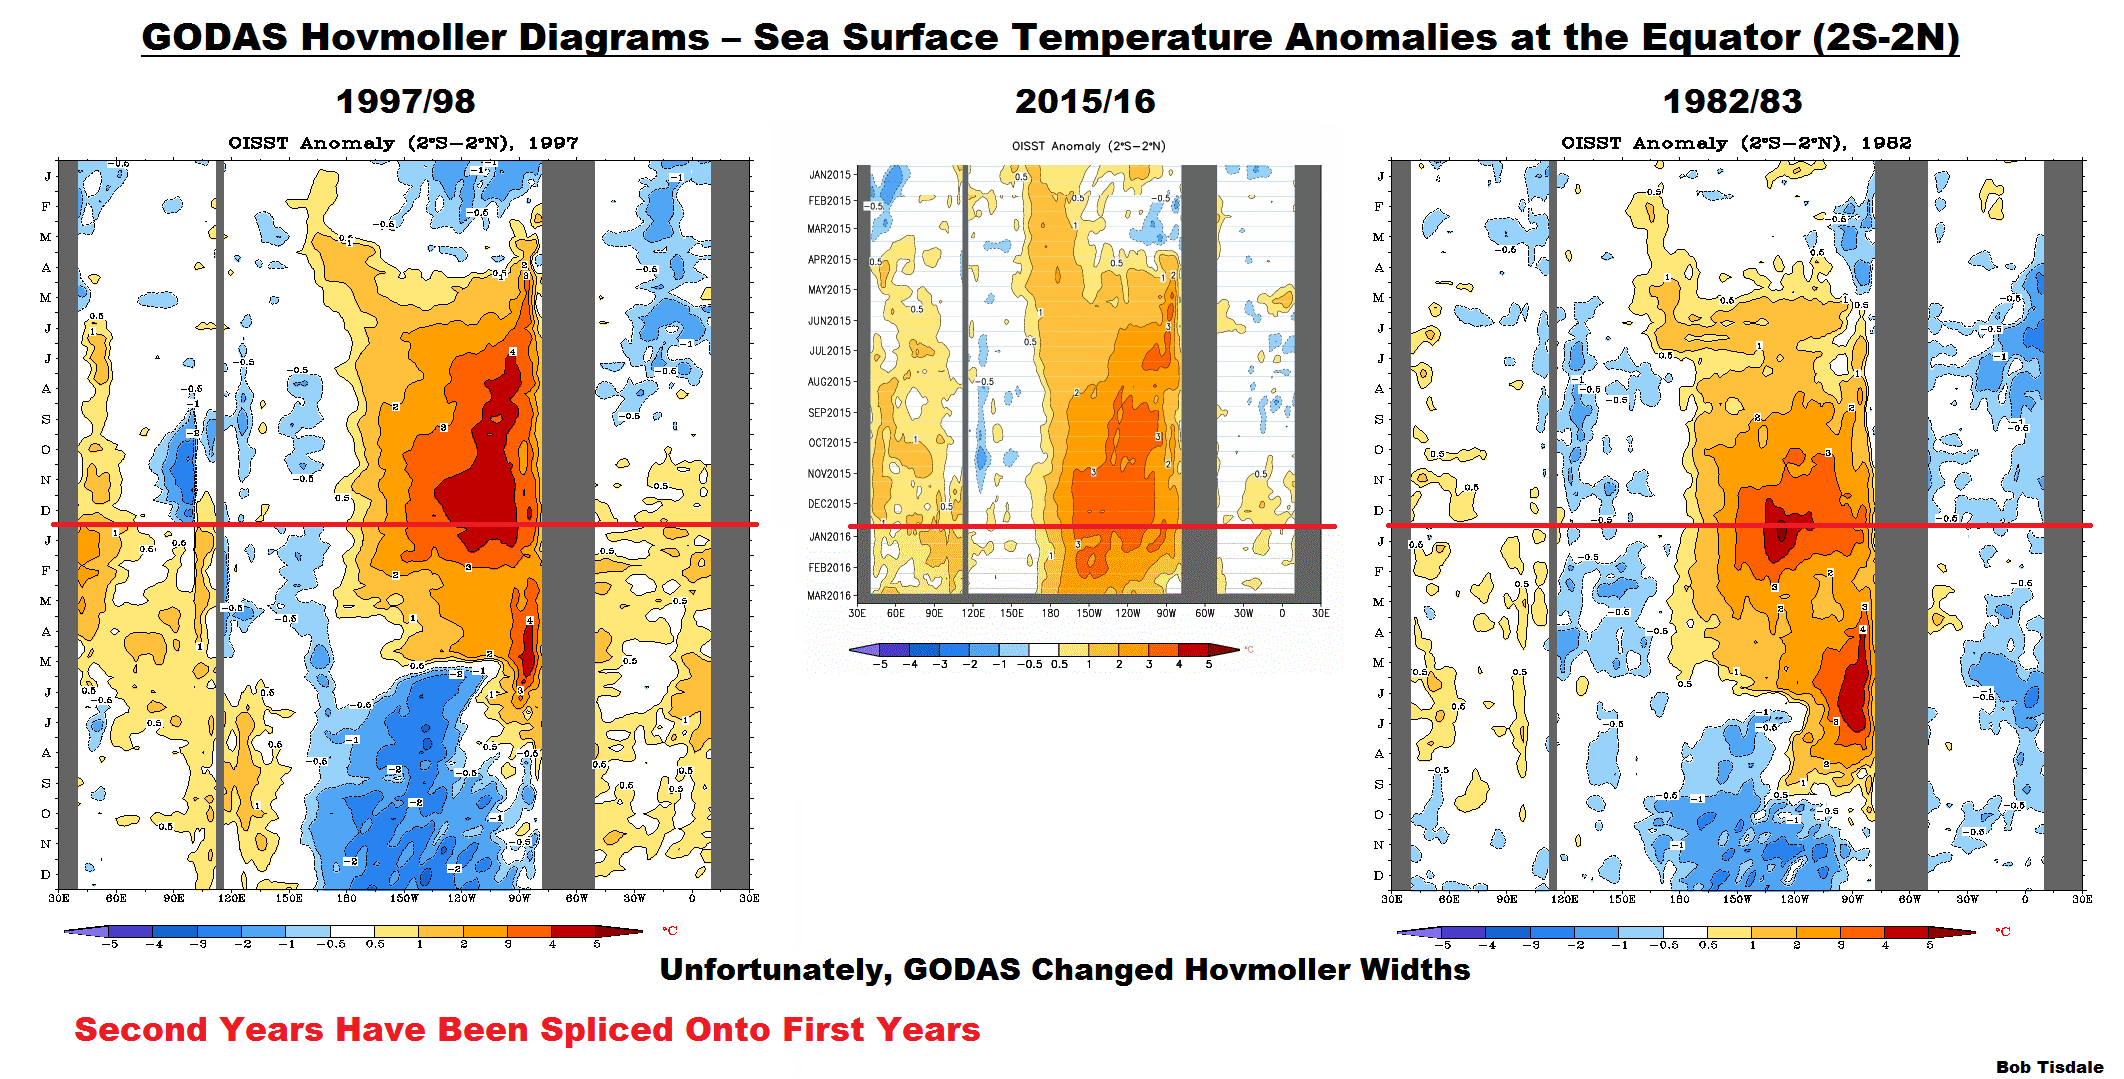
The Hovmoller is from the last full update:
https://bobtisdale.wordpress.com/2016/03/10/march-2016-enso-update-well-have-to-keep-an-eye-on-the-pocket-of-warm-water-south-of-the-equator/
Bob, when looking at the SST-data (ERSST v3b), not colours, 160E…100W , 5S…5N there is a “dad race” between 1997/1998 and 2015/16:
That’s why I can’t answer your question: ” Which looks stonger?”
Bob, great analysis, as always.
Figure 1 is key in comparing 1997-1999 with the current ENSO excursion.
Especially Nino1+2, in my view.
Where the Nino1+2 is involved in the el Nino, this means the Bjerknes feedback was engaged.
Where Nino1+2 don’t do much, like this time, then the BF was not engaged.
Thus the global climate impact of warm water pumped poleward will – I would predict – be much less.
Or even completely absent.
Could an el Nino “Modoki” focused on the central Pacific, not Nino 1+2, mean basically an el Nino without Bjerknes?
One problem is that the meaning of El Nino has changed to suit funding. For the past three years “Strongest El Nino ever coming?” PRs have been send out and promoted heavily in the media before the new year begins, rather than the old practice of calling off on El Nino over the previous 12 months. It means that the Australian summer, always hot anyway, gets confused with El Nino conditions, and ever-stronger El Ninos become recognised as more climate change, adding AGW points in the battle for minds. This year sees an agricultural warmth bringing more rain in autumn and winter, with a La Nina arriving in spring. The old SOI is still there, but politics has compromised its interpretation.
I live in south eastern Australia, where El Nino is traditioanlly associated with the likelihood of hot dry weather. Our “permanent” drought was blamed on the increasing spin of the polar vortex in addition to repeated El Ninos (caused by global warming)
The drought ended with a La Nina (caused by global warming).
The pseudo El Nino of 2015 caused Australian alarmists to freak out about buying water tanks and preparing for an inferno – but it didn’t happen. I haven’t forgotten:
https://theconversation.com/are-we-heading-for-a-worrying-super-el-nino-26090
When the latest super Nino finally arrived—at least on paper–it was attached to a mild, idyllic summer punctuated with occasional rain.
Where on earth was the expelled heat felt by humanity?
Question. What makes an El Nino a record breaker if it only breaks the record at one point while not breaking records at all the other points?
Well looks like we’ll have an Okie lawn again this year. Our local agency are not going to let up on restrictions, given the high probability of a below-normal 2016-17 water year.
Bob, what happens if ‘El Popo’ blows big down in Mexico on top of El Nino fading?
Thanks Bob. I always learn a lot from your posts.
Bob, why doesn’t anyone look at a Niño 3+4 (5S-5N, 160E-90W)? To me that would be useful to cover a larger range of events. Also, covering a larger area might also imply effects that are more significant globally.
Bob, does anyone calculate the energy stored in the El Niño ?
Thanks Bob for the good work you are doing.