
UNIVERSITY OF CAMBRIDGE
The combination of erosion and melting ice caps led to a massive increase in volcanic activity at the end of the last ice age, according to new research. As the climate warmed, the ice caps melted, decreasing the pressure on the Earth’s mantle, leading to an increase in both magma production and volcanic eruptions. The researchers, led by the University of Cambridge, have found that erosion also played a major role in the process, and may have contributed to an increase in atmospheric carbon dioxide levels.
“It’s been established that melting ice caps and volcanic activity are linked – but what we’ve found is that erosion also plays a key role in the cycle,” said Dr Pietro Sternai of Cambridge’s Department of Earth Sciences, the paper’s lead author, who is also a member of Caltech’s Division of Geological and Planetary Science. “Previous attempts to model the huge increase in atmospheric CO2 at the end of the last ice age failed to account for the role of erosion, meaning that CO2 levels may have been seriously underestimated.”
Using numerical simulations, which modelled various different features such as ice caps and glacial erosion rates, Sternai and his colleagues from the University of Geneva and ETH Zurich found that erosion is just as important as melting ice in driving the increase in magma production and subsequent volcanic activity. The results are published in the journalGeophysical Research Letters.
Although the researchers caution not to draw too strong a link between anthropogenic (human-caused) climate change and increased volcanic activity as the timescales are very different, since we now live in a period where the ice caps are being melted by climate change, they say that the same mechanism will likely work at shorter timescales as well.
Over the past million years, the Earth has gone back and forth between ice ages, or glacial periods, and interglacial periods, with each period lasting for roughly 100,000 years. During the interglacial periods, such as the one we live in today, volcanic activity is much higher, as the lack of pressure provided by the ice caps means that volcanoes are freer to erupt. But in the transition from an ice age to an interglacial period, the rates of erosion also increase, especially in mountain ranges where volcanoes tend to cluster.
Glaciers are considered to be the most erosive force on Earth, and as they melt, the ground beneath is eroded by as much as ten centimetres per year, further decreasing the pressure on the volcano and increasing the likelihood of an eruption. A decrease in pressure enhances the production of magma at depth, since rocks held at lower pressure tend to melt at lower temperatures.
When volcanoes erupt, they release more carbon dioxide into the atmosphere, creating a cycle that speeds up the warming process. Previous models that attempted to explain the increase in atmospheric CO2 during the end of the last ice age accounted for the role of deglaciation in increasing volcanic activity, but did not account for erosion, meaning that CO2 levels may have been significantly underestimated.
A typical ice age lasting 100,000 years can be characterised into periods of advancing and retreating ice – the ice grows for 80,000 years, but it only takes 20,000 years for that ice to melt.
“There are several factors that contribute to climate warming and cooling trends, and many of them are related to the Earth’s orbital parameters,” said Sternai. “But we know that much faster warming that cooling can’t be caused solely by changes in the Earth’s orbit – it must be, at least to some extent, related to something within the Earth system itself. Erosion, by contributing to unload the Earth’s surface and enhance volcanic CO2 emissions, may be the missing factor required to explain such persistent climate asymmetry.”
###
“not to draw too strong a link between anthropogenic (human-caused) climate change and increased volcanic activity”
also best not to draw too strong a link between emissions and warming as the correlations presented by the IPCC to support that claim are spurious.
http://papers.ssrn.com/sol3/papers.cfm?abstract_id=2725743
The key assumption here is that ‘releasing carbon dioxide’ is what drove temperature increase.
Apart from all the dogma and propaganda out there, why is the carbon dioxide driving the temperature increase rather than being a consequence of it?
The fact that CO2 trailed temperature increases by hundreds of years should be the first clue.
It’s real simple.
A volcano happened (they do).
The lava melted the glaciers. (it does)
The volcano spewed out CO2. (they do )
So it goes in that order; VGC or maybe VCG since the CO2 can be emitted before the lava reaches down to the glaciers.
See how easy that is.
g
Because they’re too dumb to notice that incomprehensibly massive nuclear fireball blazing away only 93 million miles away.
Hmmmm. The ‘triggering’ event in their sequence of events is glacier melt. So the whole sequence starts with increased temperature. Later in their sequence, they claim that CO2 levels became higher than previously thought. But CO2 levels are measured via ice cores. Are we looking at yet another claim that models should override data?
Take the Aaron Rodgers State Farm commercial where the cheesehead screams ‘discount double check!’ and Rodgers says “Is that all you ever say?”, then substitute ‘discount double check’ with ‘it’s the CO2!’ and that’s what it’s like hearing about everything being caused by CO2.
They are like the cheesehead – that’s all they got.
I apologise comrades for my inability to cope with Newspeak* but volcanoes still confuse me.
Volcanoes cause cooling today but in the past they caused warming. So, volcanoes warm the past but cool the future; is that correct? 😉
*Orthodoxy means not thinking – not needing to think. Orthodoxy is unconsciousness.” (Orwell Nineteen Eighty-Four)
Of course, when giant ice sheets vanish suddenly in the periods of brief warming cycles that come like clockwork, you get lots of earthquakes! This is to be expected. The weight of the massive glaciers covering half of entire continents aside from Antarctica, is a huge factor here, deforming the planet’s surface significantly.
Huge floods also are due to melting during Interglacials with some of the biggest floods on earth happening during these times.
I swear, these ‘scientists’ and their hanger-ons want a return to total Ice Age conditions. So do the pikas, polar bears and killer whales. They all would very much love to have a return of the Ice Ages again.
Earthquakes occur on fault lines. Where are the recently active (in geologic terms) fault zones associated with the last deglaciation?
Your logic seems fine. And there’s lot of evidence of massive floods as large glacial lakes formed and drained. But faults associated with the deglaciation? Not so much. At least in the NorthEastern US. Lots of faults. But they all look to be associated with various continental collisions in the Paleozoic or with the opening of the Atlantic in the early Mesozoic. Earthquakes? a few. But pretty much everyplace has an earthquake every now and then.
Puzzling.
There are lots of fault lines all across North America. They aren’t just at plate boundaries.
“Earthquakes occur on fault lines”
Earthquakes deep within the mantle cannot be located on fault lines, due to the mantle’s plasticity.
You miss the point Mark. Active faults (often) leave traces of activity. Maybe not as obvious as the fenceline and foundation offsets on the San Andreas. But observable traces nonetheless. If there were a slew of earthquakes associated with the declaciation, there ought to be some relatively recent traces of earthquake activity. AFAIK, there are few or no such signs in the US NorthEast and nearby Canada.
http://lmgtfy.com/?q=deglaciation+earthquakes
Don K
What major fault line has caused the Yellow Stone Caldera? That hot spot has migrated 100’s of miles between major eruptions.
Fact is there is more than just faults required for volcanic activity. Have you ever asked yourself why the greatest mountain range on earth, the Himalayas, doesn’t produce much in the way of volcanic activity? It has a lot to do with the make up and density of the strata of the colliding plates.
“I swear, these ‘scientists’ and their hanger-ons want a return to total Ice Age conditions.”
As foretold by these eminent scientists Flynn, Niven and Pournelle (statistician, physicist, and rocket engineer) in Fallen Angels.
(Copy and paste if my codes don’t work.)
“As the climate warmed, the ice caps melted, decreasing the pressure on the Earth’s mantle,”
Clealry the rest of the planet’s surface was still covered with ice then? They seem to have forgotten that there is no land at the North Pole! Sloppy wording, probably sloppy science too!
Almost correct, there are no volcanos in Scandinavia and Canada.
[Some, but not all, of the West coast BC mountains are volcanic. .mod]
And see the recent discovery of a large explosive volcanic field on the floor of the Arctic ocean.
In addition there is Jan Mayen ‘micro-continent’ rising from under the ocean next to Kolbeinsey Ridge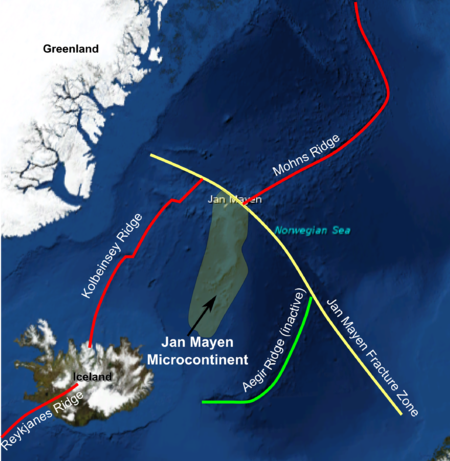
Possibly already a major factor in the N.Hemisphere’s climate variability.
http://www.vukcevic.talktalk.net/NA-NV.gif
even global temperature may be affected to a degree
http://www.vukcevic.talktalk.net/LLb.gif
Read the abstract and SI as paper is paywalled. Only numerical models of two volcanos in Chile. Just the assumption that rock is 3x weight of ice, and glaciers will erode some and then move the eroded rock down the mountain as the glacier melts, ‘freeing up’ the volcano more. Not a hint of field geology from the location. Stuff like eruption frequency during Holocene deglaciation, delta volume from lava/ash beds, or terminal morraine mass estimates, or glacial erosion channels weight loss estimates…nope. Nothing from the real world at all. Not very impressed.
I said it number of times, but some ‘experts’ ridicule anything that doesn’t conform to their agenda.
This image shows gravity anomaly at a section of the Arctic’s sea floor
The red bands corresponding to interglacial periods indicate rapid magma flow in the expanding sea floor, while green-ish bands (the glaciation periods) suggest very slow expansion. They are of similar width despite the fact that interglacials are by an order of magnitude shorter than the ice ages. Holocene is indicated by the black line. I am in process of gathering more evidence, when all is put together all references will be made available.
“the ice grows for 80,000 years, but it only takes 20,000 years for that ice to melt”.
That appears to be wrong
According to this illustration
http://www.qpg.geog.cam.ac.uk/research/projects/englishchannelformation/1453389260_3dcecb561c.jpg
(from lecture by Professor Phil Gibbard, University of Cambridge)
Last glacial max was 20Kyr ago, but most of it was gone by 8-9 Kyr ago.
Any ideas why most of Siberia and large parts of Alaska were free from the ice sheet?
(talking to oneself is first sign of…. sorry not PC might upset some of the readers)
[The mods note that talking to oneself is not a sign of any particular problem.
It is a problem when one disagrees with both parties while talking with yourself. .mod]
vukcevic
So, how do these changes track with the north-south flipping of magnetic pole directions, and how do they track with the position of the north and south magnetic poles – particularly the recent very, very rapid transition of the north magnetic pole from near north Hudson Bay up across Canada and now well across the Arctic Ocean towards Siberia?
A simple and short answer is ‘not much if any’.
For N. Hemisphere a bit more complex answer might be: in summer months very little, in the winter when Arctic insolation is low or none, if the geomagnetic pole (not the magnetic one, two are often at different locations) is somewhere in the Arctic region, Kamchatka blows up and sun blasts few CMS in our direction then it appears to be a factor, but wouldn’t think it is effective enough to alter glaciation process in either direction.
Probably due to changes in ocean currents and their movement of heat. That image leaves out Berengia, where Alaska and Siberia were connected by dry land. Even all the area between the northern Canadian islands were dry land under the ice. At that time the ONLY current moving into or out of the Artic Ocean basin was through the Greenland Sea.
The above illustration (Last Glacial Maximum – 20.000 yr ago) raises a question which could be interesting from the point of view of climate. Looking at the location of land ice, east and west of the Atlantic land ice is much more southward both in Europe and N. America as elsewhere. Alaska and all of Asia (East of the Ural) hardly show any large scale land ice. On the same or higher latitudes.
What could have been the cause?
I strongly believe that the lack of ice sheets across Siberia was largely due to it been too warm during the summer months. The extent of the ice sheets suggests to me that there was frequent blocking highs across the Atlantic side of the NH for large parts of the year. But during the summer months at least l believe that low pressure sitting over northern Russia was a common weather pattern during this time. So allowing cold Polar air to sweep down across NW Russia and so greatly reducing the amount of melting of the ice sheets during the summer in this area. But over on the eastern side of Russia this same weather pattern would have brought warmer air from the south. So allowing enough melting during the summer to stop the ice sheet from expanding. It needs to be remembered that there must of been a lot of Polar air flowing southwards across the Atlantic side of the NH during this time. And this air would have to have been replaced by warmer coming up from the south somewhere else. And l believe it was largely the Siberia/Alaska area where this was happening.
@taxed: the more cold (Ice Age), the more snow and the less ‘summer’ month’s, the lower the average summer temperature will be. With a Bering Street without (relative warm) water, temperatures would be expected to fall down even more. Expecting the low pressure area’s on the warmer place, the Northern Pacific seems to be the place to expect low pressure in summertime.
Low air humidity on very cold places (East Asia) could result in but a few bit of snow. But, knowing a lot of mountains in Eastern Siberia, snow melt doesn’t seem logic, not even in summer month’s.
But, given the existence of land ice where it has been found, pressure and wind patterns must have played a big role. Perhaps we even have to think about complete other ‘cell patterns’ in the atmosphere. In combination with a completely other pattern of sea currents.
Wim Rost
As l have posted a number of times on WUWT. l feel that the blocking of the weather patterns was a large part of the cause of the expanding of the ice sheets. Because when the last ice age was at its worst. The climate of NE America and NW Russia became much colder then else where in the NH. This suggests to me that these area’s is where they were frequent blasts of cold Polar air moving southwards taking place. For this to have happened, then blocking weather patterns must have been a common theme during this time.
Agreed Vukcevic. I do not agree that glaciers are the largest erosional process. They are slow moveing and only release the sediment on melting. Rivers, on the other hand, move fast and remove sediment very quickly towards the sea out of area. There are also many more of them.
gymnosperm THANKS for the links
It looks when all put together there is more to it than just idle speculation.
Well, well, here’s Vuk’s ridge:


Here’s SST anomaly:
Here’s Willis’ deviation from latitude altitude temperature:
Here’s OCO:
Well, well…
gymnosperm
Measured grid values of OCO, or modeled and corrected and massaged grid values for “human-released CO2” only?
Human overlaid on OCO.
I have looked at that image, it says:
“human-sources-vs-yearly-average-oco”
What I think they’ve done is:
– fact: CO2 concentration varies between two hemispheres according to seasons
– assumed CO2 is well mixed excluding seasonal variation
– assumed volcanic or sea floor emissions are negligible
– average concentration across the globe for period of one year.
– subtracted this global average from grid values
– assumed that reminder in the grids must be anthropogenic
What is your interpretation ?
I took two images from a thread a while back by Eric Swenson where he made his own oco images. Somebody posted an image of human CO2 in a very similar projection so I just overlaid them. The overlay simply shows there is a bunch of CO2 up there away from any human source. The human sources are dark.
Had a brief after thread discussion with Willis in his post containing his image where I pointed out the similarity between the OCO CO2 anomaly and his temperature anomaly.
My interpretation is that SST anomalies right over the ridge (not generally seen), temperature and CO2 anomalies in the general area can all be explained by volcanism along that ridge.
Just found link
http://edgar.jrc.ec.europa.eu/news_docs/jrc-2015-trends-in-global-co2-emissions-2015-report-98184.pdf
long report, it will require a bit of time to read, I am interestied to know how close was my interpretation.
Well, well! At Jan Mayen there is recent volcanic activity:
“For some time, scientists doubted if there could be any activity in the Beerenberg volcano, but in 1970 the volcano erupted, and added another 3 km2 (1.2 sq mi) of land mass to the island during the three to four weeks it lasted. It had more eruptions in 1973 and 1985. During an eruption, the sea temperature around the island may increase from just above freezing to about 30 °C (86 °F)”.
And:
“Geography and geology[edit]
Jan Mayen consists of two geographically distinct parts. Nord-Jan has a round shape and is dominated by the 2,277 m (7,470 ft) high Beerenberg volcano with its large ice cap (114.2 km2 or 44 sq mi), which can be divided into twenty individual outlet glaciers. The largest of those is Sørbreen, with an area of 15 km2 (5.8 sq mi) and a length of 8.7 km (5.41 mi). South-Jan is narrow, comparatively flat and unglaciated. Its highest elevation is Rudolftoppen at 769 m (2,523 ft). The station and living quarters are located on South-Jan. The island lies at the northern end of the Jan Mayen Microcontinent. The microcontinent was originally part of the Greenland Plate, but now forms part of the Eurasian Plate.”
Source: https://en.wikipedia.org/wiki/Jan_Mayen
WR: The Beerenberg Volcano is 2,277 m high and still has a 114 km2 ice cap. During the glacial this mountain must have had a huge layer of ice stretching over the southern island, together they stretch a 50 km. Looking at Google Earth Pro, the area above glacial sea level (-120m) must have been >1000km2, enough for a huge, high and heavy ice cap. Melting must have resulted in a considerable pressure release in a region with a thin and spreading crust. A hot spot would be near:
“The volcanic island of Jan Mayen only formed in the Pleistocene,[5] possibly related to a hotspot, known as the Jan Mayen hotspot, at the triple junction at the end of the Mohns Ridge.” Source: https://en.wikipedia.org/wiki/Jan_Mayen_Microcontinent
The island is ‘only formed in the Pleistocene’. An interesting place for more research on this topic.
Wim, I had missed your comment on Willis’ post about gulf stream temperature, but found it digging up these images. You are right, but still surprising to me that temperatures to the south of it are warmer. Always thought it was a “hot river” surrounded by colder water.
Had forgotten that the ridge offsets a bit west at a transform fault right under Iceland and tracks along the Greenland continental shelf quite a way before transforming sharply east along the Jan Mayen fracture.
Vuk’s image reminded me.
The possibility of Willis’ and Oco corresponding so closely in form by chance seems remote.
Ice and water have essentially the same mass (the difference being the entrained “air”). Still struggling with this glacial loading/unloading concept. You transfer mass from the ocean to continents. You unload the ocean crust, you load the continental crust. Easy to see how that could favor mafic extrusion in the ocean basins, but continental loading will not favor ocean floor spreading. Just the opposite. Continents are wedge shaped, and when they sink, they will compress the ocean basins.
Gymnosperm,
About your remark “Continents are wedge shaped, and when they sink, they will compress the ocean basins.” the following.
There surely can be a sideward pressure but I suppose the downward pressure (and upward nearby) is more direct and gives the most dynamics. Continents are parts of the Earth crust, ‘floating’ on the Upper Mantle. The weight of continental material is less than the weight of the bottom of the oceans compared to the material they are both floating on, that’s why the ocean bottoms lay deeper. Put a weight on the ‘column’ of continent like a 2 km of ice sheet (as in Scandinavia) and the whole column will sink. In the same time the pressure on the ocean’s ‘column’ is released, because the top 120 m of water is gone. The total up- and downward effect is huge which can be seen when we look at what happened in the Holocene when the movements reversed. Oslo in Norway did already rise 180 meters since the ending of the last glacial https://en.wikipedia.org/wiki/Geography_of_Norway and Stockholm is still rising half a meter a century:
The northern part of the Netherlands which was pressed ‘upwards’ during the last Glacial (as a reverse movement to Scandinavia’s movement downwards) right now still is moving down with a 5 cm. a century. So during the Glacials there is a real impact downward for the icecaps (Scandinavia, Jan Mayen, Greenland, Iceland) and upward for the ‘nearby’ regions. The reverse movement during the Holocene will release pressure at certain places. Probably enough for extra volcanic activity in spreading regions, which at the sea bottom doesn’t manifests itself often aggressively. So it keeps itself hidden. Probably.
About your remark about the Gulf Stream: there is a part of the Gulfstream which is warmer than the waters south of it, more looking like a warm river. It is the part east of the US: http://www.ospo.noaa.gov/data/sst/contour/global_small.cf.gif Right now you can see north of Great Britain that sea temperatures are a bit warmer there than more to the south in the North Sea. Also the Gulf of Bothnia in this time of the year is much colder than the sea west of Norway at the same latitude. So, in fact your image of a warm stream is OK, although it only looks like a warm river east of the US.
There is another factor unrelated to the postglacial which could cause uplift/sink as well as enhance or slow down continental drift
Inner metal core is asymmetric (currently in east west direction) it is melting on one side and crystallising on the opposite. This normally wouldn’t matter much, but the core is currently rotating slightly faster (about one degree/annum) than the mantle and the crust above. As a consequence the thermal convection in the outer liquid core is not strictly radial but somewhat inclined backwards, applying tangential force on the mantle and the crust above (slightly stronger in the west where the bulge is).
Vukcevic: “This normally wouldn’t matter much, but the core is currently rotating slightly faster (about one degree/annum) than the mantle and the crust above.”
WR: You mean with ‘currently’ that recently there could have been a speeding up of the rotation? Can you mention a time scale?
Core’s differential rotation varies from retarded to advanced, I have data somewhere on my PC. Best to start with one of the papers by Dr. J. Dickey (JPL’s expert on geodynamics) on the Earth’s core differential rotation, there are two or three (updated) versions on line.
Whatever processes are at work in iceland are very shallow <40 km

This is typical of the entire planetary ridge system and the so called hot spots including Hawaii. The mantle is stratified rather than convective and anomalies at the core mantle boundary, including LLSVP's appear to have teleconnections at best with this near surface melting and extrusion.
found this
http://www.vukcevic.talktalk.net/ECrot.gif
Gymnosperm, I found this explanation to your figures at https://seismo.berkeley.edu/~rallen/research/iceland/iceMODELS/JGRfigsCrust/ICECRTbvertSvelslices.pdf
“Plate 3. Vertical slices through the velocity structure of Iceland, ICECRTb. Slices are parallel and perpendicular to the main Eastern Neovolcanic Zone. Each slice is shown twice. (b) and (d) show absolute velocity variations which illustrate both the velocity anomalies and crustal thickness variations. Purple colors correspond to mantle velocities. Note the thick crust in central Iceland and the necking to the NW before the thicker crust of the Westernfjords. (c) and (f) are relative velocity anomalies along the same lines and clearly show the communication between the lower crustal low velocities and the horizontal upper crustal low-velocity anomaly which extends up and down much of the ridge.”
WR: I understand the heavy mantel has a high velocity S-vel and the ridge deposits have a low velocity. The ridge deposits are up to 40 km. Wikipedia about the thickness of the Earth crust:
“The oceanic crust of the sheet is different from its continental crust.
• The oceanic crust is 5 km (3 mi) to 10 km (6 mi) thick[2] and is composed primarily of basalt, diabase, and gabbro.
• The continental crust is typically from 30 km (20 mi) to 50 km (30 mi) thick and is mostly composed of slightly less dense rocks than those of the oceanic crust. Some of these less dense rocks, such asgranite, are common in the continental crust but rare to absent in the oceanic crust.
• Both the continental and oceanic crust “float” on the mantle. Because the continental crust is thicker, it extends both to greater elevations and greater depth than the oceanic crust. The slightly lower density of felsic continental rock compared to basaltic oceanic rock contributes to the higher relative elevation of the top of the continental crust. As the top of the continental crust reaches elevations higher than that of the oceanic, water runs off the continents and collects above the oceanic crust. Because of the change in velocity of seismic waves it is believed that beneath continents at a certain depth continental crust (sial) becomes close in its physical properties to oceanic crust (sima), and the transition zone is referred to as the Conrad discontinuity.”
https://en.wikipedia.org/wiki/Crust_(geology)
Vukcevic, your graph of 10.43 am gives a very sudden change. Here I found a further explanation which is too technical for me. Perhaps interesting for you: https://www.researchgate.net/publication/258807423_The_shuffling_rotation_of_the_Earth's_inner_core_revealed_by_earthquake_doublets
Wim, the difference in seismic velocities between continental and ocean crust is very real, but it is not the point. Allen had a preconception that there would be a mantle plume beneath Iceland, but his data show none.
Continents are more buoyant since they are richer in Aluminum silicates, as in granite and serpentine. It is not so much the difference in mass as the spatially inefficient crystalline structure. Much like the difference between ice and liquid water.
Both continental and oceanic crusts transition to a plastic “asthenosphere” represented by the Mohorovicic discontinuity or low velocity zone.
Iceland is a trivial continent and the provenance of its Aluminum silicates (SiAl) is not well understood. Generally, it is thought that sial is distilled from the Iron and Manganese silicates (SiMa) of ocean crust in subduction zones.
Serious ancient continents like North America and Eurasia have roots like molars that extend far below the ~20 km average depth of the Moho beneath the ocean crust.
Mantle rock is wierd stuff that actually melts and extrudes when pressure on it is released. It is therefore very difficult to explain how continents can move when their motion creates additional pressure on the rock in the direction of motion.
But they do. We can measure it with GPS. Another mystery.
All this is intended as background for my point that the melting and extrusion of ocean crust from the mantle below Iceland takes place at a very shallow level. It does not appear to be supported from below.
I can show you seismic tomography from all over the world if you wish. It is the same.
The physical properties of rock require a release of pressure for melting and extrusion to occur.
Unloading the ocean floor during glaciations can do this, but these forces still seem insufficient to move the continents.
Come on, for ~90% of earth history there has been no ice, yet the continents have still apparently moved.
Gymnosperm,
“Currently, there are two hypotheses that attempt to explain their origins. One suggests that they are due to hot mantle plumes that rise as thermal diapirs from the core–mantle boundary.[1] An alternative hypothesis postulates that it is not high temperature that causes the volcanism, but lithospheric extension that permits the passive rising of melt from shallow depths”. Source: https://en.wikipedia.org/wiki/Hotspot_(geology)
The fact that Iceland is situated on a rift suggests that the deep processes in the earth which cause the continental drift could be the cause of her existence. The provenance of its aluminium silicates as you describe suggests that it could be process two (the alternative hypothesis) which gave rise to the rise of Iceland.
Jan Mayen is signalled as a hot spot as well https://en.wikipedia.org/wiki/Jan_Mayen_hotspot
Given the location near the hot anomaly in Willis’ post http://wattsupwiththat.com/2016/01/19/whats-hot-whats-not/ , the above showed anomaly in CO2 and the very recent rise of Jan Mayen (Pleistocene) actual geologic activity seems to be sought in this region. At least partly this could explain the temperature anomaly.
The illustration from Vukcevic (Last Glacial Maximum, above) that opened the discussion suggests that 20.000 years ago geologic activity at the Jan Mayen Hotspot would have been completely absent. If the Pleistocene birth of Jan Mayen could be coupled just to the interglacials, than that should give some evidence that the release of pressure by the ice caps indeed is a trigger for the release of volcanic activity. Three recent eruptions of Jan Mayen, 1985, 1973 and 1970 (http://www.volcanolive.com/janmayen.html) suggest an active period for the region.
About the temperature anomaly which is huge: “For some time, scientists doubted if there could be any activity in the Beerenberg volcano, but in 1970 the volcano erupted, and added another 3 km2 (1.2 sq mi) of land mass to the island during the three to four weeks it lasted. It had more eruptions in 1973 and 1985. During an eruption, the sea temperature around the island may increase from just above freezing to about 30 °C (86 °F).” https://en.wikipedia.org/wiki/Jan_Mayen#Geography_and_geology
The scale mentioned of the temperature rise of the sea “around the island” suggests however a more local effect of this volcanic activity. But information is very limited.
Wim,
Of course. I was just trying to expand the discussion to include the constraint that the very reasonable glacial loading/unloading effect must be thought of as working at a shallow level. I see no reason shallowness should preclude the concept, it might even make it more viable.
I do caution against getting carried away with the glacial loading/unloading as the exclusive driver of glacial/interglacial oscillation. Folks love to latch on to such new ideas as the one true explanation we have been waiting for. My own suspicion is that this is just another physical process that we must integrate.
The bigger questions seem to be why does the planet go into generally icy periods in the first place every few hundred million years, and what is actually driving the motion of continents?
Gymnosperm,
Agree. And interesting questions too!
Whatever. Whichever. Whenever.
One of the underlying premises of the cAGW postulate is that, whether its rôle be big or whether its rôle be small, the CO2 remains in the atmosphere for a godzillian awful long time. But that is easily refuted by the medium-term ice core data and the short-term current data of carbon sinks which appear as thirsty as ever, and growing thirstier.
If they (not necessarily these authors) acknowledged that we actually have the time, lots of time, and can afford to wait-and-see, then there would be no more “five years to save the planet” every year.
It’s a bummer for them. But that’s double plus good news for grass, crops, trees, the biosphere, and the rest of us who don’t earn a living painting a pastiche of the Last Supper.
The last supper was a portrait of the 12 Zodiac signs. Leonardo Da Vinci was telling the world religion is based on Astrology.
http://www.booktalk.org/the-zodiac-in-leonardo-da-vinci-s-last-supper-t10213.html
That’s right up there with chemtrails.
Religion is one big conspiracy theory anyway.
Livens things up tho.
MarkW. Then show me it’s incorrect. His theory is 100% solid.
The paper focuses on loading and erosion due to continental ice sheets, but almost all the eruptions of interest (shown in their maps) have occurred in mountainous areas along subduction zones that were far from these ice sheets. This is not to say their mechanism could not have happened in some cases, but as a primary driver of increased eruption frequency upon deglaciation it seems tenuous. The paper does not mention the well known role of meltwater seeping into the magma chamber and provoking explosive eruptions.
It’s kinda basic, but has anyone ever shown (proved) that CO2 actually controls climate? It seems like belief rather than fact.
Ian M
so CO2 lagged temperature. Houdavknown……
CO2 levels were underestimated? Do these folks know about ice cores? Seems to me that not only would the CO2 have to be underestimated, the ice cores would have to be wrong or CO2 would have to not be well mixed. That may not be impossible, but it seems less than probable.
Color me unimpressed.
Not a bad paper, although I note the genuflexion to anthropo warming which is still de rigueur if you want to be published. I also notice some deceleration in the rhetoric on the subject of global warming by newer (or those of fewer publications?) and the inter-leafing of more reasonable, more scientific studies coming into the light.
A quibble: magmas can have sufficient pressure to erupt under glaciers and we have the example of a present sub-ice eruption detected recently by U of Washington (St. Louis) researchers in West Antarctica – which is a known prolific volcanic field around the edges and offshore fringing W. Ant.
https://source.wustl.edu/2013/11/volcano-discovered-smoldering-under-a-kilometer-of-ice-in-west-antarctica/
Of course this didn’t escape WUWT and there is a report on (somewhere). I have pointed to the volcanic landform ‘tuya’ which is an volcano shaped like and upside down wash basin – this was formed by a sub-glacial eruption (named after the type locality in northern British Columbia but the Canadian site doesn’t give a picture!!!)
https://en.wikipedia.org/wiki/Tuya#Word_origin
I like this study, not because of the CO2 part, but because of the effect of ice pressure on volcanic activity but the authors missed perhaps one of the most interesting effects (according to…me). I haven’t seen this reported anywhere but the spacial evidence seems clear. The pressure from thick ice depresses the land surface and causes LATERAL migration of the magma in the mantle away from these depressions and eruptions occur in peripheral area, particularly offshore. Remember the “surprising” sea floor eruptions recently discovered offshore Greenland and the activity offshore W. Antarctica. The sub-glacial eruptions probably take place as you move toward the thinner ice of the fringe of the ice and into the offshore.
The Arctic, too, surprised everyone (but me).
http://iceagenow.com/Volcanoes_in_Arctic_Ocean.htm
I look at the miserly patch the researchers in Cambridge studied and wonder if they took a broader look around. I doubt it if they missed the lateral movement of magma to the edges and out into the sea from ice caps. They were obviously erupting in the sea before the on land stuff they are trumpeting. I guess the “Pearse Effect” on volcanic fields vis a vis ice cap pressures will die on this page.
It’s a good point, Gary. Actually a very good point. Ice sheets depress the land surface by hundreds of metres, and then when the ice melts, the land rebounds isostatically. So something HAS to move sideways to allow this vertical movement to take place and it’s presumably the upper mantle, where it’s most plastic. Is this enough to cause volcanic eruptions? I would guess, only in areas where there’s a hot spot and incipient melting anyway, i.e. facilitating volcanic activity that would happen sooner or later anyway.
Earth is presently within an ‘ice age’ that has lasted for about 2.8 million years. Within this time there have been documented, rhythmic periods of glaciation (the last four being about 100,000 years in length), separated by shorter and warmer ‘inter-glacial’ periods, each roughly 10,000 years in duration. Currently we are nearing the end of this latest warmer interglacial episode.
Wouldn’t melting glacial ice over land the pressure on the Earth’s mantle that’s under the oceans the ice melted into?
My comment should read Wouldn’t melting glacial ice over land INCREASE the pressure on the Earth’s mantle under the oceans the ice melted into? ( If volcanic activity in the mantle is dependent on pressure above it, that is..)
These authors have a very non-dynamic view of volcanism. Certainly there are odd cases (St. Helens comes to mind) where the sudden removal of half a mountain releases the eruption, but generally if a mile of ice, or the rough equivalent about 1700 more feet of mountain is preventing explosion, the magma is just going to rise a little higher before it blows. The USGS had the St Helens area evacuated well before the eruption, so clearly they were expecting it even though they didn’t anticipate the collapse that occurred. About all ice sheets succeed in doing is hiding volcanism. In fact there’s plenty of field evidence where ice has been in the past of sub-ice sheet volcanism. Which brings to mind heat energy, which ice is just a bit susceptible to, and which magma has a lot of.
I’m sorry, but this is all off scale – if I dump an ice cube tray into Kilauea am I going to put it out? What if I stack up a whole bunch of ice cubes trays worth of ice? Forget it, that magma’s coming out.
+10. I should have read the whole column of remarks before I typed mine.
The authors don’t consider how much CO2 would be taken out of the air by chemical reactions with the newly eroded rock.
True.
Your comment brings to mind the idea that the rise of the Himalayas (Miocene) brought with it a period increased chemical weathering of siliceous rock, gradually scavenging CO2 from the atmosphere down to the point where we presently find it. Plant life had to adapt, and the C4 photosynthesis process emerged over this period.
I think that with the funds available for AGW research, people are running out of things to study!
The one thing they all seem to miss is that the ICE holds a lot of atmospheric gases. The CO2 levels dropped from around 900ppm to 450ppm when the Antartic Ice Cap formed. The Ice is full of gas bubbles. A lot of ice, a lot of trapped gas.
When it melts…. the gas is released.
Sorry AndyJ, the ice holds a small amount of air trapped in tiny bubbles, and its component gases (nitrogen, oxgen, argon and a bit of CO2) are in the same proportion as they were in the atmosphere at the time that ice fell as snow. That’s why sampling the air bubbles will give pretty good estimates of the atmospheric CO2 content over the long time spans preserved in Greenland and Antarctica. So no, the ice does not sequester CO2. And the oxygen isotopes give a rough guide to the prevailing air temperatures over time.
But if you read about all the assumptions that go into using oxygen isotopes as a temperature proxy, you come away realising that, at best, it’s a semi-quantitative guide to palaeo-temperatures. NOAA website lists the assumptions and guesses involved in converting isotopes to temperature and it’s complicated.
“Although the researchers caution not to draw too strong a link between anthropogenic (human-caused) climate change and increased volcanic activity as the timescales are very different, since we now live in a period where the ice caps are being melted by climate change, they say that the same mechanism will likely work at shorter timescales as well.”
*
Yeah, yeah, it’s worse than we thought. We know.
Uh huh. I’ll see your “up to 10cm per year” and raise you 120m of sea level decrease over 70% of the planet during the onset of the ice age.
One might expect additional volcanic activity due to those changes too…resulting in the earth “fighting back” as it goes into the ice age. Didn’t help though, did it.
Oh come on! I ran to the top of the VA Medical Center in Portland, OR to watch Mt. St. Helens blow its top off. It could have blown God into orbit. And that one was considered to be a small volcano incapable of changing climate. Besides, glaciers and ice sheets fill up valleys, not necessarily volcano tops that have the chops to change climate. Climate changing volcanoes are MASSIVE in size (as in way bigger than anything you or I have experienced) and are able to kick whatever sits on them (ice sheets, man, woman, liberals) to the curb. OR these massive climate changing volcanoes sit in the equatorial belt where glaciers are scarce. It’s those equatorial massive blows that are scary.
Even in Antarctica, volcanoes peek above the sheet.
http://www.livescience.com/41262-west-antarctica-new-volcano-discovered.html
But erosion would also expose carbonate rock and cause weathering, acting conversely to draw down CO2 out of the atmosphere.
The CO2 story makers with unlimited funds need to try again. I’m sure they will.
Probably the biggest problem science faces is that in the old days pre computer modelling in spite of their contempt for what even then they called the washing machine fixers they had to listen to the representatives of the real world. Now they do not.
No self respecting engineering QA man would just accept global warming without evidence of at least a hundred stations with the lowest and highest level of change each being proven to have this change consistent with the CO2 levels in the area and these levels consistent with the man made emissions and air flows in that area. This is applied science but these climate scientists are the equivalent of pure mathematicians versus applied ones with zero real practical skills.
Looking at the data adjustments made one gets more and more of the opinion that the climate profession has the “Stephen Randall Glass” effect starting with small adjustments quite plausible and adjustment on top of adjustments so we no longer have significant factual data. If the adjustments even are an order of magnitude smaller than the warming then the case has become too subjective to warrant consideration by normal engineering and should therefore also be by scientific standards.
Very interesting, but from my point of view and my simple understanding, the basic logic applied seems completely backwards and illogical when the basic pattern of climate change considered.
Long term climatic warming and cooling follow end lead each other and ice melts during the warming period and “grows” back during the cooling period, so basically ice melting leads to the cooling and is followed by the cooling, not the other way around…..and the ice “growth” leads to the warming which basically seems to kick starts at the very peak of a glacial period, very possibly due to the very sheer weight of the polar ice caps and the increased pressure applied due to that increased weight and mass of ice
Basic physics means, at least to me, that when pressure increased on the earths crust the earth mantle will increase its heat content which in turn will increase the heat content of the layers above, like the oceans and the land surface and the atmosphere, a warming (a warming period) which basically will melt the ice and reduce the mass and weight and therefor reduce the pressure on the crust which in turn will lead to .the “cooling” of the earth’s mantle and the cooling of the layers above which seems to kick start at the peak of an interglacial. or the peak of interglacial optimum.
The main problem with this kind of logic and interpretation of the climatic warming and cooling periodicity is that it can not be accepted by the “science” orthodoxy, as it is too “dangerous” and disturbing, not only to climatology and climate science but to a lot more in the fields of science.
Chaos exist only in the absence of knowledge……..a deformed or incomplete or partial form of knowledge has still room for chaos, some times for a lot of it, especially due to misinformation and weird logical acrobatics. ..
cheers
“A typical ice age lasting 100,000 years…”
Wrong! A typical glacial period lasts 100,000 years. We are currently in an ice age that began more 2.5 million year ago. We are in an interglacial of the Quaternary glaciation, Pleistocene glaciation or the current ice age. They are confusing “glacial period” with “ice age”.
Why are all our most interesting archeological finds buried ?
It doesn’t sound like erosion, it sounds more like accretion.