From the “language gives away the intent of the study” department comes this clear attempt at a headline.
Long-term global warming not driven naturally
Study “debunks” argument that warming is driven by natural factors

DURHAM, N.C. — By examining how Earth cools itself back down after a period of natural warming, a study by scientists at Duke University and NASA’s Jet Propulsion Laboratory confirms that global temperature does not rise or fall chaotically in the long run. Unless pushed by outside forces, temperature should remain stable.
The new evidence may finally help put the chill on skeptics’ belief that long-term global warming occurs in an unpredictable manner, independently of external drivers such as human impacts.
“This underscores that large, sustained changes in global temperature like those observed over the last century require drivers such as increased greenhouse gas concentrations,” said lead author Patrick Brown, a PhD student at Duke’s Nicholas School of the Environment. Natural climate cycles alone are insufficient to explain such changes, he said.
Brown and his colleagues published their peer-reviewed research Feb. 1 in the Journal of Climate.
Using global climate models and NASA satellite observations of Earth’s energy budget from the last 15 years, the study finds that a warming Earth is able to restore its temperature equilibrium through complex and seemingly paradoxical changes in the atmosphere and the way radiative heat is transported.
Scientists have long attributed this stabilization to a phenomenon known as the Planck Response, a large increase in infrared energy that Earth emits as it warms. Acting as a safety valve of sorts, this response creates a negative radiative feedback that allows more of the accumulating heat to be released into space through the top of the atmosphere.
The new Duke-NASA research, however, shows it’s not as simple as that.
“Our analysis confirmed that the Planck Response plays a dominant role in restoring global temperature stability, but to our surprise we found that it tends to be overwhelmed locally by heat-trapping positive energy feedbacks related to changes in clouds, water vapor, and snow and ice,” Brown said. “This initially suggested that the climate system might be able to create large, sustained changes in temperature all by itself.”
A more detailed investigation of the satellite observations and climate models helped the researchers finally reconcile what was happening globally versus locally.
“While global temperature tends to be stable due to the Planck Response, there are other important, previously less appreciated, mechanisms at work too,” said Wenhong Li, assistant professor of climate at Duke. These other mechanisms include a net release of energy over regions that are cooler during a natural, unforced warming event. And there can be a transport of energy from the tropical Pacific to continental and polar regions where the Planck Response overwhelms positive, heat-trapping local effects.
“This emphasizes the importance of large-scale energy transport and atmospheric circulation changes in restoring Earth’s global temperature equilibrium after a natural, unforced warming event,” Li said.
###
Jonathan H. Jiang and Hui Su of NASA’s Jet Propulsion Laboratory, managed by the California Institute of Technology, co-authored the new study.
Funding came from the National Science Foundation (#AGS-1147608) as well as the NASA ROSES13-NDOA and ROSES13-NEWS programs.
CITATION: “Unforced Surface Air Temperature Variability and Its Contrasting Relationship with the Atmospheric TOA Energy Flux at Local and Global Spatial Scales,” Patrick T. Brown, Wenhong Li, Jonathan H. Jiang, Hui Su, Feb. 1, 2016, Journal of Climate; DOI: http://dx.doi.org/10.1175/JCLI-D-15-0384.1
…oh, there you are. Hi.
Now, isn’t this better? There should be a better way to post comments, but I don’t know what it would be. I know Anthony has experimented with some of them. But until something better comes along, this will have to do.
So when a sub-thread gets über long, it’s time to start a new one, wouldn’t y’all agree? ☺
Chic Bowdrie,
Posted out of sequence b/c of scroll.
I did, and attempted to respond to his assertion masquerading as a question: “Why is the ocean warming not from above but below?” WordPress told me my response could not be processed. I’m not terribly motivated to try again given the number of threads I already have open. Long and short was, none of what he wrote below that question substantiated his assertion, and if the oceans were warming from below not above it would probably be obvious from the inevitable vertical convection that would evolve from the bottom … just as it’s obvious that the atmosphere is being heated mainly from the surface and not from the bulk of solar energy being absorbed within the first few hundred meters near TOA.
I submitted a longer response to this post from you last night, thus far it has not come out of moderation.
Brandon,
I get the notices by email and will keep my eye out. I think our discussions here and on the Briffa post are converging on the reliability of the surface and satellite measurements. Perhaps we should continue here exclusively?
I was interested in your response to the following exchange earlier:
The changes to ERSST, whether justified or not, do constitute a warming trend since 1995.
Now concerning the Monckton issue,
But it wasn’t an assertion. It was a question that deserves an answer. I would answer that there is insufficient evidence to know where the warming comes from. The errors in measurement are too large to say with confidence that warming comes from increasing CO2, or excess solar insolation, or from ocean warming originating from who knows how long ago. Solar insolation is greatly affected by clouds and I’m not aware of any definitive data indicating how much SW radiation is actually absorbed by the surface.
Had the intent been an assertion, I surmise that it would have been something like “global warming can’t be caused by fossil fuel emissions, because the troposphere hasn’t warmed as it would have had to according to AGW theory. His substantiation was that you would have to deny satellite data to claim that the troposphere is warming the surface.
Vertical convection in the ocean is not favored, because the temperatures are lower and density greater with depth. Turbulence at the surface and thermohaline circulation are other phenomena.
If the circulation is causing the warming, what does that have to do with fossil fuel emissions?
If that were obvious there wouldn’t be such a debate about it, as you and I are having. So what mechanisms and magnitudes do you attribute to the sources that are heating the surface(s) of the Earth?
Brandon,
This was a request you made over on the Briffa post.
Lest you ask me again here, I will give you my proof that all observed warming in the ocean and atmosphere could be explained by variability in the sun’s SW radiation that is absorbed by either the atmosphere or the ocean and land surfaces.
I already referred to evidence from Stephens et al. (2013) reporting that incoming SW radiation (gross minus reflected) is 240 +/- 2 W/m2. They also report outgoing as 240 +/- 3.3 W/m2. Trenberth et al. (2009) report incoming and outgoing from various sources ranging from 225 to 245 W/m2 for incoming SW and 236 to 254 W/m2 for outgoing LW. By your own calculations, the increase in ocean heat content is approximately 0.34 W/m2 which constitutes to over 90% of the increase in global heat content. Therefore we can account for less than 0.5 W/m2 of the energy imbalance whatever it may actually be. Since the imbalance from solar is possibly several times greater than that, I conclude that all of the increase in heat content could be due to the amount of solar SW insolation absorbed by the planet.
Chic Bowdrie,
I don’t think that post is coming out of limbo any time soon, but I saved some of it which I use below.
And my counterpoint remains: it’s the trend over the entire interval which figure more into climate sensitivity estimates. So if the IPCC are trying to pump up CO2 potency for political leverage, and NOAA are complicit in helping them do it, the last thing they’d be expected to do is reduce the overall trend.
“The ocean is warming not from above but below” is implicit. It’s an assertion which has been loaded into the question.
It’s an assertion that wants substantiation before it can be answered. I’ll demonstrate:
1) Why does CO2 warm the planet?
2) Why will AGW be catastrophic?
3) Why are you still beating your wife?
It’s one of the oldest rhetorical tricks in the book. People who habitually do it are not to be trusted in my opinion.
Welllll … maybe you should give an earful to Monckton in addition to me.
My standard response: all I can do is present evidence I find compelling. If it doesn’t meet your standards of “definitive” or “confidence” there isn’t much else I can do other than appeal to theory.
The troposphere’s absolute temperature is cooler than the surface. Surface warms the troposphere, not the other way around. 2nd law of thermodynamics.
Bingo.
Yes.
I don’t assert circulation is causing the warming. Here’s the basic argument: Sun warms first few tens of meters. GHGs modulate the rate at which oceans radiatively dissipate energy. Turbulent mixing carries some of that heat to further depths, thermohaline circulation also moves some of it, the balance is diffusive.
CO2 is a GHG, and burning fossil fuels is what’s causing the rise.
Yes that’s true. I was arguing that point as if you were Monckton, whom I don’t consider to be acting in good faith. It’s bloody well obvious to me; however, I should not impose that on you just because of my animus toward him.
I had a bunch of calcs and scribblings for a previous post that ended up on the cutting room floor, let me see … ah. Some of this is has been covered already:
—————
From Bintanja (2008) I estimate that the ratio of temperature change at the surface to deep ocean is ~5:1 so a 1 K change to surface would be expected to change ocean temps by 0.2 K, thus:
5.41E+21 kJ/K * 0.2 K = 1.08E+21 kJ to oceans for every 1 K change in surface temps. We can check this assumption against instrumental observation since 1955:
http://climexp.knmi.nl/data/itemp2000_global.png
Regressing that against HADCRUT4 surface temps over the same interval, I get a slope of 7.60, R^2 = 0.76, so the deep ocean model from Bintanja (2008) is in the ballpark with modern instrumental observation.
The oceans are deeper than 2,000 m; average depth is 3,682.2 m according to a 2010 estimate: http://www.livescience.com/6470-ocean-depth-volume-revealed.html (satellites again), so the 2,000 m layer works out to about 54% of the ocean’s total volume, and therefore mass. We can check this another way by doing some math against ocean heat content estimates for the 2000 m layer:
http://climexp.knmi.nl/data/iheat2000_global.png
Mean ΔOHC works out to 5.47E21 J/yr, and ΔT works out to 0.0019 K/yr on average, so:
That checks out within 1% of the expected result, which is rather better than I thought I’d get. From the same uppper 2,000 m OHC data, more calcs:
Using HADCRUT4 over 1957-2015 as a proxy for net atmospheric temperature change:
Given that the uncertainty of Stephens (2013) is +/- 0.4 W/m^2, 0.004 W/m^2 is looking like nothing more than rounding error no matter whether surface, radiosonde, or satellites are used to estimate the temperature change. However, noting that 0.004 / 0.6 * 100 = 0.7%, it’s in line with the 1% of net energy absorbed by the system the IPCC say we should expect.
My 0.34 W/m^2 calculation from 2,000 m OHC estimates is 0.26 W/m^2 lower than the 0.6 central estimate, and as such falls within the +/- 0.4 W/m^2 uncertainty interval. However it still wants an accounting. What “should” OHC’s contribution be? According to the IPCC (going by memory here), the estimated relative fluxes are as follows:
Given that the upper 2,000 m accounts for just over half of the oceans’ mass, it seems plausible to me that my missing heat is diffusing/circulating to lower layers. OTOH, the imbalance could be on the lower end of the Stephens (2013) central estimate. Some of both.
Mechanisms.
First the Sun. Here’s Lean’s monthly TSI reconstruction from 1882 through October 2015:
http://climexp.knmi.nl/data/itsi_ncdc_monthly.png
The average annual change over the entire interval is 9.06E-03 W/m^2/yr. However, that does not account for the fact that only half the planet is illuminated at any given time, nor that the angle of incidence is < 90 on the sunlit side everywhere except where the sun is directly overhead, so we need to divide by 4, giving 2.27E-03 W/m^2/yr. We've then got to knock off 30% to account for albedo, which gives 1.59E-03 W/m^2/yr. Or, to be fair, the ocean's mean albedo is 0.06, not 0.30, so call the maximum plausible upper bound 2.13E-03 W/m^2/yr.
… so AT BEST the increase in TSI since the late 19th century could only account for between a quarter and a third of the observed OHC increase in the upper 2 km layer over the past ~60 years.
CO2:
http://climexp.knmi.nl/data/imaunaloa_f.png
The net change over 1958-2015 is:
And for parity with the solar calcs since 1882:
Ratio comparison to solar forcing:
… which gives a lot of wiggle room for CO2 vis a vis the energy imbalance estimate uncertainty and magnitude IF the 5.35 W/m^2 forcing coefficient is correct. I haven’t accounted for negative anthropogenic forcings (mainly aerosols) which have the effect of reducing solar influence. There’s also methane, albedo change (ice/snow loss, black carbon), water vapor feedback, etc., to consider. This is wayyy to long already and I’m too tired to get to it in this post anyway.
We could attempt to juice solar by going all the way back to the Maunder Minimum:
http://climexp.knmi.nl/data/iTSI_TIM_Reconstruction.png
… problem is, the shape of the OHC curve is all wrong.
TSI peaked ~1960 and has been in a slight decline. If the runup from 1700-1960 caused most of the observed imbalance, we might still expect to see OHC rising, but at a decelerating rate. The data above show the exact opposite. The shape of the OHC curve best matches the shape of ln(CO2). I find it very difficult to call that sheer coincidence.
Emphasis added. A lot of things are possible. I know of no TSI reconstructions that match OHC from 1957 and surface temp change from 1850. It doesn’t work. If it’s not CO2 and not the Sun, it’s something else we haven’t found, and that seems extremely unlikely to me. Logically I cannot rule it out, OTOH, I don’t think it irrational to believe what the consilience of multiple lines of evidence and radiative physics suggest: it’s CO2.
To change my mind requires that someone identifies the … Force X … applies a plausible physical model for it, and demonstrates it with empirical evidence such that it is a better “predictor” of the past than the CO2 model. I wasn’t kidding about supporting a Red Team to do such a thing. I found it curious that I met with such resistance in this forum when I expressed that sentiment.
I cannot write another word. I hope some of the above makes sense.
BG-“TSI peaked ~1960 and has been in a slight decline. If the runup from 1700-1960 caused most of the observed imbalance, we might still expect to see OHC rising, but at a decelerating rate. The data above show the exact opposite. ”
You don’t seem to be including any lag time for ocean temperatures to respond to whatever could be increasing (or decreasing) at the surface. The 2000 m layer does not respond in lock step with atmospheric (air) or land surface warming or cooling. In fact, if TSI peaked in 1960, we’d still see increasing OHC at the same rate (not decelerating) for another 100(or more) years after that as the ocean plays catch up. The way the ocean absorbs and releases heat is like a very delayed echo of what happens on the surface.
And long wave radiation sent back to the surface by CO2 molecules in the air is so weak it can only affect a few microns of the surface layer anyway.
Aphan,
It’s implicit in the statement you quoted. The only way for rate of change to stay constant when net external forcing changes is if there is a feedback process of sufficient magnitude to sustain it. The implication there is that the feedback process is not instantaneously responsive to net forcing. Ice albedo feedback is the first example that comes to mind.
I would think the top 2 km of ocean barely responds to land or atmospheric temperature changes much at all.
Only if there is some feedback mechanism sustaining the rate, otherwise you’re creating energy out of nothing, which violates the 1st law of thermodynamics.
Only because the surface and atmosphere have less thermal inertia than the oceans, and are therefore more responsive to external forcing.
The Sun heats the oceans. LW-emitters in the atmosphere modulate the rate at which they dissipate that absorbed energy.
In other news, a brick is opaque to all frequencies of sunlight.
Brandon,
Don’t worry about the other post. I got the gist of it here and from where you posted elsewhere. Also there is a good discussion relating to surface vs. sats measurements on a recent post at Climate etc.
I think the allegation is that the intention was to eliminate the pause. If the overall trend has to be sacrificed, so be it. I’m not taking that position, because I haven’t been looking closely at the data. Based on the divergence between surface and satellite data, I have to wonder.
You’re right. I was thinking of the previous question of where the warming comes from, which leads to that next question. BTW, his assertion was contingent on data that he is still looking for confirmation of. So it’s more of a hypothetical question. Take another look at his post.
Are you claiming that IR active gases dominate energy transfer at the surface, in particular, increases in CO2 from fossil fuels? Because from our previous exchanges, I was under the impression that you were aware that the atmosphere is opaque near the surface. This means that increases in IR absorption have no further effect. What mechanism are you proposing for CO2 to cause a rise in temperature above that which would normally result from the combination of solar heating, ocean turbulence, thermohaline circulation, evaporation, diffusion, convection, and wind?
Your calculations are admirable, but IMO you miss the big picture. Yours and Stephen’s estimates are less than 1 W/m2 imbalance in energy. The errors in measuring incoming and outgoing energy are greater than that. Then you have to consider all the other processes involved in getting that energy distributed. The purpose of weather is to redistribute the heat. The ocean is a huge reservoir and your calculations are too ballpark for anything other than confirmation that the ocean is warming somewhat.
I didn’t hear any mention of cloud cover. TSI is only one factor that contributes to the 161 or so W/m2 actually absorbed by Earth surfaces.
“IF” is big one. To the degree I’ve looked into it, the numbers come from programs that convert changes in the spectra of an atmosphere of given composition to changes in radiation absorbed and emitted from the atmosphere at that point in time. IOW, all else being equal, a change in CO2 produces a log proportional change in radiation. The problem I have with this is that all else isn’t equal because of all the other processes involved in atmospheric energy transfer.
Why is your TSI plot baseline increasing? Is it sunspot index like the one below? There is reason to believe the OHC plot results from smoothing and lag effects from the sun’s idiosyncrasies. This is the conventional wisdom, not necessarily mine. There are also the magnetic effects and cosmic ray hypothesis out there as well. JoNova has a recent post on the former.
It’s not irrational. I just think it more rational to continue to pin down the uncertainties and remain open to the ongoing research into the “something else we haven’t found.”
Not only demonstrating a force X. The CO2 model must be supported with something other than a correlation or a computer model. There was the contradictory Wood experiment back in 1909 and a few conflicting reproductions since. Nothing experimental that I know of.
I missed that, but you’ve painted a target on yourself. I don’t think you can expect much support here by pushing the AGW pov. I appreciate it though, because it forces me to remain skeptical of my own biases.
Chic Bowdrie,
Thanks for the heads up.
I understand the allegation. I have no other different answer to give you on this; as it’s come full circle several times I think it best to table it and leave it unresolved between us.
You need to be specific about the time component. Instantaneous, no. Change over long periods of time, yes.
Yes.
From our previous exchanges you know that I disagree with that and should know why, even if you disagree with it.
Here it is again. The atmosphere is constantly emitting LW in all directions. The main thing carried all the way to the top floor by convection is latent heat. That’s why upper air is expected to warm faster under ANY external forcing than the surface and/or atmosphere near the surface. All else pretty much nets out because convection goes both ways simultaneously all the time.
Thank you, and I don’t think so.
Think about it more. Do you really think the true imbalance is further away from zero than published?
We’re never going to be able to consider everything. Literature considers far more than I have, which I alluded to in my comments. Here’s GISS’ take on all radiative forcings they have considered: http://data.giss.nasa.gov/modelforce/
http://data.giss.nasa.gov/modelforce/Fe_H11.gif
You are free to provide evidence of some other positive forcing which explains OHC increase and temperature trends over the entire respective periods those data are available. Until then, anyone, including me can always say, “it could be something else”. Hypotheses want testing, I have tested mine in about as much detail as I am capable of doing at present.
Pedantry alert: I don’t know about purpose, but yes, heat redistribution and dissipation are manifestations of what we call weather.
Somewhat warming? I would say massively, and the subjective qualifier only makes sense to me as a comparative:
Nearly two orders of magnitude difference. If you’re looking for rounding error, look no further than the change in atmospheric energy content.
Paleoclimate variability across tens of thousands of years suggests:
a) neutral or weakly negative cloud feedback, or
b) higher climate sensitivity to any external forcing than current estimates.
The IPCC are more supportive of (a).
Indeed. However, the main reason supposed for more cloud cloud coverage in a warming climate due to any cause is an increase in specific humidity, which would also tend to cause a positive radiative feedback. Speaking in terms of central estimates, direct forcing from CO2 is ~1 K/2xCO2 while total climate sensitivity to CO2 is ~3 K/2xCO2. My understanding is that most of the difference is feedback gain due to increased specific humidity.
All indications I’m aware of are that wv feedback swamps any cloud feedback which exists.
In terms of the formalities of our debate, it’s the main IF.
In terms of what literature has to say, the 5.35 W/m^2 forcing coefficient is one of the best constrained estimates of the lot. It’s the climate sensitivity of temperature to any forcing that is the problematic one because the temperature response is a function of all the non-linearities in the system.
I don’t understand the question. To me, baseline in this context means a time period used to establish normals for purposes of computing an anomaly value. Both solar plots give absolute values.
It’s been a while since I read how those reconstructions were done and I don’t have the gumption at the moment to look it up again. Leif Svalgaard collects papers on solar activity reconstructions here …
http://www.leif.org/research/
… and as you’re probably aware he frequently participates here and is responsive to questions when the Sun is the topic of the head post.
So long as the climate sensitivity parameter to any forcing remains uncertain, you’re going to have trouble nailing down temperature response to changes in insolation.
Yes I know. There are many other possibilities. If you think one is better than CO2, you need to show me.
I’m all for further research to reduce uncertainties. I’m not for waiting around to know everything with absolute certainty because that will never happen.
Such as what? Support any of your above listed hypotheses without resorting to models or correlations and we’ll talk. Every science with which I’m somewhat familiar is heavily reliant on both of those things.
I never expected to, and long experience has reinforced that.
I appreciate it too, however we may have reached a point where those returns are diminishing from me. Your main objections to evidence or calculations I provide are typically met with “too uncertain” or “have you considered X”. Yet you have not provided much in the way of evidence or calculations to support X, or given me any reason to consider that the uncertainty of X is less than what I have already provided. As well, any alternate model you come up with is likely going to rely on empirical evidence which contains uncertainties. Yet you still believe the CO2 model to be incorrect. Those are your apparent biases as I see them, but it could be bias bias on my part as well. 🙂
Cheers.
Brandon,
Take as much time as you need. The problem is, with all the other conflating factors, you may never see a clear CO2 signal amongst all the noise.
Sorry, if I missed something earlier, but that is why I’m bringing it up again. I don’t think you’ve been explicitly clear on this. Perhaps it’s because up to now I haven’t been asking my questions clearly enough. Here’s your answer to the question about the mechanism for CO2 affecting temperature rise:
There’s nothing in that statement that explains how CO2 modifies LW or increases latent heating of the upper atmosphere. Indeed, any external forcing should increase latent heating and that signal should be evident in elevated precipitatable water vapor in the shorter term, not from rising CO2 in the longer term.
I don’t see how convection going both ways changes anything. The net energy flux is upward. Convection cools. Are you saying CO2 reduces convection?
No, probably closer to zero.
All the forcings represented in your GISS diagram, except for solar irradiance, are to a large degree retroactive. They all depend on what the solar input is. The forcings affect how weather is able to redistribute the heat which is trying to escape. One way or another it has to go through the atmosphere. Due to the existence of IR active gases that emit radiation to space, the atmosphere is not a good reservoir for storing any heat.
There are two ways to look at this. Either the atmosphere is warming more than the 0.004 W/m2 reflects, or the ocean is not warming as much as the 0.34 W/m2 reflects. I suspect the latter.
a) Is there cloud data going back that far?
b) Are you invoking a circular argument based on CO2 having some known relationship to temperature?
There is no definitive evidence that CO2 increase is the cause of humidity increase. And AFAIK no definitive evidence that cloud feedback is positive. I am surprised to learn IPCC agrees with that.
We should take that up on a future discussion. Are you aware of the Spencer/Braswell work in this area? My view is that the humidity cloud relationship is thermostatic.
5.35 W/m2 is the theoretical forcing calculated by taking the deriviative of the SB equation and plugging in an average temperature about 288K. It has nothing to do with CO2. Of course, the temperature response depends on all the contributions, some of which oppose each other. But the theoretical basis for isolating the CO2 sensitivity comes from spectroscopy. This is what the climate science community has to nail down. IOW, demonstrate a temperature affect from a given increase of CO2.
Precisely. Well said.
Models and correlations are helpful. But direct experimental challenge is required to remove inevitable doubt when relying on indirect methodology. This is a problem for the atmosphere because the lab is so large and uncontrollable. However, I don’t think it impossible for a definitive Wood 1909 type experiment to be worked up. It’s just not something I can do now or maybe never.
No, just inconclusive. In contrast, your approach is to assume the circumstantial evidence for CO2 is conclusive and dismiss contradictory evidence that doesn’t conform to your current understanding. I prefer to continue to look for more convincing evidence of any effect that CO2 has and be open to other evidence that better accounts for all physical phenomena in play.
Perhaps for me too. I can’t devote any more time now to go deeper into the subjects which IMO are crucial for the AGW debate. The realization of any particular degree of warming has to be verified. If not by experiment, then by better radiative convective models. As I mentioned before, the influence of clouds on forcing and feedbacks is another area I am interested in.
OK I didn’t insert my tsi plot I referred to above. Let’s try this:
Yes, I’ve seen similar plots … actually I probably have that data. Sunspot number correlates well with TSI.
Chic Bowdrie,
You wrote about things which sustain my interest, so I will reply.
With evidence in hand, full-period instrumental records are clear to me, and I can account for some of the major known confounding factors in the residual. You’ve seen this before:
http://3.bp.blogspot.com/-vniapHOw-Po/VqQqEXqI2tI/AAAAAAAAAkQ/387eopVqVoM/s1600/HADCRUT4%2Bnon-CO2%2Bmonthly%2Bcontributions%2B2015-12.png
LOD (Length of Day anomaly) is the only parameter which does not have a solid theoretical underpinning, but I have read plausible explanations. CO2 is clearly dominant over the entire interval:
http://3.bp.blogspot.com/-5NsdtYi0Ifg/VqQqEq8O-BI/AAAAAAAAAkU/BzdI7Q7-Gsk/s1600/HADCRUT4%2Bvs%2BCO2%2Bmonthly%2B2015-12.png
Sub some observed Force X (or combined effects of multiple ones) for CO2 for me to plug into that model, and I’ll pay more attention if I get back an R^2 value on the order of 0.9.
It’s implicit in the observation that re-emitted LW is omni-directional, something which is quite independent of directionality of any absorbed flux. Going back to the 1D model, 50% of thermalized LW will be re-emitted up, 50% down. IOW, some of the thermalized energy will be “bounced” back from whence it came and re-thermalized at a lower altitude. The converse is true of the upward-emitted LW, however, the higher a LW photon goes, the smaller the absorption cross-section, thus the greater (on average) distance it would be expected to travel before absorption and thermalization again. As well, higher = closer to TOA, meaning greater probability of escape to space.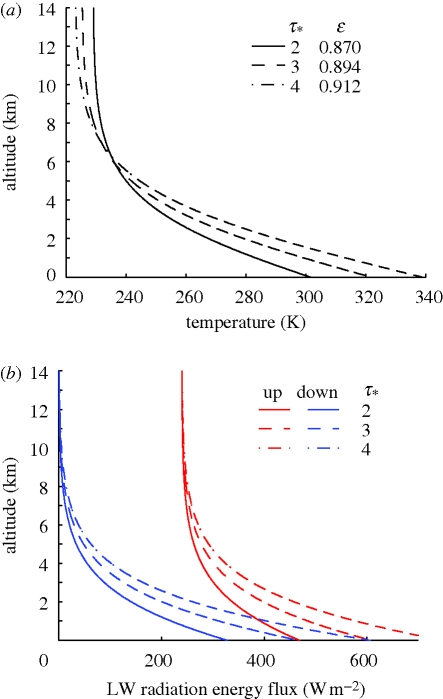
The net result can be thought of as an infinitely-layered onion, with each successively higher layer having an increasingly negative LW loss. Or conversely, each successively lower layer has an increasingly positive LW loss.
Thus, lower atmospheric layers will tend to be warmer than upper layers because the ratio of radiative gain to radiative loss will be higher the nearer any given layer is to the surface: http://www.ncbi.nlm.nih.gov/pmc/articles/PMC2871903/
(a) illustrates the temperature gradient as a function of altitude
(b) illustrates net LW loss at all altitudes, but becoming increasingly less negative as altitude decreases
See note [1] below for details and caveats.
This goes all the way back to your comment on the Lindzen thread: http://wattsupwiththat.com/2015/12/26/lindzen-a-recent-exchange-in-the-boston-globe-clearly-illustrated-the-sophistic-nature-of-the-defense-of-global-warming-alarm/#comment-2108876
The way I see it, those six photons get on the next elevator and therefore 94% of the energy is going up by convection. Also increasing CO2 doesn’t slow down the rate at which the energy is going up. That is determined by how much solar insolation gets on at ground level.
To which I replied in my very next post:
Keep in mind that for every up elevator in the world there is one which is going down.
Not at (pseudo-)equilibrium — don’t forget the Sun. Otherwise, yes.
Upward convection is a cooling process. We’re dealing with an equilibrium system here. You cannot leave out one side of the relationship and expect to get the correct answer.
Latent heat is the main thing that makes it to the top floor before being released, at which point it has a warming influence at that layer. Hence more warming at altitude than at the surface, especially in the warmer and wetter tropics.
Your notion that convection carries thermalized LW from the first few meters to the top and dumps it off as LW does not work because:
a) the atmosphere is always emitting at every level
b) convection goes both ways
No. The argument is that LW-active species increase convection over what would be seen in, say, a pure nitrogen atmosphere. Think about the Carnot cycle and what happens when the temperature difference between the hot reservoir and cold reservoir increases. This is why you’ll also see lapse rate response discussed in literature.
Makes sense for an equilibrium system to tend toward that value. It also makes sense to me that uncertainty in downward flux estimates would be offset by uncertainty in the upward direction, thereby reducing the uncertainty range of the net imbalance estimate.
I would also expect flux estimates from multiple sources to converge on the “true” values, so we use OHC estimates combined with satellite observation, etc.
Yes and no; there’s an absolute temperature dependency in there as well. However, mostly yes I’d say.
Yes, that’s a KEY point.
Partially true. The main reason is as I’ve already demonstrated; the atmosphere’s mass is negligible wrt the oceans, and only has 1/4 the specific heat capacity to boot. That the oceans only allow LW penetration to a few microns, but SW penetration to tens of meters makes them a much better “greenhouse” than the atmosphere.
Or both estimates are reasonably correct. I don’t understand why you suspect the latter to be more off, especially since you just wrote above that “atmosphere is not a good reservoir for storing any heat”.
a) If there are, certainly not with the same fidelity as modern instrumental estimates.
b) No. It’s an inference I’m making that relies strictly on temperature response to ANY external forcing. If cloud feedback were strongly more negative than present estimates, paleoclimate temperature reconstructions either show too much amplitude, or the climate sensitivity parameter to ANY external forcing is higher than presently estimated (possibly implying that various feedback gains are higher than present estimates).
There is one relationship between CO2 and temperature which should not be controversial: its partial pressure in aqueous solution. Hence, CO2 atmospheric concentration tends to lag ocean/atmospheric temps in the paleo records.
We’re back to the “definitive” qualifier when it comes to evidence. Your statement above is consistent with “there’s no definitive evidence that increased CO2 in the atmosphere causes temperature rise”.
My questions to you then are:
1) Do you think temperature rise due to ANY cause would be expected to increase specific humidity?
2) Do you think there is definitive evidence suggesting that specific humidity has increased?
In my view, they don’t just “agree with it”, they’re how I know about it to begin with! Sorry to say, I’m not surprised you’re that surprised by this.
No. I am aware that Spencer recently wrote a blog post wherein he said that near-surface humidity is a good proxy for sea surface temperatures:
http://www.drroyspencer.com/2015/12/2015-will-be-the-3rd-warmest-year-in-the-satellite-record/#comment-203356
Citation?
I believe that Myhre et al 1998 is the canonical reference for that value: http://folk.uio.no/gunnarmy/paper/myhre_grl98.pdf
Tut. After all the time you’ve spent saying that none of my conclusions have been “definitively” demonstrated in literature, whence your apparently high confidence that it isn’t CO2?
Apropos to all the null hypothesis talk upthread, this is what was drilled into my head in Stats for Dummies: rejecting the experimental hypothesis only means that the observed phenomena do not support it at the stated level of significance. That does not necessarily mean that it is false, nor that the null hypothesis must be true.
Exactly. This is a key point of agreement between us, because it is central to the reason that the IPCC 1.5-4.5 K/2xCO2 estimate is so wide, and why it has remained virtually unchanged since the FAR.
Yes, backed by empirical lab-controlled experiments, e.g., MODTRAN and HITRAN databases, which are also used in applied sciences and engineering fields having nothing to do with climate.
The only place that is “debated” is by people who reject the theoretical basis for LW atmospheric radiative forcing. For everyone else it’s a question of magnitude of the forcing, and magnitude of the temperature response to that forcing … the latter of which is just as salient when discussing any other external radiative forcing.
I doubt very seriously you will accept any evidence, however “definitive”, until you get over your objections to the theoretical basis. I’m very willing to continue our discussions about that.
That you acknowledge such points when I make them is one reason I continue to enjoy discussing things with you.
Ok good. So, correlations help most when there is a theoretical model to explain them. Otherwise, they only hint at cause at best. You ever seen this website?
http://tylervigen.com/spurious-correlations
Some of them are hilarious.
Ok. I have some trouble believing that’s the only reason as you continue to challenge the theoretical underpinning. OTOH, I have no choice but to take you at your word, so I will.
I understand that it may look that way to you. Can you actually think of any contradictory evidence I outright reject? I’m big on consilience of evidence. I see that as a very different thing from conformationally-biased cherry picking. But of course I would think that, right?
I’m not saying I don’t have other biases either. One of the big ones is my acceptance of the theoretical basis, which I spent a lot of time learning from first principles, with an emphasis on getting them from literature not directly related to climate science.
Public opinion polls tell me that my mostly liberal politics are the best predictor of my beliefs about AGW, so I can’t rule that out either.
Thing you might not understand about me is that I don’t want AGW to be real and resisted believing in it for over a decade. The latter one you couldn’t possibly know about me, and have no reason to believe either, any more than the former. But both are true.
Not one I know much about, so that might be interesting. As I lead with, this post got back to topics I’m more interested in discussing should you feel the same way.
Regards.
—
[1] The image is output from a 1D model that only considers radiative effects, but explicitly ignores sensible heat, convective/advective and latent heat transfers, as well as scattering effects and wavelength-specific emissivity (i.e., they use grey body/black body models for atmosphere and surface respectively). The authors cite the reason for such a simplified model as:
The philosophy for choosing such an idealized Earth system is that it retains enough physics and can still be described by a simple one-dimensional vertical climate model to allow analytical evaluation of the vertical profiles of temperature, radiation energy and entropy fluxes.
They don’t propose to use it as a substitute for AOGCMs or other complex climate models which do appropriately take other quite important non-negligible physical processes into account.
I like the model because its simplicity is illustrative of the central premise of atmospheric radiative forcing.
BG “Apropos to all the null hypothesis talk upthread, this is what was drilled into my head in Stats for Dummies…”
Ahhhhh statistics. Misapplied to the scientific method all the time.
http://www.nature.com/news/scientific-method-statistical-errors-1.14700
Aphan,
I’ve read my Briggs, and by him am all too aware of the false confidence inspired by wee-pee values. Please explain how that rebuts what I said about null hypothesis testing. Also please explain how you would do things differently. Finally, please tell me how it is you are so confident about your own conclusions. Thanks.
BG- What does Briggs have to do with anything? I didn’t set out to “rebut” what you said about null hypothesis testing, in fact, I have no idea exactly what you would define as the null hypothesis in this particular discussion right now, and all I do differently is not put my faith in statistical correlations or consensus thinking. That I am not confident in your conclusions does not automatically make me “so confident” in my own. That False dichotomy is yours, not mine.
Brandon,
First, I repeat, my compliments on the model work you’ve done. I wish I had the time to do it myself, but then I’d have to give up commenting on blog sites. I have a vague feeling I’ve seen some candidates for a factor X that would replace the dependency on CO2. I’ll see if I can find anything.
I do have a question about where your CO2 data prior to 1958 comes from. Notice that between 1910 and 1980, the correlation of HadCRUT and CO2 is terrible even allowing for substantial discontinuity before 1958.
Moving on to the mechanics of CO2’s influence on temperature. Before I respond specifically to any of your comments, I want to clarify a few concepts. Local temperature equilibrium or LTE means that at any level of the atmosphere the incoming and outgoing radiation must balance. Logically, the outgoing must be equally 50% up and down. Because of the change in density which affects path length, it is also logical that slightly more absorption comes from below than above. The magnitude of the discrepancy increases with altitude. I believe this is consistent with your view and the Wu and Liu paper.
However, the atmosphere is not always in LTE. When the sun shines the surface and atmosphere are warming. There must be more absorption than emission otherwise there would be no temperature change.
A pseudo-equilibrium condition can occur when there is no sun shining. At some point the LW from the surface will be approximately the same as the LW emitted to space. The temperature gradient at that point is not caused by radiative effects. The addition of solar energy produces a temporary deviation from the pseudo-equilibrium lapse rate which is primarily determined by gravity.
I think you mean decreasingly negative LW loss. Increasingly positive is not the same thing.
First of all, the lower atmospheric layers are warmer because of the lapse rate as I explained above. And the ratio of radiative gain vs. loss at the TOA is practically zero. The question is how much the gain vs. loss is at the surface. The paper you referenced has about 320 W/m2 gain vs. 460 W/m2 loss. That’s a discrepancy of 140 W/m2 that either comes from solar heating of the atmosphere or sensible and latent heat. Compare that to the Trenberth diagram. The gain vs. loss ratio is much closer to one. I would argue that it could be even closer to one. I didn’t read the details in the paper, but I noticed your footnote where the authors ignore sensible and latent heat and convection. So I don’t understand what new information this provides or what central premise of radiative forcing it illustrates.
I was confused by this and that’s why I expressed my view of pseudo-equilibrium above. When is energy flux ever downward? Maybe some local eddy where warm air sweeps over a cold surface somewhere. Otherwise the planet is constantly shedding the daily dose of sunlight.
Convection is a cooling process because it transports warm air up in exchange for cold air down. Not that complicated. The atmosphere absorbs and emits at every level while convection goes both ways. I don’t have the calculations demonstrate, but my guess is a diagram similar to Wu and Liu (2010) picturing zero difference between upward and downward LW until you get to upper troposphere illustrating the possible share of the flux contributed by convection and atmospheric heating as altitude increases. The upper troposphere is where convection peeters out, latent heat dumps its energy, and any contributions from atmospheric SW end up.
I’m happy to let the uncertainty argument go and also accept your estimates of OHC and warming rates, etc. Let’s focus on the CO2 model.
No big deal. It just seems more likely to me that the OHC estimates are high. But there’s no point in belaboring it because there just estimates and I’m happy to work with them as they are. I’m more interested in how and how much CO2 contributes to the warming.
I would expect some short term influence of temperature on humidity. Eg, in 1998 there was a spike in water vapor. Now which came first, the chicken or the egg? That humidity spike relative to long term monthly averages was in April 1998. UAH temperature spike occurred on same month. Same thing happened in 2010. Mind you, a spike is from 24 up to 25 inches or whatever the units are.
In the long term, extra humidity leads to more clouds, hence cooling. Therefore, there is a thermostatic effect at play IMO.
Awhile back, I downloaded some data, probably at your suggestion, and did see some indication that periods of high precipitatable water vapor correspond to trends. Could be anecdotal, but it seems that water vapor was relatively constant during the 70’s and 80’s and then gradually increasing up to present. Relatively wide swings prior to 1975.
Don’t ask me to explain it, but here is some interesting stuff on water vapor feedback which is related to cloud feedback somehow.
http://www.drroyspencer.com/2014/04/enso-sst-ceres-forcing-and-feedback-the-travesty-continues/
Spencer: “We have three papers published on this (Lindzen has others), and as far as I can tell, the climate community still does not understand the implications of our work.”
Yes, that‘s what Wiki and IPCC both refer to. Hmm. Do you think it’s a coincidence that 5.35 = 0.988 * 4 * sigma * 288^3? I did some surfing to figure out where I got the idea for this calculation. Couldn’t find anything, but I did find several references which indicate how murky the 5.35 number is. I’m putting those references in a separate comment.
I was referring to the constant 5.35. You stated it was “the climate sensitivity of temperature to any forcing that is the problematic one because the temperature response is a function of all the non-linearities in the system.” Either you are confused or Myhre et al. (1998) are. I know I am.
The theoretical basis includes two parts. One is experimentally verified dF = 5.35 * ln(C/Co), which relates the change in radiation intensity due to a change in CO2 concentration. The other is dT = lamda * dF which relates a change in radiative intensity to a change in temperature. I’m not aware of any experimental verification of the latter, but would like to be if you know of anything.
Funny those. Take home point is that model correlation is no substitute for experimental verification.
Not really. I may have exaggerated a bit. I’ll keep my eye open from now on though. Heh.
That’s helpful to know. I was immediately skeptical, possibly because of my conservative bent. But I’m more interested in knowing the truth than being right. I hope that’s your bottom line as well. But regardless of what your motive is, having to clarify my position is helpful to me.
To summarize then, we have two open issues, the theoretical basis of CO2 sensitivity and water vapor/cloud forcings and feedbacks. These comments will probably close soon and we may have to pick up elsewhere.
Brandon,
I may have been a bit premature in assuming that the 5.35 factor was experimentally verified. It may be just calculated from spectra using the MODTRAN and HITRAN programs. The first link I read, http://nov79.com/gbwm/equations.html , referenced several places discussing climate sensitivity and radiative forcing. The source given for that page was comments by Norm Kalmanovitch at Climate Etc.:
https://judithcurry.com/2011/06/10/lindzen-and-choi-part-ii/#comment-74715
The subsequent responses by other commenters are fascinating.
It’s too late in the evening for me to pursue this any further, but I get the feeling I’ve only scratched the surface.