Guest Opinion: Dr. Tim Ball

They are physically cleaning up after the “Blizzard of 2016” in the northeastern US. The job is not as onerous as anticipated and is going slowly because the government is in charge. However, it is time for an intellectual clean-up because of what went on. The entire sequence of events is a classic example of environmental and climatic exploitation that parallels the anthropogenic global warming (AGW) deception. [That same sequence] shows what is wrong with weather and climate forecasts, and how it is all amplified and perpetuated by people who don’t know what they are talking about, or, worse, want to know.
The underlying objective was to hype the potential for catastrophe against a backdrop of implications that the event is unnatural. The actors on the stage were the weather office bureaucrats at National Weather Service (NWS) and the National Oceanic and Atmospheric Administration (NOAA) who are key players in the global climate deception that is the Intergovernmental Panel on Climate Change (IPCC). Mainstream media TV meteorologists were seeking sensationalism under the guise of warning and protecting the people and supported them as usual. Regular mainstream media ambulance-chasing reporters, looking for extremes and creating them when necessary followed them on stage. They later produced stories explaining how the storm was evidence of climate change and global warming. They did this as they ignored the physical evidence, reality, the historical context, and the actual mechanisms of climate change.
The Buildup
The Slate headline threatened,
“This “Blizzard for the Ages” Headed for the East Coast Is Very Much the Real Deal.”
“Since early Saturday, nearly every single run of every major model has shown the potential for a foot or two of snowfall on a track to hit somewhere between Northern Virginia and Boston. What’s amazing—perhaps even more so than the impressive potential snow totals—is that all the major weather models are already locked in so far in advance. Simply put: There’s definitely a big storm coming, it’s just the details that are still being worked out.”
Notice it is ‘definite’ because all the models agree. In another speculative report, the rhetoric and hyperbole all heightened the anticipation.
“Winter storm Jonas is set to affect almost 76 million people as several feet of snow hit the north-east US, causing travel chaos for millions as internal flights are grounded and international flights under threat of cancellation.
The storm is expected to bring heavy snowfall to 15 states, with blizzard warnings, plunging temperatures and coastal flood warnings in place from 22 to 24 January.”
As usual, in today’s PR controlled and directed media, they produced slogans including Snow-mageddon and Snow-pocalypse and Snowzilla.
The Basis For the Hype
I am sure many skeptics reading the Slate quote immediately ignored what it said when they read the phrase “every major model.” Once again they are justified as the failed predictions attest. In this case, it is not just a single model failure but all of them. There is one interesting difference from previous failures that may reflect a growing awareness in the weather agencies that a credibility gap is growing. In an article titled “Snowstorms forecasters under fire as ‘historic’ accumulation failed to materialize” the spokesperson for the US National Weather Service said,
“My deepest apologies to many key decision-makers and so many members of the public,” wrote Gary Szatkowski, the meteorologist in charge of the organization’s office in Mount Holly, N.J. “You made a lot of tough decisions expecting us to get it right, and we didn’t. Once again, I’m sorry.”
Does he make the same apology for the failed IPCC predictions his agency promotes?
The spokesperson for the Canadian weather office was more defensive in his remarks.
“There is still a lot of complexity and it is still an imperfect science,” said Peter Kimbell, warning preparedness meteorologist at Environment Canada. However, he rejected the notion that forecasters get the weather wrong most of the time. “We actually get it right a lot of the time,” he said. “And it all depends on your perspective of what getting it right is. If we say we’re going to get 15 centimetres of snow and we get 12, is that good or not good?”
The claim of a 3-centimeter error is clever because it puts it within a tolerable range, but that is not what happened. Besides his agency doesn’t acknowledge the imperfect science when it makes global warming predictions for the next few decades.
While Philadelphia, New York and New Jersey had braced for 30 to 60 centimetres of snow, they got far less than that. New York City received about 20 centimetres, Philadelphia a mere 2.5 centimetres or so. New Jersey got up to 20 centimetres.
This is not a surprise because New Scientist reported that Tim Palmer, a leading climate modeller at the European Centre for Medium-Range Weather Forecasts in Reading England said:
I don’t want to undermine the IPCC, but the forecasts, especially for regional climate change, are immensely uncertain.
What people overlook is that these are the same agencies, the NWS, NOAA, and EC, who are the IPCC. They are the same agencies telling political leaders and the public that the IPCC forecasts are accurate and must form the basis of political action. In the case of the snowstorm forecast, the political leaders are left without options. They believe they must over respond because a failure to prepare is political suicide. The politicians are in no position to challenge their weather bureaucrats, as Maurice Strong knew when he set up the IPCC through the World Meteorological Organization (WMO).
Historical Context
The storm of 2016 was a standard “Nor’easter”. They are so normal that there is a separate entry in Wikipedia. These storms develop as low-pressure systems along the Polar Front, the boundary between the cold polar air and the warmer subtropical air. They begin in the lee of the Rocky Mountains and are often called Alberta or Canadian Clippers. In the interior of the continent, the circulation brings moisture from the Gulf of Mexico to create legendary blizzards. When the Cold Front pushes toward the Atlantic coast, it tends to run parallel to the coast and the low-pressure system circulation means moisture is picked up from the Atlantic Ocean, and the prevailing northeast winds provide both the name “nor’easter” and the heavy snow conditions.
Lack of knowledge of the mechanisms and failure to check the history of such storms didn’t only hamper politicians.
False Attribution To Global Warming.
In a Business Insider article about “The Blizzard of 2016 (aka Winter Storm Jonas)” Tanya Lewis argues, “Massive snowstorms don’t disprove global warming – in fact, quite the opposite.” This statement is wrong for two major reasons.
1. Meteorologically, because the IPCC claim that greater warming will occur in the polar air than the tropical air. If true, this decreases the temperature difference across the Polar Front. The intensity of storms is determined by that temperature difference, known as the Zonal Index.
2. Historically, because there was a much greater storm in 1888 that followed the same path as the storm of 2016. Global temperatures were lower at that time.
The details and impact of “The Blizzard of’88” are described in a 1976 publication by the US Depart of Commerce, National Oceanic and Atmospheric Administration (NOAA), Environmental Data Service written by Patrick Hughes and titled “American Weather Stories” (see image). Here is what one report outlined.
The blizzard cutoff and immobilized Washington, D. C., Philadelphia, New York City, and Boston. Snowfall averaged 40 to 50 inches over southeastern New York State and southern New England, with drifts to 30 and 40 feet. In Middletown New York, snowdrifts were reported to have covered houses three stories high. The townspeople had to tunnel through the snow like miners, even shoring up the passageways with timber. For two days, frequent gale force to near hurricane winds accompanied below freezing temperatures which ranged from near zero to the low 20s over much of the area.
Men, women, and children died in city streets, in country fields and on ice-choked ships and boats. Over 400 died, 200 in New York City alone. Thousands more suffer everything from exhaustion to amputation of frostbitten limbs.
The great storm buried trains all over the northeast, marooning passengers for days in some cases for a week or more. The blizzard was a marine disaster from Chesapeake Bay through New England. Some 200 vessels were sunk, grounded, or wrecked and abandoned. At least 100 seamen died in the storm they called the Great White Hurricane. Of 40 vessels in Philadelphia’s Harbor, only 13 escaped destruction or disabling damage, and at least 30 crew members perished.
Maximum wind velocities recorded range from 48 mph at New York City to 60 mph at Atlantic City and 70 mph at Block Island.
Ironically, the report notes,
“The Blizzard of ’88 was not the most violent storm to visit the northeast.”
Summary
Michael Crichton identified the overall challenges in analysing the events preceding, during, and following the Blizzard of 2016.
The greatest challenge facing mankind is the challenge of distinguishing reality from fantasy, truth from propaganda. Perceiving the truth has always been a challenge to mankind, but in the information age (or as I think of it, the disinformation age) it takes on a special urgency and importance.
As a finale and evidence of unwillingness to face facts the NWS claim
‘This storm ranks up there with the great blizzards of the past 100 years in terms of amount of snowfall, size of impacted areas and population affected,’
A very unhelpful, unscientific, statement that reveals the political hyperbole that drives the story. Not to be outdone NOAA report,
Last weekend’s historic blizzard has been revealed as the fourth most largest snowstorm ever to hit the Northeast, according to the National Oceanic and Atmospheric Administration.
It is nice to learn that NOAA has records covering the entire multi-billion-year history of the region as the word “ever” indicates. Maybe they could use these to put their claims about the record warm in 2015 in perspective.
The Blizzard is a classic example of how those with a political agenda took a normal, natural, event and turned it into a potential catastrophe. They gave their claims legitimacy with computer models. The compliant sensation-seeking media repeated and amplified the story until politicians were left with no choice but to overreact. In fact, this is a self-inflicted wound because the politicians lead people to expect the government to look after them.
The final fiasco is that disciples of the false story about human-caused global warming saw an opportunity to further their agenda. They ignore the fact that the models were wrong about the blizzard and make claims that are scientifically inaccurate. Of course, they will never give up as long as they ignore reality and their jobs and careers are dependent on maintaining the deception. The storm of 2016 shows how the deceptions are occurring at the local and global scale.
===============================
UPDATE:
The Washington Post reported that airport weather observers lost their snow-measuring device in the blizzard. National Oceanic and Atmospheric Administration spokeswoman Susan Buchanan would say only that “questions were raised about the reading.”
As a result, she said the National Weather Service would assemble an internal review team to assess how snow measurements are taken at Reagan National and other locations.
I think the statement “people who don’t know what they are talking about, or, worse, want to know” should read “people who don’t know what they are talking about, or, worse, don’t want to know.”
So true. Especially since the original phrasing can be read as “people who don’t know what they are talking about, or, worse, people who want to know” or “people who don’t know what they are talking about, or, worse, people who don’t know what they want to know.”
Thank you Dr. Tim Ball.
Your “broadside” smashes a hole in their great global warming (gravy train) nonsense.
Excellent article indeed.
Thanks, Dr. Bell. Good article, and thanks for mentioning Michael Crichton, his “State of Fear” (2004) was the book that got me interested in the climate deception. In 2006 Al Gore with his “An inconvenient Truth” really got me going.
Sorry, I meant to write “Dr. Ball”.
Dr. Ball you need to fix your reporting. The blizzard might have been overhyped but your completely wrong (not inaccurate, wrong) figures for the snowfall totals make you look like a raving lunatic.
I’ve been lurking here for a long time, and this is my first post, mainly because I believe the truth is much more important than anything else. Don’t drag this website down with this garbage.
Agreed, in the Philadelphia/NJ region the forecast was spot on, slightly underestimated NYC but as typical for such storms in this region the northern boundary can be quite sharp and a few miles variation can make a large difference.
I was expecting 20″+ and we got ~23″, I had to dig the most snow from my driveway in the 30 years I’ve lived here. The strong winds (also accurately predicted) caused some drifting, the bottom of the drive was 30″+ deep. We were lucky that the storm hit over the weekend allowing the snow clearance crews to do a great job in clearing the roads. Should the forecasts for this week be as accurate we’ll see the mid 60s on wednesday (not a record but 15ºF above average).
Regarding: “While Philadelphia, New York and New Jersey had braced for 30 to 60 centimetres of snow, they got far less than that. New York City received about 20 centimetres, Philadelphia a mere 2.5 centimetres or so. New Jersey got up to 20 centimetres.”
Actual snowfall totals:
NY City:
Central Park: 68 cm
LaGuardia Airport: 71 cm
JFK Airport: 77.5 cm
Philadelphia (PHL airport): 57 cm
Atlantic City NJ: 32 cm
Newark NJ: 71 cm
..I think it should be inches ??
Donald L. Klipstein commented:
“Actual snowfall totals:
NY City:
Central Park: 68 cm
LaGuardia Airport: 71 cm
JFK Airport: 77.5 cm
Philadelphia (PHL airport): 57 cm
Atlantic City NJ: 32 cm
Newark NJ: 71 cm”
For January 22 – 24, 2016 your numbers are WAY off, bogus, wrong. Where did you get these numbers?
I translated to the nearest .5 cm from the combined inch figures (by multiplying by 2.54) in the daily climate reports for 1/22 and 1/23 from the National Weather Service. Links:
http://www.weather.gov/climate/index.php?wfo=phi
http://www.weather.gov/climate/index.php?wfo=okx
Oops my bad on comment to Donald Klipstein…..your numbers are correct, I was the one that made the error.
Weekly wrap-up: Blizzard of 2016 ranks 4th among worst winter storms of past 100 years TO HIT THE NORTHEAST !!
https://www.ncdc.noaa.gov/snow-and-ice/rsi/nesis
So then it was pretty bad
Ummm NO , It’s called winter weather…!
This storm rating is based on several parameters which may or may not be relevant to a particular person or a particular place. This storm was rated bad because many large cities had very high total snowfalls, there was a lot of damage at the shore points due to flooding, some locations that rarely see heavy snow got a very large amount, and the storm persisted over a wide area for a longer than typical amount of time.
Not saying if it is or is not hyped up compared to historic storms on this list due to it being recent (Tony Heller has what I considered a very funny post this evening, pointing out the difference between global warming caused blizzards and global cooling caused blizzards.) and thus due to what is now called “climate change”. When warmistas say those words, it must be understood that they are referring to CAGW, using the obfuscatory language which they favor.
Dear Tim,
I keep banging on about the use of the term “climate change”.
They (the IPCC and the headline grabbing media) have hijacked this expression so much, that many people don’t even question it when they read it or say it.
I should be pleased if you would kindly consider using (in your next articles) the more correct term “climate(s)” or “climate systems” instead of climate change.
The CLIMATES about the earth do of course change every split second of time and so it makes no sense to repeat their misleading expression.
I do hope you agree and I know a few others (here on this thread) who would also appreciate this request.
Thank you for yet another splendid “broadside” of paragraphs which blow a bloody great big hole right through the nonsense.
Regards,
WL
Yay. I read this after making the comment in reply to Marcus just above.
I agree completely Warren.
I disagree completely. Climate is the system of weather parameters which have a known range of values. Only persistent occurrence of values”out of range” qualifies as climate change. The known range limits haven’t even been briefly visited for centuries.
Brian H,
There is no such thing as climate change.
Regarding nor’easters beginning in the lee of the Rocky Mountains and often being called Alberta clippers at that point: Most nor’easters don’t start as Alberta Clippers, but start somewhere farther south – usually in or southeast of Colorado. A few move into the southern or south-central Plains from California. Some form in the Gulf of Mexico, and a few begin in the southeast US or even offshore of the US east coast.
The Wikipedia article does not say that many nor’easters start as Alberta Clippers or Canadian clippers, although they mentioned one that did start as an Alberta Clipper.
Regarding: “Historically, because there was a much greater storm in 1888 that followed the same path as the storm of 2016. Global temperatures were lower at that time.”:
The Great Blizzard of 1888 did not follow the same path as the January 2016 one, but took a more northerly path. New York City received 21.0 inches from the Great Blizzard of 1888, and more than that in three more recent storms including the January 2016 one.
The Great Blizzard of 1888 had higher winds and probably a lower central pressure than the January 2016 one, but had less moisture to work with. There are places farther north where records set by the Great Blizzard of 1888 still stand, but it snowed for a longer period of time there because the storm stalled or nearly stalled.
I find it more interesting to measure snow by the can.
From Lisburn, PA.
Jonas finished the sixpack!
Dr. Ball: Readers may be confused because you mixed information about the recent 2016 nor’easter (dubbed Jonas by the media) and a potential nor’easter in January 2015 that didn’t produce much snow.
1) For the most part, snowfall from Jonas was at the upper end of the forecasts: 2-3 feet in the hardest hit areas. Philadelphia airport received 22″. La Guardia (NYC), 27″. Dulles (Washington DC area), 28″. Storm surge on the Jersey and Delaware coasts reached to 9 feet. (Peak surge was 13 feet during hurricane Sandy, but this Nor’easter impacted more coastline.) https://weather.com/storms/winter/news/winter-storm-jonas-latest-storm-reports-blizzard
2) Gary Szatkowski apologized for a storm in January 2015 (a year earlier) that didn’t develop into a nor’easter. Forecasting snow storms in the Mid-Atlantic is difficult because the amount of snow depends greatly on the track the low take as it moves up the coast. Storms moving northeast from the Gulf of Mexico traveling just off the coast mix moist air from the Atlantic with cold air from the north and produce large amount of snow over a band about 50 miles wide to the east of the path taken by the low. Those traveling over land or too far from the coast do not.
With Jonas, the “fear-casting” by the media warned citizens of a dangerous storm. The snowplows didn’t reach my neighborhood in Northern Virginia for 4 days. As for the Blizzard of 1888, it started as rain in Washington DC and had its greatest impact further north, in NYC and especially the interior of New England. See the snowfall map at 00:11 in this video.
http://www.accuweather.com/en/weather-video/video-weather-history-the-great-blizzard-of-1888/2220051069001
While the Blizzard of 1888 may have been the most powerful Nor’easter in history, it probably wasn’t the worst storm in the Mid-Atlantic (Philadelphia to Washington DC). And Jonas produced almost no snow in Central New England, where the Blizzard of 1888 dropped up to 4 feet. In my experience, we get nor’easters similar to Jonas about once a decade, which means that some of them produce record snowfall in some locations. In many cases, systematic local records extend only about a century into the past, so The Blizzard of 1888 isn’t in many record books. While some alarmists believe that it may be hotter now than at any time in the past one or two millennia, none of them claim to know much about record storms for more than an century.
You are correct in noting that none of these storms have anything to do with GHG-mediated climate change. And the weather-prediction programs that succeeded with Jonas and failed a year before have nothing to do with the AOGCMs that predict 3+ degC of warming from doubled CO2. The former have been validated comparing their forecasts with observations. Experience teaches that they are reasonably accurate several days in the future and lose all skill more than a 1 week in the future. We know that AOGCMs have no skill hindcasting and forecasting on a decadal time scale and they disagree about regional climate change. It will take a half-century or more to know whether any of today’s AOGCM has any skill at predicting future climate change.
Ah yes, that’s the major disconnect in the essay. This article at http://www.cbc.ca/news/snowstorm-forecasters-under-fire-as-historic-accumulation-failed-to-materialize-1.2933628 is dated last year, Jan 27, 2015.
The biggest challenge in the recent storm is that one of the models, the NAM, headed off on its own calling for a more northerly track and snow extent. Ultimately it verified pretty well. The snow depth gradient along the northern boundary was extremely steep and just a few miles travel brought people to extremely different conditions. The rest of the storm I believe was forecast quite well.
Excellent summary Frank.
And thank you Ric and Frank for pointing out that the article mixes up details of two separate storms a year apart without making this clear.
IIRC, the storm last year which was an epic fail did nonetheless hit points further north fairly hard, contributing to the record snows in Boston last year.
I think the storm last year had come on the heels of a string of more accurate forecasts, and due to this the cautious uncertainty that forecasters typically use in their storm calls was almost completely skipped, and the warnings went out is if confidence was very high. The Mayor of New York closed the city and cancelled train service over a day in advance, and thus many millions were greatly inconvenienced for what turned out to be no reason. But, again, further north the storm did hit, and so it was an error of placement most of all.
Having grown up in Philadelphia, I can vividly recall many times epic snows were predicted and nary a flake wound up falling, but in the dim distant past people were less likely to be snowed by an inaccurate forecast, being very skeptical until snow was actually falling. Philly is often on the rain snow line during winter storms, and the difference of a few tens of miles in the storm track is the difference between no precipitation, epic snow, or 33 degree heavy rain, which is by far the most unpleasant weather to have to endure outside.
I grew up down the road in Delaware. In the 50’s there was “Wally Keenan the weatherman”. (Channel 3, I think) Our rule of thumb: “not to worry” when he called for heavy snow and “watch out” when called for only a few inches. There was so often a sharp divide in precipitation in our area such that we referred to it as the “canal effect” (for the C&D canal). Snow north and rain south or vice versa. Fun days.
India receives severe cyclonic storms in pre-monsoon season, monsoon season and post-monsoon seasons, wherein temperature shows a decline from pre- to post-monsoon seasons. The cyclonic storms are basically depends upon the general circulation pattern that provide wind and temperature gradients at that time. The PR warmist groups made it a point, when a disaster affects Indian region, they were quick to issue a press statement and the media gives sensational hype. When we write to the Prime Minister of India on real causes and sent to media, they rarely publish them. In India, all most all important cities have PR groups of IPCC/Al Gore. Most of the PR groups have no basic knowledge of meteorology & oceanography.
Dr. S. Jeevananda Reddy
Regarding “produce large amount of snow over a band about 50 miles wide to the east of the path taken by the low”: Nor’easters producing heavy snow in the mid-atlantic and/or northeast coastal USA (and as far inland as the Appalachian foothills, even the Appalachian Trail from Massachusetts southward) tend to do so in a band west of the track taken by the low pressure center, at least the surface low pressure center. A surface low pressure track of a major snowstorm nor’easter in these areas usually has much of the precipitation being rain.
Tim says “It is nice to learn that NOAA has records covering the entire multi-billion-year history of the region as the word “ever” indicates.”
You are quoting a random web site not NOAA. But good job deceiving people…
Nothing warms the heart more than watching the powerful folk in wash dic experiencing real power from a little snowstorm … but be of good cheer … whether at the office pushing around piles of papers or stuck home for a week due to a couple feet of frozen water crystals, the rich and powerful get paid without fail … unlike real people that really have to work and produce.
Hey, I know many places get big snows on a regular basis, but two feet is not, I do not think, a “little snowstorm” much of anywhere.
Routine in lake effect snow belts and mountain passes perhaps, but even in these places they are not little.
In such places there are not large buildings with flat roofs, people all have snow tires and also chains in their trunk, and cities do not lack snow removal equipment.
There you go again with all those stereotypes … and yes, a couple feet is a little snowstorm, even here in Buffalo … it only causes a problem when the forecast is wrong and the plows are still in the garages when the snow starts or the snow keeps on coming and coming and is measured in yards+. But then we do what we’re always doing … we deal with it. And what fantasy world is it where all have snow tires and chains? Where? Maybe on emergency vehicles; otherwise, if it’s really bad, stay home an extra couple hours till the plows have done their work plowing and salting the streets until they’re clear … or mostly clear. And if you can’t wait, drive a bit slower. The only place I’ve ever been where snow tires came in handy were the rural areas of the Great Plains, where roads aren’t plowed .. or salted … ever.
And as for those poor paper pushers … they couldn’t even handle an inch of snow that came before the main event … how can anybody so embarrass themselves by not being able to handle an inch of snow??!! I keep my slippers on when there’s only an inch out when heading out to the mailbox.
Even in Buffalo?
What does that mean?
You must have a great boss if you can “just stay home an extra couple of hours if it is really bad”
No one can drive through two feet of snow. You said yourself it causes a problem if the plows cannot plow it.
So, which is it…two feet is nothing, or it is reason to be hours late for work until the ploughs catch up?
Here in Florida it is 90 degrees every day from May until October, and no one calls it a heat wave, like they do in places that do not see long stretches of 90 degree weather.
But if I was to say 90 degrees is not even hot, and no one worries about it unless their air conditioner breaks or the power goes out, that would be the rough equivalent of what you are trying to claim.
So you have rubber slippers that do not get cold and wet unless there is more than an inch of snow…so what?
Two feet of snow is two feet of snow. In places where plows can clear every road in a couple of hours…it is not a paralyzing disaster like in places where that cannot happen and the city closes down.
And tell me, do the airports in Buffalo just let the planes circle for a few extra hours while the plows clear out two feet of snow…or do the planes just take off and land in it because that is nothing up there?
“Two feet of snow on a roof can weigh 19 tons. Because of that, emergency rescue crews are dealing with numerous roof collapses across western New York following the second round of lake-effect snow, county officials said. VPC”
“Much of northern and western New York will be hit by heavy snow through Friday, with an additional 2 to 3 feet possible, AccuWeather meteorologist Alex Sosnowski said. ”
Just picking at article at random, we see two to three feet (same amount as fell from Jonas) described in new York near Buffalo as “heavy snow”.
http://www.usatoday.com/story/weather/2014/11/20/buffalo-lake-effect-snow/19315879/
Well it seems Dr. Ball confused storms in two different years, but had he been right, I see this kind of reporting as done in an echo chamber. I wonder if there is some way to hammer home to a broad audience the deceptions and hyperbole that DOES constantly assault us from the clime-syndicate fantasies that never get rectified. Isn’t there some kind of ‘crowd sourcing’ or some such way to broadcast obvious malfeasance. I guess only expensive ads in newspapers and TV. I’m sure the failing lefty press would be reluctant to turn down any revenue these days.
“You made a lot of tough decisions expecting us to get it right, and we didn’t. Once again, I’m sorry.”
Should that be “You made a lot of tough decisions expecting us to get it right, and we didn’t, once again. I’m Sorry.”?
Can anyone please tell me do the weather stations for NOAA use micro wave technology to measure temperature the same as the satellites and what doctors use nowadays to measure temps? I am having argument with someone who says the land thermometers are much more accurate than the satellites.I heard Will Happer say they all use the same tech. Thanks
Trev, you asked a huge question, but the short answer is “no”.
They are not the same.
Doctors have a few different sorts of touchless thermometers I think, and all are different from the sensors used in the new MMTS weather station recorders. Docs and laser thermometers use infrared lasers, MMTS use a sort of thermistor, which contain a device with a certain sort of metal in which electrical resistance varies depending on temperature, IIRC.
And both are different from what is used by satellites.
There is no shortage of articles and long conversations on this topic here at WUWT. Our host led a project to identify badly sited weather recording stations, which found many that were in spots that were guaranteed to give inaccurate results, usually way too hot.
Also in no short supply are opinions regarding which is the best way to record temperature data.
Most people who are what I refer to as global warming skeptics think the surface thermometer data is all but worthless, owing to many factors, not the least of which is the so-called Urban Heat Island affect (UHI), by which increasing urbanization tends to warm readings by dint of ever increasing amount of hard paved surfaces, more and more buildings, and air conditioners, and heat sources, and all manner of other things that tend to alter what was found in years past, and alter them in an increasingly significant amount.
Use the search box here using keywords.
No, you will have to wait for my longer answer to clear mods.
I don’t of what these “laser thermometers” are. I have a nice (Kintrex IRT0421) infrared thermometer. While it has a red laser, it’s used for aiming the thermometer, the IR secition has a fairly narrow field of view. Medical thermometers use the same infrared tech, but don’t have the laser, and I believe try to “see” an artery. The manual is unclear.
They aren’t used in weather stations, They work best when used on something significantly warmer than the thermometer’s “optics” (which is also radiating at infrared wavelengths)
The satellites are looking at microwave emissions from oxygen. Roy Spencer notes at http://www.drroyspencer.com/2010/01/how-the-uah-global-temperatures-are-produced/ :
As for ground level measurements, the MMTS used by observers is that thermistor based tech Menicholas described. That replaced reading liquid based thermometers. The automatic stations used at unmanned weather sites use something like that, but it has a warm bias, especially when failing, see http://wattsupwiththat.com/2008/01/10/inside-the-asos-ho83-tempdewpoint-sensor/ for more.
Trev,
Surface station thermometers are anywhere from ±1ºC to >5ºC out of tolerance:
http://www.surfacestations.org/Figure1_USHCN_Pie.jpg
Satellite measurements are the GOLD STANDARD. Land-based measurements don’t come close.
Is this graph for real?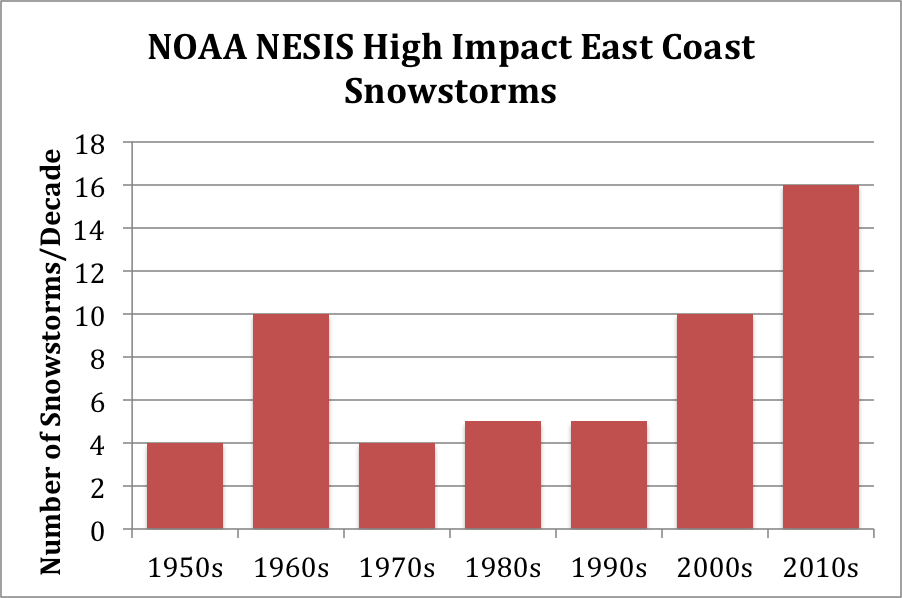 ?w=440
Keep in mind that NOAA is a political organization. And the current administration considers global warming to be the biggest threat to the country. And anyone who works for the government, who disagrees with this, and speaks out on their contrary view…is not likely to have a job for long.
Also, note that the phrase “high impact” does not appear to be a very scientific term.
People are much wimpier now, and get upset if their tootsies get chilly. But panic at the thought of being hot.
Apparently.
Menicholas,
It’s a government agency which is ideally supposed to be non-partisan. Just like the Supreme Court. Obviously there is always going to be some disconnect between ideals and reality.
And if Trump wins — which is altogether within the realm of possible outcomes — (C)AGW will surely be near the top of his list of things to deprioritize.
Similar allegations were made in the opposing direction during the GWB administration. Reality on such points is murky, something I think of as being a sort of design feature of politics no matter who is running the show. I obviously have a tendency to be less dubious of stories, narratives, rumors — what have you — which align best with my own partisan biases.
It flat out isn’t scientific in the sense that “scientific” in this context means to me precicely defined and observationally quantifiable within stated bounds of uncertainty. Such definitions do exist, but they’re not often reported in mass media — which is a problem.
No matter who is running the show or which direction media moguls and PR flacks are attempting to steer public attitudes and opinions, the physical reality of the planet is what it is. I hold myself personally responsible for attempting to discern that ground truth the best way I know how, which is to learn it from the ground up by way of general first principles, and work my way toward domain-specific findings in peer-reviewed primary literature.
My only other option is to believe whatever I want, which is not an acceptable practice in my personal case. My prior experiences strongly suggest that what I want to be real and what is real are often very different, and in a few notable cases that has had dire consequences for me and other people.
I b!tch about both, and am not panicked about either. I don’t think of myself as an outlier in that respect, but then again most people in my circles are more like-minded than not. And again, I tend to respect opinions more from people with like-minded opinions and behaviors than not. Neither of those tendencies is accidental; even when seeking sameness is not consciously deliberate, my subconscious biases are still hard at work.
I think this post should be redacted until the factual errors are corrected: e.g. connecting this storm to Alberta Clippers, apparent confusion of a 2015 and the 2016 storm, incorrect snow amounts.
An Alberta clipper (also known as a Canadian Clipper) is a fast moving low pressure area which generally affects the central provinces of Canada and parts of the Upper Midwest and Great Lakes regions of the United States, precipitating a sudden temperature drop and sharp winds.
This storm came out of the south and reformed off of the coast and had little or no effect on the area identified in the definition. That southern path is common in my experience for heavy snows that have hit the mid Atlantic. Alberta Clippers tend to bring cold but dump their snow in the Appalachians before they get to the DC area.
I like watching Bernie Rayno videos on Accuweather when a storm is coming. He doesn’t hype the storms or use stupid names for them.
Lack of “agreement”:
[Done. . mod]
Climate change hype was injected into this storm situation. If you can scare people enough they will be willing to do anything or pay anything to be saved.
The U.S has some of the most violent weather in the world. There are plenty of weather related events in the past 100 years to prove this.
Nothing wrong with warning the public and if it doesn’t happen or is not as bad then just be grateful.
I wonder where this quote came from:
“While Philadelphia, New York and New Jersey had braced for 30 to 60 centimetres of snow, they got far less than that. New York City received about 20 centimetres, Philadelphia a mere 2.5 centimetres or so. New Jersey got up to 20 centimeters.”
I live just outside of Philadelphia and we got a little over 20 inches of snow. That would add up to a mere 50 cm from my back of the envelope calculation. C’mon. Let’s get the facts right.
Tim quoted an article from over a year ago. It’s bizarre.
You aren’t paying attention. The URL (for the article from last year) is listed twice above.
So Ball takes a Slate article from this year’s storm. (One that dropped 33 inches of snow on one of my siblings’ house in NE New Jersey, and 27 inches on another in Brooklyn, and over 40 inches )
Then, under his aptly titled section “The Basis for the Hype” he links to a CBC.CA article from January 2015 – talking about a different storm where the weather forecasting wasn’t accurate like this one was.
Then he jumps back in time (and out of context) to a 2008 New Scientist story that talks about regional -climate- predictions, not -weather- predictions.
Then he mixes up Nor’easter and Alberta Clipper – two entirely different weather phenomena (they both have Wikipedia articles, and Nor’easters are not the ones that start near the Rockies).
All to claim a big storm wasn’t a big storm? Not sure what he’s trying to say here.
“Winter Storm Jonas: Fourth Strongest Nor’easter since 1950”
http://www.wunderground.com/blog/JeffMasters/comment.html?entrynum=3235
to complete one sentence: “over 40 inches of snow in West Virginia.” http://wvmetronews.com/2016/01/25/berkeley-county-community-heads-list-of-snowfall-totals/
This isn’t the first WUWT post to have a big mistake, it won’t be the last. WUWT policy has been to leave the post up, possibly with a disclaimer, instead of making it disappear like some lesser sites do. One my posts leaped to a bogus conclusion because I hadn’t consider there might be a time of observation issue. One frequent poster posted a few major errors but refused to acknowledge he might be wrong (he has his own blog now).
I’m a bit disappointed Dr. Ball hasn’t been by to comment, I’ll warn Anthony this post needs attention.
This post already has attention what more do you want?
The NWS has a duty to report that major storm conditions are developing. It’s impossible to predict exactly what will happen under these circumstances.
The wrong comes in blaming the cause on climate change.
..Accuweather…” Weekly wrap-up: Blizzard of 2016 ranks 4th among worst winter storms of past 100 years TO HIT THE NORTHEAST !! “
While ever their incomes and prestige depend on their false beliefs, they will hold true to those beliefs. Even if they know the truth in private, in public their grants depend on them.
Last weekend’s historic blizzard has been revealed as the fourth most largest snowstorm ever to hit the Northeast, according to the National Oceanic and Atmospheric Administration.
The National Oceanic and Atmospheric Administration seems to employ people who are as good at weather forecasting as they are at speaking or writing English as shown by the words most largest.
That was from a site called ‘Breaking 911’ not NOAA.
Perhaps missing a hyphen: …fourth-most largest storm…?
Just a charitable guess.