
I’ve been reading the comments about my press release at WUWT, Bishop Hill, and at Dr. Judith Curry’s place and most have been positive. There is the usual sniping, but these aren’t getting much traction as one would expect, mainly due to the fact that there’s really not much to snipe about other than Steve Mosher’s usual whining that he wants the data, and he wants it now.
Sorry Mosh, no can do until publication. After trusting people with our data prior to publication and being usurped, not once but twice, I’m just not going to make that mistake a third time.
Some of the sniping in comments has to do with defending existing methodology for using all of the data in the surface temperature record, with warts, bumps, abscesses, and all that and expecting to be able to apply blanket algorithms to fix all those widely varied problems. The insistence that methods can fix even the most sickly data reminds me of this kind of a cure-all:

Well to be fair, it isn’t THAT bad, they design their methods with good intent, but I have always puzzled why climate science prefers to try to “cure” the data, rather than just find data that hasn’t been affected by various ills and use it. That’s basically all we have done with our new study, and yet the tendency seems to be with some, that all they need is a better miracle data tonic.
This comment at Judith Curry’s place pretty well sums up my thinking:

Yep.
I certainly think you are right to withold your data until publication. I’ve been burnt in the same way in the past.
Unfortunately this research won;t be a tipping point but it certainly adds to the general view that the surface data is biased and unreliable.
Good and interesting work!
A tipping point is just the straw that broke the camel’s back. This study is just as likely as anything else to be a tipping point; you can’t really tell.
Having said the above, it isn’t likely that this study will be the tipping point. It is, for sure, one of the straws. {/pedant}
Indeed, though as Bob Notes, this may be just as likely to be a tipping point as anything else.
Well, it’ll certainly be a talking point!
The actual measured and recorded raw experimental data contains all the information about the reality, that you can ever have.
Subsequent prestidigitation for whatever purpose, can only create “artifacts” that might be interesting, but aren’t new information. They are fiction and the only meaning they might have is what the prestidigitator has elected them to mean.
Such things as running 13 monthly means or five year running means erase information that you already have and create an unreal result that only has a meaning that is arbitrarily chosen for it.
NO thing in the entire universe besides human beings is even aware of the result of doing a 13 month running mean filtration, let alone in any way affected by it.
If you carry the filtration of a finite data set to its ultimate conclusion, you end up with a single number which is most unlikely to even be a member of that data set; and it has no real physical meaning that the rest of the universe is going to pay any attention to.
It means what you have defined it to mean.
You don’t create NEW information by either interpolation or extrapolation of a limited finite data set; it’s just speculation about what you wish you had actually observed.
g
George, that is such an excellent post. I’ve never understood how you can take what is admittedly flawed or inaccurately flawed data, and run it through an algorithm and make it pure again. If the data is tainted, discard it and don’t use it. Anthony sought out data that was sound on its own merit and let it speak for itself.
Yup. Even averaging daily highs and lows is nonsense (a poor approximation of the heat content that assumes smooth changes with a normal distribution over a day/night cycle). The discipline just gets more absurd from there, beginning with that original sin.
Indeed. And there is no reason to interpolate or extrapolate either. A straight comparisons of the sampling points will tell you any answer more accurately IMHO. Compare like with like. Not like with spaghetti.
“but I have always puzzled why climate science prefers to try to “cure” the data, rather than just find data that hasn’t been affected by various ills and use it”
Because it’s the 21st century and technology can “fix” anything.
I think that is the nub of it too. The idea that a vast set of data cannot be properly mined for actual information because some of it is simply unfit for purpose is almost incomprehensible to the current generation in particular. The temperature record as a whole is not fit for purpose ( of determining a properly representative surface temperature and trend over time). All those thermometres were not put in place for that purpose, they were about the local temperature as a matter of recorded fact and it is fantasists with a dream who have confected the global temperature idea and even more so the anomaly. The increasing HI effect and the range of issues with the sea data record let alone the potential problems with kriging make the whole thing little more than junk science, IMO. Well done to anthony for exposing one facet of the junk content.
I suspect this really gets at the root of the problem, as far as the ‘science’ is concerned (not to say the political ideology): they have taken a concept (‘global temperature’) that has only tangential referents with facts on the ground, and reified it, so that it takes on a life of its own. As M Seward suggests, the result is an endlessly elaborated fantasy. Which, sad to say, makes it perfect fodder for a cult-like movement.
/Mr Lynn
Literally speaking, the temperature of the globe should be following a cooling trend over eons of time as the globe’s core slowly cools.
” some of it is simply unfit for purpose”
I agree with this, but also think it can be taken further. If you look at the methodology, what they are trying to do is to combine temperatures from all over the world into a single “temperature”. A variety of techniques are used to “correct bad data points”. Other techniques are used to “correct” for sample points that are far too far away. Even more techniques are used to “correct” for poor methodology, such as time of observation (TOBS) inconsistencies. And somehow all of these “corrections” always introduce a false warming artifact.
Rather than just whining about other people doing everything wrong (even if it does support then narrative they are trying to push), I have an alternative methodology to suggest:
1. Choose a small number of high quality sites, free from all the problems that need those suspect modifications. Note that no site data is allowed to be changed. If there are gaps in the data, use an analysis technique that doesn’t mind gaps (perhaps treat it as if it is two sites that cover a different time period).
2. For each site, map the temperature changes over the period of time available. This creates a profile for what is happening at each site. If a site doesn’t have the same profile as surrounding sites, it isn’t a problem – other sites are other sites and legitimately will have different profiles. As an example of this, Canberra spreads over three valleys and each has different weather on the same day. Likewise, if the profile doesn’t support your warming narrative, it isn’t a problem – the data is the data and you don’t modify it to suit your pet theory.
3. Finally, we have a series of profiles which each will show periods of warming, cooling and staying the same. If you represent each profile as a temperature relative to that profile’s starting temperature (note, not to any other profile, and certainly not to some “normal” or “desirable” temperature), you can safely combine temperature profiles and work out an overall warming or cooling trend.
Note that there are places where poor choices can happen, for instance how did you choose those sites. Are they really high quality? What do you do about the gaps, typically where there are few people living, or few people with an interest in recording the temperature? But this is a fundamentally better methodology than the one being used now.
noaaprogrammer December 18, 2015 at 4:10 pm
Literally speaking, the temperature of the globe should be following a cooling trend over eons of time as the globe’s core slowly cools.
Not that simple even though true. Once a crust formed heat flow was extremely reduced. The earth is a comparatively poor conductor and that fact leads to all kinds of interesting geology. For instance, typical granite is radioactive enough to melt itself in an environment where the heat released is not carried away quickly enough. The original theory that attempted to explain the growth of mountains relied on that fact. The real problem was that it simply could not deal with things like patterning in volcanic chemistry.
““but I have always puzzled why climate science prefers to try to “cure” the data,”
Unfortunately their attempts to “cure” the data create a sort of hybrid zombie/frankenstein.
Yes, they do that by design. If they used only good stations with very few problems, it would take away their excuse to make wholesale adjustments to the data. That’s the last thing they would want because their climate agenda is more important to them than doing good science.
NOAA did that. From 2005, the CRN will provide most excellent CONUS data. Give them credit. Those stations are so Class 1, so beautiful, I cannot survey one and remain unmoved.
But we can’t go back and change history. The double entendre also applies: NOAA can no longer control the past. Their halcyon days be over. That was then. This is now.)
However, we can now “suggest” a some badly needed adjustment. And I am talking more than only Microsite. There is a whole ‘nother can of worms in the offing.
Unfortunately their attempts to “cure” the data create a sort of hybrid zombie/frankenstein.
The analogy is apt in that they have created a monster that they honestly do not see as a monster, and are finding it hard to accept the attitude of the townsfolk.
Because the real data don’t support the AGW hypothesis so it has to be “homogenized”, corrected, modified, “tortured” until it does support the hypothesis thus making settled science. That and a blind faith in computers that after 40+ years in IT (yes I remember the 1401 and the 350 RAMAC) i do not have.
I wonder if such torturing of data would have occurred if the electronic digital computer had not been invented, and we were still dependent on slide rules and digital calculators.
The answer could be “yes” as a large number of people with calculators could be orchestrated to do the same job as our computers, but obviously at a much slower rate.
It took 40 years for this Hypothesis and Cholesterol consensus to be disproven https://www.google.ca/search?q=time+magazine+cover+on+cholesterol+1984&biw=1024&bih=514&tbm=isch&imgil=9U_egjUAgYCeTM%253A%253B6gZPpszv48eLiM%253Bhttp%25253A%25252F%25252Fblog.primalpastures.com%25252Funcategorized%25252Ftime-magazine-says-eat-butter%25252F&source=iu&pf=m&fir=9U_egjUAgYCeTM%253A%252C6gZPpszv48eLiM%252C_&usg=__4IZzQ67fxM_LIyCr0raEhCrhS3Q%3D&ved=0ahUKEwis26T42ufJAhVLJiYKHTbNAbwQyjcIOA&ei=vjB1VqyEKMvMmAG2mofgCw#imgrc=9U_egjUAgYCeTM%3A&usg=__4IZzQ67fxM_LIyCr0raEhCrhS3Q%3D
Good post Anthony! I work in a different field (exercise science), but people always seem to want to say “tune your data” to what you expect your results to be, because that’s the only way they may be able to get it published. As the original data did not support their results. Some things are good to apply to data because of a little thing called ‘noise’, and those a perfectly acceptable under certain conditions. Typically, these are a filter (AR, MA, ARMA, low pass, Weiner, nonlinear). Sometimes it is good to look at what the data will give you with the data as is (no treatment), and then go back and look at it after you do a filter or whatever treatment you apply to the data. Last thing we want in science is a bunch of people running around reporting manipulated/mishandled data (although it surely happens), and publishing those “results”.
I suspect the following happens: The authors of a paper throw a bunch of different analysis tools at the data, select the one that seems to give interesting results and report that. They’re applying the principle that, “If you torture the data long enough, it will confess.” Ronald Coase
throw a bunch of different analysis tools at the data, select the one that seems to give interesting results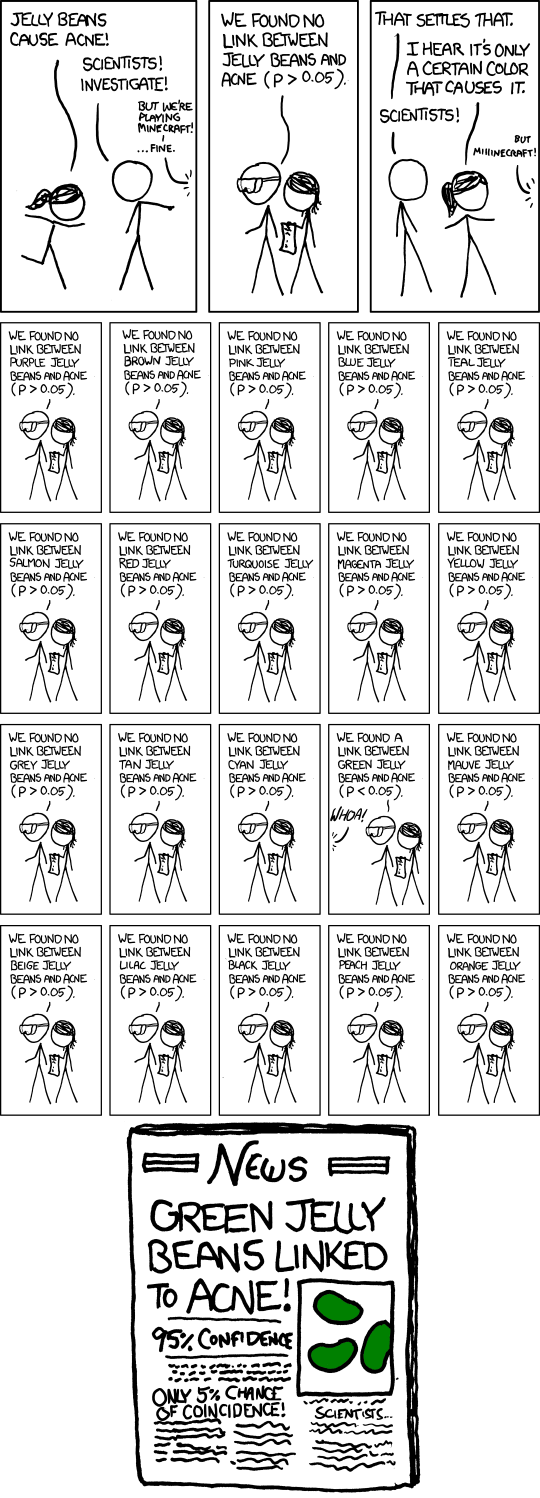
===========
methods shopping. the 95% confidence level is meaningless in this case, because statistics assumes the test is independent of the result. what is important is all the tests that were done that showed no result.
unfortunately, all too many papers report the results of only a single test, the one that shows significance, and fail to mention the tests that said there was no significance.
Anthony, you are right to not trust the Muller/Mosher duo with your data before publishing.
Muller got himself in trouble with the Physics/APS establishment with his hockey stick critique video and he has been trying to dig himself out of the hole ever since. Mosher is just his hired gun attack dog, and not a very good one at that.
“Mosher is just his hired gun attack dog, and not a very good one at that.”
Down here, we would refer to him as one of the “The Dodgy Bros.”..
…add Zeke H and you have them nailed.
Enjoy. Mosh is in blue.
I work in the seismic industry. We have more sources of noise, contamination, etc. than you can imagine, and more way of coaxing a signal out of that noisy mess than I even want to talk about.
The bottom line is, no matter how many magical high tech cures we apply to the data, when we compare the results to known reality, the best results come from the cleanest input data, which required the least amount of “correcting”.
Great work. It may not give the answer people wanted, but it will give the best answer.
This certainly applies to many if not all kinds of analogue signal-processing. I am working as an audio engineer specializing in the transfer of preservation of early phonograph recordings, and I can assure you that despite the very sophisticated software developed to correct audio problems (distortion, noise…) the old wisdom “G.I.G.O.” still holds true. Whenever there is a choice, it pays to track down the cleanest source available, as the result will always be better than any type of corrective legerdemain thrown at a poor source.
I found the same with the restoration of old photographs.
You can’t put back what is not there.
“Real” noise on what purports to be a signal, is generally attacked by trying to confine the signal bandwidth to just that in which the signal is expected (by some means) to exist, and in that process you remove noise energy that is out of that band or those bands as the case may be. So the idea is to carve away as much noise energy as possible while saving as much signal energy as possible.
For time varying signals you can do wonders if the real signal is known to be discontinuous, so that it is only present at certain times. Then if you only “listen” at those times you minimize the amount of noise power that you are integrating.
Navigation system signals such as Loran-C (or D) or the GPS satellite signals, are transmitted at precise times, with silence in between. Clever search methods allow you to eventually locate the times that you are actually receiving those signals, and that is where you look, and then you go to sleep till the next expected transmission.
This enables recovery of signals that may be buried deep in oodles of analog noise.
Having gone through the process of designing a Loran-C receiving system, I have a lot of respect for the scientists and engineers who devise these schemes for doing seemingly impossible signal extraction.
BUT !! they have an ace up their sleeve. They KNOW for sure, that there is a signal to look for.
The trouble with so-called climate science, is that there is NO assurance whatsoever, that there are even signals to look for, that can announce climate change is coming (for some reason.
I suspect that the vast majority of climate science funds are wasted looking for signals where none exist. They are work fare programs for otherwise unemployable would be scientists.
G
If you are measuring temperature, there is a signal.
I am always amazed at how similar the “science” of cAGW is to the “science” of Bigfoot and alien UFO believers.
and dont forget the rotary lie detector that puts all models to the cold steel.
… I have always puzzled why climate science prefers to try to “cure” the data, rather than just find data that hasn’t been affected by various ills and use it. …
My theory, its much easier to work 9-5 if you spend your time in a comfy air conditioned office playing games with statistics, rather than tramping out to every remote temperature site to assess the quality of the data it produces. But maybe I’m just being cynical…
It’s almost like researchers can’t hire people with their research grants.
Almost.
It’s not like they can’t hire … it’s that they won’t hire, it cuts into the profits. It isn’t research for research sakes for crying out loud, it is research for dollars. And if I can get dollars for crap research why put in more effort than necessary.
… you are probably correct. Also, if you confine yourself to good data that need no major correction, than you simply don’t have the scope to create the trends that you want to see.
The belief in the curative powers of statistical “correction” algorithms is a hallmark of scientific naivety.
interesting Eric, that is the one sentence that stuck out for me too.
It should be remembered that curing is an alternative to cooking.
Eric
My suggested new word that describing such 9-5 people
“Empixellated” – spend too much time looking at computer screens and not nearly enough looking at the real world
Eric – “cure” the data”. So old school. That’s what computers are for. Make a model and claim it is now data. Lots less work too.
I am amazed just how many papers we’ve seen pass through WUWT that do claim computer simulations are data. They make a mockery of themselves and their work by doing so.
“But maybe I’m just being cynical…”
Good enough for government work is a well-founded truth.
Anthony, I think the rest of the world can be done!! It’s always argued that the US is only 3% of the surface area. You have greatly expanded the breadth and depth of your reach at WUWT and have a much higher profile than when you did during the orignal US one. You could announce it and 200 countries would know about it in an hour. And the people you reach will be just the kind of people you want to reach. Certainly Canada, Australia and Europe could be added quickly and probably much of Asia as well. JoNova, Paul Homewood, Tim Ball come to mind immediately.
I think it likely that the difference for the rest of the world will be more than 59% from trends with good siting. I suspect there may be a fair number of newer stations in Latin America and elsewhere over the past 25 yrs because of the desire to get in on the global warming action. Perhaps it is just as well to stick to the 30 years duration to get the most data. Ultimately I believe the corrections will come close to jibing with the satellite measurements over land at least and will go a long way for mutual corroboration of the data sets. Also it would go a long way to putting in place more modern thermometers around the world (maybe you could get some of the business although that would bring a global caterwauling that could be heard by standing at your open window – better stay away from that.
You have had a big response, congratulations. I think it is going to even give Lamar’s investigation another adrenalin shot. It’s also past time to rescue the chickens from Col. Sanders tender care. I see authorative data sets of all kinds in the hands of independent researchers. The Global Surfacestations Project has a nice sound. Maybe an independent World Meteorological Organization is in the cards. Hey it’s been done with the NIPCC? I say go for it!!
I have always thought this, and I have suggested that it would make an interesting field study for those taking a university degree in Earth sciences. A review of their local weather station9s), it siting, its equipment, equipment changes, maintenance (including screen maintenance), and calibration checks, length of record, approach to record keeping, TOBS, change in TOBs etc. Get some good photos and the data etc
Why don’t undergraduate students do a thorough audit of the local weather stations? Most European countries would be quickly audited. May be more difficult in Australia, but then again there are not so many weather stations.
I’m pretty certain that Mosher has shown enough professional integrity that you can probably trust him with it. Have him sign an NDA and bring him on board. An honest critic is worth a thousand yes-men any day of the week.
Mosher needs to learn a little patience. His one liner non-sequiturs don’t suggest a lot of thoughtfulness to me.
Seems to me Mosher leaves condescending and cryptic messages and cannot be trusted. I also don’t trust any PPE and English graduates or Enlgish literature PhD’s. Science rules, OL!
I get the impression from replies that he has left that one-liners are the best he can usually manage, considering that he is apparently texting while driving.
Scott, I agree with your comment about an honest critic. After all, that’s how science is supposed to work but it doesn’t. The corrupted peer review process is exhibit A. Second, it is good to write down our agreements but it is not good to sign one with anybody we wouldn’t trust on a handshake. Our host has a good reason to be cautious.
That isto misjudge mosher and his motives and the friends he keeps. There is no need to release data yet and climate science is notoriously bad at doing with mosher tacit support
You are “pretty certain” that you can “probably trust” Mosher with it? Wow. Even glowing endorsements don’t constitute evidence for trust, much less whatever this is….
If he wants the data, isn’t it available to anyone? Anthony didn’t build his own weather stations, he just analyzed the data from the ones already there. Anybody could reproduce that study; they don’t need Anthony’s data.
Mosher’s stance is essentially “give me data. I’ll sign an NDA and if I break it, you can sue me”. Anthony’s is pretty clearly that he doesn’t trust Mosher or anyone involved in BEST, and thinks that he has good grounds for that after the way the BEST crowd treated him.
From reading the way that Mosher (over at Judith Curry’s) conflates Anthony not releasing data BEFORE publication with Jones etc not releasing data AFTER publication, I’d agree with Anthony on this. (Mosher: “But thanks for arguing that scientists Dont have to share data with people they dont trust…. wait… Jones didnt McIntyre or Willis or me.. You’ve set a fine standard for science.”)
Trust the english major!? If he had any integrity he wouldn’t espouse the [trimmed] that he does.
Mark,
I wouldn’t go that far regarding Mosher’s motives, but he does have a horse in this race, as his work is based on temperature adjustments.
In any case, Anthony’s “code” has to be less complex, (less prone to malfeasance) as it is based on raw data vis-à-vis adjustments. I suppose, opposing parties will try and take issue with the station selection criteria.
Mosher can do this work independently and check wuwt work as it should be done. You know, science. Someone issues a paper you verify yourself, when you cant you ask for their data. After mosher mates at BEST shat on ant and team i wouldn’t give them the dripings of my nose
That’s the attitude the Hockey Team have taken with McIntyre. Mosher just needs to wait until publication. It’s not that hard.
Anthony: What’s your opinion on what I said that started that sub-portion of the thread?
—
The problem of people using straight line ‘trends’ of any climate series is that I want to utter the rather dry observation
“The data capture widow available does not support the bandwidth required to get to that frequency”
I’m not a scientist yet can see if the near future that all these global castastrologist will be exposed. They best start doing real science and quickly.
No, no. They will just push the deadline for catastrophe to a later date. Or, as they have done in the past, just ignore it. Since the media, where most people get their information from, has the attention span of an ADD gnat, it will have been forgotten long before the catastrophe doesn’t happen once again.
They’ve already changed the target. Water vapor is now the greatest danger facing mankind. Expect new laws regarding agricultural irrigation and other water-vapor industries. Those clouds of steam that have always been used to (falsely) demonstrate industrial pollutants released to the atmosphere? They’re going to find new life in the next big CAGW scare package.
Mark
Try
http://www.zerohedge.com/news/2015-12-16/ecological-panic-new-rationale-globalist-cultism
I suspect the word you want is “catastrologist” for the predictions of disaster abounding in their Zodiac.
At some point Naomi Oreskes will announce that the global campaign to eliminate CO2 increase has been a success and that is why temperatures have not risen in the nnn years since 1998/2005/2011 etc. Green success – they saved the planet in spite of all of us.
My personal belief is that CO2 emissions increasing is the only thing stopping the world from sliding off into another ice-age.
IMO the book cookers do it with evil intent. They should be hauled on fraud charges or worse.
As Shakespeare wrote:
“Fillet of a fenny snake,
In the cauldron boil and bake;
Eye of newt and toe of frog,
Wool of bat and tongue of dog,
Adder’s fork and blindworm’s sting,
Lizard’s leg and howlet’s wing.
For charm of powerful trouble,
Like a hell-broth boil and bubble.
Double,double toil and trouble;
Fire burn and couldron bubble.”
There are definitely some weird sisters boiling the climate “data”. Unfortunately more than three.
RICO, anyone?
Maybe Josh Willis would like to “dig into” that data.
He could then potentially locate stations that show “bad data” a.k.a. “they were too cool ” and “toss” those stations out.
And then using his own words: “so that when I tossed them, most of the cooling went away. But there was still a little bit, so I kept digging and digging.”
If anyone needs to locate spurious non-warming and have it tossed by the master tosser, then surely he’s the man. Having said all that Karl can also cool the past and warm the present, oddly by paying scant attention to the pre-tossed argo results from Willis.
Between the two of them they can revamp the entire global network.
And that, folks, is called “science”?!! (sarc)
+100
That is what they did to ARGO when it was first rolled out.
It initially showed cooling. Wrong result. rather than checking whether there was a real problem, they simply deleted the buoys that showed the greatest trend in cooling.
An impartial scientist would have selected a random sample from the buoys that showed the greatest trend in cooling, and a random sample from those showing the greatest trend in warming and then returned those buoys to the laboratory for equipment and calibration testing. This was never done.
At no stage was there any independent verification that some buoys had faulty equipment leading to erroneous cooling trend.
There was simply just prior bias (the globe is warming to the oceans must be, there is sea level rise so the ocean must be warming) that led the team to simply expunge the buoys which showed the greatest cooling trend from the record.
That is climate science for you. If you do not like the data, make sure that you adjust it/manipulate it until you do like it.
Crazy world we live in.
RV,
Is there a link you can share on this topic of throwing out buoys they didn’t like?
Thanks.
@ Boulder Sceptic
Here: https://tallbloke.wordpress.com/2012/02/27/argo-the-mystery-of-global-warmings-missing-heat/
and here the original: http://earthobservatory.nasa.gov/Features/OceanCooling/
Furthermore:
http://www.jamstec.go.jp/ARGO/argo_web/results/data_management/management/correcting_method_1/Correcting.pdf
http://andrewgelman.com/2010/03/29/no_problem_well/
http://wattsupwiththat.com/2014/03/02/argo-temperature-and-ohc/
Do we have confidence that the raw data has not been corrupted?
Do we have confidence that your brain functions have not been compromised ???
Marcus,
His point is valid. Comparison of private temperature data with NOAA from nearby stations shows a disturbing trend for bureaucrats to put their thumbs on the scale.
What amount of coverage did SurfaceStations achieve, and are you still accepting entries to fill in the gaps? Next week I might be by one of the stations that was not classified last I checked.
Anthony, re Steven Mosher’s irritability, I know he’s a nice smart guy and all and has good friends among us. I hope he’s not succumbing to the Climate Science Blues which seemed to be reaching epidemic proportions although the press has gone quiet on this and individuals are not coming much to the fore lately. The tomkarleizing of the dreaded “Pause” I believe to have been motivated by the “Pause” and the terrible stress it was creating for the heavily invested, especially since we passed the “acceptable 17yr duration” that was the first salvo against the pause. It was followed by ~60 reasons (at last count) for the pause that the collected angst of warming climate persons came up with in about a week, and a world hunt in dark places for the missing heat. The Synod realized the Pause, well fun, had to go. They couldn’t lose the battle by having all their own locked up in asylums.
Despite the deflecting diagnoses of the “Blues” that victims were suffering (Gee we see the planet headed into a firey end and no one will listen! Heck, they had the world’s press, institutions, governments, a billion useful fools, etc’s ears), the “Pause” is the real cause and, egregiously, psychologists are enabling this to the detriment of their patients. It isn’t easy to except that you’ve wasted the large part of your career looking for phlogiston. Your mind makes this connection and the patient won’t accept it – classic D-Nile and it makes you sick!! I haven’t seen any papers lately on the plight of the butterflies and toads. What a wonderful instrument the mind. It want’s to be truthful and it won’t be shunted aside- a remarkable issue so far not engaged by either psychologists or philosophers who have, of course, drowned in a sea of semantics instead of thinking about the big things anymore.
Now Steven is at least a lukewarmer, but his head may already be resisting acceptance of a lesser position. I hope and I would prefer the afflicted to embrace the message their faithful servant behind their eyes is trying to give them and come out of all this in good health and help with the reparations that must be done. They at least would appear to have more conscience than the hard core cultists.
Gary Pearce,
Good comment, I agree completely. Steven is a very nice, personable and likeable guy (that’s why I always go easy on him ☺). He’s also very intelligent. I’ll never forget that he was the one who outed Peter Gleick as the Heartland forger/thief, based not on physical evidence, but on deductions.
I think what causes such consternation in Mosher and many others who firmly believed that human CO2 emissions were a problem, is the fact that many years of real world evidence have shown that not only is CO2 harmless, but more is better. The biosphere is clearly greening as a result of the added CO2, and to this day no one has been able to show any global damage or harm from ACO2. Thus, more CO2 is most likely “harmless”.
That’s not easy to take for anyone, when they’ve drawn a line in the sand, and after they’ve explained to everyone who would listen that ‘dumping pollution like CO2 into the atmosphere is bound to cause big problems’ (paraphrasing, of course). As Leo Tolstoy wrote:
I know that most men, including those at ease with problems of the greatest complexity, can seldom accept even the simplest and most obvious truth, if it be such as would oblige them to admit the falsity of conclusions which they have delighted in explaining to colleagues, which they have proudly taught to others, and which they have woven, thread by thread, into the fabric of their lives.
That affects almost all of the supporters of the ‘dangerous AGW’ side of the debate. It’s really just human nature, which Feynman warned us to be on the lookout against (“You are the easiest person to fool”.) For many years sincere folks who became alarmed at the rise in CO2 have taught others what they truly believed themselves. When we teach others what we sincerely believe to be the truth, it becomes even more ingrained. No doubt the instructors in epicycles were absolutely certain they were correct too, especially since that theory produced results that could be accurately predicted. Then along came Kepler.
(This does not excuse the self-serving scientists who are cashing in on the ‘climate change’ scare. Many of them know better, as they admitted in the Climategate emails. That makes them no more than self-aggrandizing rent-seeking charlatans.)
But for sincere scientists concerned about the atmospheric environment, they are observing with the rest of us that gradually, month after month, year after year, the real world is demonstrating that the additional CO2 is a net benefit, and that it simply is not causing the predicted global warming (or the concomitant ‘Arctic ice loss’ that is the last gasp of many alarmists).
I think Steven will come around, for the simple reason that he’s a smart guy, and only stupid or deceptive people argue against what the planet has clearly been demonstrating to us for many years now: the ‘dangerous man-made global warming’ scare is a false alarm. What is more, we didn’t just dodge a bullet; the added CO2 has been very beneficial, with no downside.
As usual, a good observation.
This is how real science is done. Admit you were wrong, vow to find out what is really going on. The alarmists could be touting this as the means for carbon sequestering (not that I think we need it to ‘save the planet’)
Problem is it would actually have positive results and have nothing to do with fossil fuels or getting rid of the liberal guilt of living in a modern society.
https://embed-ssl.ted.com/talks/allan_savory_how_to_green_the_world_s_deserts_and_reverse_climate_change.html
Hot Air,
Thanks for the link. I listened to it, but there was no video so I couldn’t follow his maps.
What I came away with was this: this guy was personally responsible for the killing of tens of thousands of elephants — based on his mistaken conjecture.
He admits he was wrong, and he understands now that he was wrong. But those elephants are dead because of his certain belief.
See the analogy? The climate alarmist contingent is just as certain they’re right, despite no global warming to support their belief. But they say we must essentially destroy Western technological civilization because they’re so certain they are right.
They are no different from this guy, who is directly responsible for the wanton killing of thousands of elephants to “stop desertification”. But now he admits he doesn’t even understand desertification! He is simply an old, self-righteous fool, and it is clear that his mea culpa is due mostly the numerous well-deserved attacks he’s received. But the elephants are just as dead because of him and his misguided beliefs.
The climate scaremongers sounding the ‘carbon’ alarm are exactly like this guy, with one exception: if they get their way, they will cause a thousand times more damage.
There’s a real lesson here: just because some group believes they’re right means nothing. And since the consequences of their being wrong are so immense, then we had best look long and hard at both their conjecture (which so far has turned out to be flat wrong), and their “solutions”, which will make the murder of thousands of elephants seem like a minor blip by comparison.
So thanks for the link. Maybe someone who is so certain about man-made “climate change” will look at the results of what being so certain can mean, and reconsider their belief system.
I think the “line in the sand” has to do with the “big lie” theory. In the face of all and any contradictory evidence you simply double down on your position even to the point of looking ridiculous.
Obama just vetoed bills that would put limits on the draconian anti-fossil fuel regulations of the EPA. Obama’s rational was that climate change was “a profound threat” and caused “premature deaths and childhood asthma.” I don’t know how much more ridiculous Obama could sound, maybe by claiming climate change is increasing erectile dysfunction in men and severe menstrual cramps in women.
” miracle data tonic” … LOL… I could’ve used some of that!
http://www.surfacestations.org still seems to be “flat on it’s can”. Sorry about all the glamore of doing a “peer reviewed paper”. The pictures and info on SS.ORG were DYNAMITE to demonstrate to people who they are being “bally-hooed”.
I remember back to my years in grad school talking with emotionally crushed fellow grad students in other labs about having just been scooped by a competitor lab at another university in the same research area. They almost always had presented most of their pre-published early data at conference talks and poster sessions some 12 months earlier.
Anthony, the work of your group is right on track with what I would like to see. Select the best sites with the least microscale influences, then document and fix or remove any problems in the data. Consequently, no further adjustments should ever needed.
I greatly dislike the perpetual “homogenization” of all of the data. Every month the past data changes, which is nonsense. Once past data has been run through a data quality process, it should remain unchanged. The past data should not be changing with every new month and year.
Rutherglen is one such ‘CRN1’ station in OZ. Quite the kerfuffle, that was.
Great quote!
Sadly, the goal isn’t better data, methodologies, results, or even better science.
The goal is to keep the gravy train on the rails!
I’ve asked Steven Mosher (at least 10 times now) for a simple timeseries of the breakpoints used by BEST in its temperature series.
How many down breakpoints are removed from the record versus how many up breakpoints and how these have varied over time.
[On average, BEST identifies 8 breakpoints for each station used and effectively removes the change identified in that breakpoint from the whole record. [Reykavik temps decline by 0.3C in 1947, algorithm flags a breakpoint and all the data before 1947 is adjusted down by 0.3C to remove the breakpoint – yes that is what they do.]
A breakpoint distributional analysis is a very important issue which should have been a key component of their original paper and any follow-ups done and it should not have been published without it. Yet, none has ever been shown.
It should be 50:50 in up breakpoints versus down breakpoints and these should not have a trend through time. If it is 30 up versus 70 down breakpoints in the 15,000 breakpoints they adjust for, then we know BEST is not the best, but it is more just a sc a m.
How about releasing just the list of stations that you think don’t need any adjustments, independent checking may find a few that do, giving a better product. Others will want to check the consistency of the temperature variations of these stations, maybe the sooner this independent checking starts the better.
I’m getting a warning banner that this web site is unsafe. FYI
I’ve gotten it too, a couple times today.
Use PeerBlock
what is your browser and anti virus you are running?
I got that also. There was a link to use to react, so I reacted by saying that this site was not unsafe. I got a reply very quickly, saying that my input would be considered, but it could take a few days. I actually got back on the site an hour later, and there was no “unsafe” notice, nor has it appeared since.
It is most commonly caused by adverts in the rotation that trigger the alert. It is a very subjective matter to declare what is suitable for the general public. Those alerts are the evidence that other people are doing your thinking.
The saying is “Once bitten twice shy” You got bitten twice so I don’t blame you for being wary and keeping your cards close to your chest.
Keep the data till you publish I say.
James Bull
Judith Curry’s venue is a reasonable source of independent verification, one needs all the reasonable sources of independent verification available.
John
Stop the fricking bus. Anthony paid for his results – it isn’t the result of a government grant money. Anthony’s paper was self-funded, too. Everything about Anthony’s paper is sole-ownership. Nobody, especially climate whiner Mosher is entitled to anything. Anthony, and his self-funded whim will do what best serves Anthony regarding the source data, analyses, and summary. Welcome to self-funded private ownership – I hope he paywalls it. Contrast that with government-funded alarmists who use our money to MSU for the purpose of driving agenda policy and then withhold their data because they think we just want to find something wrong with it.
Right On !!!!!!!
Yep. John Galt vs. Saul Alinsky. “Get off my lawn” has more legitimacy than some people realize.
“The insistence that methods can fix even the most sickly data reminds me of this kind of a cure-all:”
Was there supposed to be a graphic or something after that colon? Not showing up here. /Mr Lynn
Trusting Mosher is liking going to McDonalds because someone told you all their food is low fat, organic & gluten free.
Look here, Watts old horse, you’ve made a cardinal mistake when you say that the true temperature rise trend is only two-thirds the reported one. One should base %ages on the true reading, not the false. Therefore you should have said that the false trends are 150% of the true.
Apart from that, warm congratulations: you’ve done mankind a notable service. You and Steve McIntyre are heroes.
The cleanest data is the AMSU satellite series, which has also been validated by balloon measurements. Unfortunately that doesn’t fit the meme so has been ignored.
They won’t be able to ignore all the snow though, unless they can adjust upwards the melting point of water.
Nope. UK Met has officially declared that all the cold and snow is caused by global warming.
Never thought of that.
Maybe I’ll give it a shot and see what I can come up with. What if I shifted it from 32 deg. F up to 40 deg. F, so it’s a nice decimal number instead of a nice binary number.
That would just about fix all the projected CO2 mayhem for the next 200 years.
I’ll try and shift that 104 deg. angle between the two Os, and see if that changes the melting point. Maybe 100 degrees is where it should be.
g
Dammit, the giants here keep getting taller and taller. Standing on their shoulders the poet in me feels like he is on an elevator.
Eugene WR Gallun
Let’s be realistic: better methodologies wouldn’t give them the desired result.
“Some of the sniping in comments has to do with defending existing methodology for using all of the data in the surface temperature record”
Apparently even the measurements that weren’t actually measured are really important.
They should just rename GISS to GIGO and be done with it.
Izzat the Godawful Installation for shitty stuff ??
I think CaptDallas would be flattered to be mentioned on your blog. And it is a statement worthy of quoting.
captdallas2 .8 +/- .3 is an awesome commenter. I scan through at Judy’s, and I always stop to read what he has to say. He hasn’t been that involved lately, but has a long and distinguished history. Guy knows his stuff.
I suppose what I am trying to say is that you can’t tell the future and do not know the past, beyond the timespan of the record.
Nyquist tells us not only that bad things start to happen as your sampling approaches close to that of the underlying signal.
He also tells us that the lower frequency floor is bounded by a single sine wave over the timespan of the series.
Once beyond that point the ‘quality of detection’ of the observed data falls off rapidly, especially in the presence of noise.
To draw a straight line of any noisy time series graph, then you are implying an infinite frequency band which exceeds his observations.
The science does not support that.
It is propaganda and hope, not science, to draw a straight ‘trend’ line IMHO.
Well there is one problem with temperature series and CO2 measurements that some folks haven’t ever thought about.
Sometimes the CO2 goes up (mostly does) but at the same time, the Temperature might also be going up or sometimes it goes down instead.
Now I gotta tell you; there is NO situation wherein a number goes up but its logarithm goes down. The number and its log can never go in opposite direction.
Ergo there is no possibility that Temperature could be the logarithm of CO2 abundance.
Just can’t happen.
g
The Climate system consists of two paths that energy entering the system has a way of eventually leaving it.
One.
The short, fast, local, vertical path to space. This method reacts in Minutes.
It is interesting to note that we are often closer vertically to space than we are to the nearest human habitation horizontally.
Easy thing for mind/eye to ‘forget’ if things get presented (squashed) to make them ‘fit’ the page.
That path has been laboratory demonstrated to be a potential problem concerning CO2’s effects on Climate.
Two.
The long, slow, global, horizontal path to the poles and thence to space. This method reacts in Years to Centuries and beyond.
There appears to be no direct CO2 mechanism that can effect this horizontal movement. The ‘glass’ is thinner at the poles and the vertical distance to travel shorter there as well when it gets there. Any CO2 effects are correspondingly reduced. These are the last tailings of energy though. Some have been ‘stored’ in water, ice or Biology for a while and then released later elsewhere. The rest have been ‘’lost’ vertically on the way here.
Sure this may be a greenhouse, but it is a greenhouse without side walls and it is continuously shuttling from side to side centred over some spot on the ground. The panes of ‘glass’ above your head may not be fitted together well also.
The thickness of the ‘glass’ overhead may or may not be changing, but that does not mean that the temperature of the space underneath will rise indefinitely, or indeed statistically measurably change at all except, just maybe, in the VERY long term.
It’s like a rock being placed into a stream on the edge of a waterfall. Big rock, small stream, large effect. Same rock, large stream (same depth), hardly any or no difference at all.
How wide is the Climate ‘stream’? How big is the CO2 ‘rock’?
Question – how much work would it be to extend the data comparison out to 2015?
I understand the reasons stated by Anth_ny for ending in 2008. Makes perfect sense.
But at end of day, everyone will want to see the data going forward to current.
It wouldn’t change the paper results a whole lot if it focused on the data ending in 2008, but perhaps as an additional piece, showing it extended out to 2015 as well.
I agree. I think the data should be extended to 2015 just for reference from these 410 station subsets. Does it agree with the 18 yrs 9 months of global non-warming? (even though it’s just for the CONUS)..
Extending the series would be entirely counterproductive, and would be poor methodology, as well, for the purposes of testing the hypothesis.
for the purposes of testing the hypothesis.
There’s nothing stopping you from doing exactly what is needed to test the hypothesis and then as an extra exercise, extending the series to 2015
True, yes, but there are other problems. The unperturbed 410 station set (92 well sited) will be smaller, potentially much smaller, if extended to 2014. We do cite the CRN-COOP comparison during that interval and find no diversion. During those relatively trendless times, there is no diversion, which fact supports our hypothesis.
We may go there in more detail in future, but I have to take this one step at a time, lest we go off the rails. We must tread carefully and meticulously.
The unperturbed 410 station set (92 well sited) will be smaller, potentially much smaller, if extended to 2014.
Ah. I hadn’t considered that. The longer the time period, the less unperturbed stations there are within the time period. Got it.
Hang on, are you saying that it is not possible to extend this comparison accurately because there are not enough stations? That seems a bit damning of the methodology for long term studies.
No. He is saying that you cannot assume the 92 good stations remained good years after they were surveyed.
“Apparently even the measurements that weren’t actually measured are really important.”
Is that “vapordata”?
The climate science community appears to believe itself to be the modern day, much enhanced embodiment of Rumpelstiltskin, able not only to spin straw (bad data) into gold (good data), but also to spin nothing (missing data) into gold (good data) as well. I’m sure the Brothers Grimm would be impressed.
Forget about ‘adjustments’, they are still making up the numbers.
Monthly temperatures which are marked with an “E” are “estimated” rather than measured. More than half of the current data for 2015 is fake.
http://wattsupwiththat.com/2014/06/28/the-scientific-method-is-at-work-on-the-ushcn-temperature-data-set/
Any word on this 18 month old problem and did anyone see the fix / correction / statement?
Never did read about any corrections and from the above now near 45% (up 5%) still fake they are only making more.
Interestingly, Dr. Nielsen-Gammon did a very nice infill method on our series (which will be used in our future efforts). The results were much the same.
He and I calculated separately in order to make sure there were no problems regarding method.
As the saying goes, “treating the symptoms is not a cure.”
Dog said-“As the saying goes, “treating the symptoms is not a cure.”
It’s more like taking the infected out behind the barn and shooting them, and then declaring that because there are no sick people “in the hospital” now, there never was a worrisome illness in the first place.
It can be. But you have to do it right.
I have never asked for someones data before publication, but the release of results before publication is certainly unique. Of course, it took over a hundred people to create this data. With no budget on a volunteer basis to collect the quality control data. Without calculation it took tens of thousands of volunteer hours. NO, think about that folks. Tens of thousands, it cannot be less. To put this effort together.
Human years spent. Lifetimes given as a piece of their own. This is no exaggeration. Add up the hours yourself that it would take to travel to these stations and record and report the data. The hours to process, the hours to reprocess, collate, summarize.
You can legitimately wait to release that data, and do it with confidence Mr. Watts! Not because of the previous attempts to usurp your publications, but because it is a UNIQUE and UNPARALLELED situation in climate science. Despite hundreds of billions spent on climate change, the same effort with tree rings would have yielded the single largest data collection in the market
Because of the leadership of Anthony Watts, those of us who are considered ‘skeptics’, have done more quality control of the United States temperature stations than the US could pull off with a climate budget larger than NASA.
+1
Anthony is a born leader and has spent countless hours on this project.
I spent an estimated 3000+ hours making the ratings and analyzing the data. I located over 200 stations and supplemented the surveys of almost the entire set (over a thousand, in all). It has consumed my life. It is ongoing. We shall persevere.
Whether or not we ultimately prevail will depend on competent independent review. This is right, just, and proper. And in accordance with scientific method.
. . I forgive you !!
Compelling evidence CO2 has no effect on climate requires only (1) Understanding that temperature changes with the integral of the net forcing (not directly with the instantaneous value of the forcing itself). and (2) All life depends ultimately on photosynthesis which requires CO2. The 542 million years of evolution on land required substantial atmospheric CO2. The integral of CO2 (or a function thereof) for 542 million years could not consistently result in today’s temperature. Documented in a peer reviewed paper at Energy & Environment, vol. 26, no. 5, 841-845 and also at http://agwunveiled.blogspot.com which also identifies the two factors that explain climate change (97% match since before 1900).
I think CO2 has had a modest, but statistically significant effect. But that is not the subject of this paper.
I agree with Evan
Can you explain exactly what “statistically significant effect” means?
Is it; that it’s measurable?
Or is now a measured quantity?
Do you really mean to say “effect”?
And what exactly does this “statistically significant” mean in regard to the effect?
How do you explain 542,000,000 years of substantial atmospheric CO2 with no correlation whatsoever with temperature?
Do you realize that, because of (1) the Vostok measurements of CO2 and temperature going up and down together is actually compelling evidence CO2 has no effect on climate?
I hadn’t considered that.
The metadata issue in a nutshell:
Basically, the shorter the time series, the more unperturbed stations are available because it only has to be unperturbed during the period of study. Twice as many stations are unperturbed for our 1999 – 2008 series as for the 1979 – 2008 period (the increased number of eligible stations at least partially compensating for the 10-year shortness of the series).
For a station not to be dropped, it must have no record of moves (where previous location is unknown or the rating has changed even without a move). It must have no significant TOBS flips (if any occur further than 10% of the interval’s start or end point). And if you don’t like how we did it, we provide the TOBS changes and you can make up your own mind what to exclude. It’s an Excel tool: Anyone can do it.
At some point I want to bin by AM vs. PM observation times and see what effect (if any) that has on the trends.
But for all that stuff, you need metadata. We don’t infer it. Not yet, anyway.
Now, I am always thumping on the models (most of them) for their lack of a top-down approach. But there is a time for the ground-up approach, as well, and metadata is a good example. Having been immersed in the metadata, I can now start working on better ways to adjust the poorly sited stations, even take a shot at pairwise without going apples to oranges (for a change).
If this had no advantage, we would probably not do it (it is somewhat circular logic with a random element thrown in), but adjustment does have one critical advantage: it brings more stations into a set, improving coverage and (arguably) statistical robustness. That’s why NOAA likes to do it and BEST is absolutely compelled to do it.
Easy for us: we have only 30 years of the densely covered, data-metadata rich USHCN. Mosh has the mangy, rangy GHCN for the whole darn stretch, with distressingly uneven coverage . No way he can do the easy (like us) and simply drop. If we go global, we’ll have to adjust, too. And even we are not providing totally raw data: I’ve removed the major-flagged stuff, and adjusted for MMTS. So not even our stuff is entirely raw (just as raw as we could make it).
evenmjones; I’m not sure who you were answering, but you didn’t address my questions or answer Dan’s question.
Much of the theoretical effect of Man’s CO2 is claimed to be confirmed by the surface station records. Hansen made “catastrophic” claims about Man’s CO2 and temperature based on Greenhouse theory and the surface station records. (Which he continued to diddle with.)
This paper doesn’t address CO2 at all but rather the surface station records themselves.
It is important.
Politically, Man’s CO2 is being treated as a bullet fired from a fossil-fuel-powered gun. Politicians love to blame something and then control it.
The 1% invested in oil stocks, and the oil companies are devastated by this. But the 97% of consumers and trucker and poor and middle class are cheering that this form of cheap energy continues. I am!!!
http://www.bloomberg.com/energy
I have no idea why you posted this comment and link. Why not go to the Puffington Host site?
You’re right. I was wondering myself – meant to post it on a related article. I think I saw ref. to it in some article that was closed to comments…
Just received this: Ms. Stevens,
I’m not sure that you understand that no theory has one piece of evidence or data that proves it. The theory of the greenhouse effect is not the result one single line of evidence, but rather there is a convergence of evidence from centuries of science, laws of physics, laboratory experiments, direct observation along many different lines of inquiry. This information dates back to 1820 with Fourier, followed by Tyndall in 1861. Tyndall first published results that identified CO2 as a greenhouse gas that absorbed long wave radiation. http://rstl.royalsocietypublishing.org/content/151/1.full.pdf+html More precise research has been done since that time by numerous scientists, including measurements by Herzberg 1953 and Burch 1962 and 1970.
More recent studies include:
Harries 2001 http://www.nature.com/nature/journal/v410/n6826/abs/410355a0.html
Griggs 2004 http://spie.org/Publications/Proceedings/Paper/10.1117/12.556803
Evans 2006 https://ams.confex.com/ams/Annual2006/techprogram/paper_100737.htm
Chen 2007 https://www.eumetsat.int/cs/idcplg?IdcService=GET_FILE&dDocName=pdf_conf_p50_s9_01_harries_v&allowInterrupt=1&noSaveAs=1&RevisionSelectionMethod=LatestReleased
Feldman 2015: http://www.nature.com/nature/journal/v519/n7543/full/nature14240.html
Summary: https://www.ipcc.ch/publications_and_data/publications_ipcc_fourth_assessment_report_wg1_report_the_physical_science_basis.htm
This is a very robust, widely-accepted scientific theory.
Best regards,
Susan
Susan Callery
Manager, Earth Science Public Engagement Office
Jet Propulsion Laboratory
California Institute of Technology
4800 Oak Grove Drive
Pasadena, CA 91109-8099
Tel (818) 393-1545
Clearly Susan Callery doesn’t understand. She presumes that skeptics reject the ‘greenhouse effect’.
But most skeptical scientists say that rising CO2 has some effect. Susan’s problem is that neither she nor anyone else has ever been able to measure the fraction of global warming caused by human CO2 emissions, out of total global warming from all causes such as the planet’s emergence from the LIA, or the thirty or so times more CO2 than humans emit, that are emitted by natural sources.
She links to those papers because she cannot produce any verifiable, testable measurements quantifying the amount of global warming she believes is caused by humans. In fact, none of those authors have measured human-caused global warming, either. No one has.
So we’re left with a group of people heavily subsidized by the government, whose President constantly says that “climate change” is caused by human activity.
Does Susan want her cushy job? If she dared to question the government’s ‘climate change’ narrative, she would be out of her job in a hurry, and someone more compliant would take her place.
That’s what we’re faced with. And that’s why Susan Callery’s comment means nothing as far as honest science goes.
Eve, are you Susan Callery?
If no, why did you post her letter?
If yes, What does your letter have to do with this post? Anthony et al are researching the validity of the Surface temp data, they are saying nothing about greenhouse warming. Did you even read the post?
J..
Mosher’s unflinching defence of the indefensible for several years now is what has got my goat.
USHCN 1218 stations and as state only 400+ unchanged and usable.
Over half are now virtual, put together by data from the other sites. There are some sites added in and a drop out rate of 30 sites a month that have to be repaired .
Mosher claimed to have looked into siting and that the urban heat effect did not exist for all practical purposes.
What he really did was check that the already adjusted figures matched each other.
He has never admitted the paucity of real stations.
Without real stations you can use dodgy maths to produce however much warming you want.
Given his staunch support of friend and colleague Robert Way who is a Skeptical science advocate and associate and has tried to disprove the hiatus with a “perfect” algorithm, that is it never produced negative cooling figures, makes any early input of his counterproductive.
He has a lot to do to earn any trust and respect back.
An easy step would be to say how many real USHCN stations are actually in use.
Hmm????
Thought so.
Have never had this figure in three years from Zeke , nick stokes or Mosher
Mosh is trying to adjust the others. We expect we’ll be trying that, too, down the road. I’ll at least be looking at getting some of the more severely truncated stations into the set. But that is trickier than it sounds if you are dealing with startpoint and requires at least a rudimentary pairwise.
My objection to BEST is that its pairwise is not adequate to deal with pairwise involving a systematic error of omission, i.e., microsite. His method is dandy for detecting and splitting jumps, but microsite is not only a systematic issue, it does not create jumps — its effects are inherently gradual. So unless he targets microsite, he will miss out on it.
If he redirects some of his equations and does it his way but according to our classifications, we might be singing the same tune down the road.
Question for Mosher:
Seems that your money comes from the taxpayer, so what value does the taxpayer get from paying money to Mosher?
Looking forward to your detailed reply, Mr “Leech” Mosher.
Interesting method with potentially valuable application. if his stuff gets linked up with our stuff, I think much good could come of it.
I don’ mind what they [NOAA, GISS, HadCRut et al] do with the data T sets, and other splicing jiggerypokery but what is the point of hiding your methods if…. you purport to be an honest injun?
Publish it and then we’ll all see.
Mr Watts, in this quite enormous endeavour and sifting for the truth, we sit in wonderment and awe filled admiration.
http://blog.primalpastures.com/uncategorized/time-magazine-says-eat-butter/ Judith Curry uses this as an example on the dangers of Consensus and the problems it can cause. We should all write Time Magazine to show them are making the same mistake on Climate Change and took 40 years to correct after every one is Sick and on Multiple Drugs.
I think AW is showing some skill in the game of climate change politics. He gets a very respected co-author and then with bravado calls for a press release and refuses to release data until publication. If the warmist tribe blocks publication then they never get the data to de-bunk his claims and the most powerful skeptic on the www gets the volume turned up for his cause. All he needs to do is insist that he has a viable study and quote climate-gate with a Spencer-Brasswell-Dessler-Trenberth inference and he scores a political hit. For the warmist tribe they better hope that they can find something like 2012 TOBS issue or this paper could have “pause” like legs.
Some quotes come to mind.
“It’s amazing how much panic one honest man can spread among a multitude of hypocrites. ”
― Thomas Sowell
“People who pride themselves on their “complexity” and deride others for being “simplistic” should realize that the truth is often not very complicated. What gets complex is evading the truth.”
― Thomas Sowell, Barbarians inside the Gates and Other Controversial Essays
Noise is noise and noise is a problem because it replaces detail or meaningful data, not because it obfuscates it. No noise algorithm will create new detail, and often removes some amount of detail that was there in the process of removing the noise.
It is even worse in climate data, since the noise comes in what seems a limitless potpourri of forms.
The best that can be expected from data that requires extensive curing or cleaning up is a better picture of how poor the data is.
Noise can be useful in some cases however.. You can add it to a low level signal and, by statistics, resolve a better A/D answer. Done all the time.
You can average it over a period and possibly recover a signal buried in that noise. Again done all the time.
Bad things happen when signal and noise get closely entangled in frequency and amplitude. That’s all.
I’m not sure there is much of anything said about Anthony Watts that wasn’t also said about Marie Curie. She had no recognized credentials. http://fee.org/freeman/woman-of-science/ Credentials don’t matter. Accurately describing nature matters. All humans and all human institutions can be fooled. Nature will not be fooled. Nature will prove out.
Hear, hear about credentials. An accurate, logical, factual description of what we see does not require a funny hat. Just a clear point of view and the ability to describe it. Anyone can be right or wrong, Credentials MAY indicate that the person who is talking knows that about which (s)he talks. They MAY also indicate a load of other things as well.
I suppose I should have said she initially had no recognized credentials. Regardless, the proof is in the pudding.
Anthony – Steven Mosher claims:
I wanted to post this at Judith’s blog but can’t for some reason:
A poster session presentation prior to refereed journal publication with data made available after journal publication is SOP. My research decades ago followed such a path. No sniping. No whining. Maybe because Mosher was still in diapers? This we did even in an impolite competitive atmosphere that resulted in our first submission attempt being rejected because the editor of that journal was investigating the same thing and we had a paper ready earlier than he did. So we submitted to another journal which accepted it rather eagerly. As an aging has-been one-hit-wonder researcher, the thread over at Judith’s discussing (or rather Mosher’s wanting cheese with that whine) Anthony’s poster session reminds me of toddlers arguing over a toy.
Bore repeating with emphasis. Glad you had to post it here! (for I have missed you and hoped all was well in general with you and was also eager to ask…. ?? (smile)….)
The previous one did not turn out (good thing too). However, a very nice one turned up out of the blue and has captured my heart.
HOORAY! #(:))
I wish you all the joy in the world, dear Pamela. Keep me (er, us, heh) posted! He is blessed (and, being a great guy (and intelligent enough to attract YOU), he no doubt knows that).
“Out of the blue… .” So cool. We just “never know what a day will bring forth… “.
#(:))
hmmmm.
Question. Might this be a data set that could be used to UN-adjust outlying “over-adjusted” data sets in much the same way the overly adjusted sunspot data sets were UN-adjusted?
hmmmm.
Re: requests from over-privileged coat-tail riders to get the data before it is published: Mosher should not get more gate-preference entry than any other climate scientist wanting into the party. Once the study is published, along with the requisite methods and data, I say he gets to compete with all the other scientists who want to take a crack at it and publish.
To those who are critical of “Watts et. al.” for not releasing the data before publication, (They said they would after.) can you please provide a link to Mann’s data? He published a few tree-rings ago but still seems to be hiding it.
This year’s AGU Fall Meeting seem to have been much better than the years from 2007 to 2014.
This year we hear, at least I did not nor read it, that the Arctic Ocean would be ice free next summer, or 2016, or 2018 or even any number. Looks like the Marc Serrezze, Zwally (saw them at the meeting), Mann, Jones and Hansen crowd are piping down about the oncoming, yet never to be here, climate catastrophe.
However, there was the return of the “Angry China Man on the corner” telling everyone in broken China-lish that Scientists are wrong and going to hell. The accent seemed too put on to me so I suspect he is actually an actor, or just a crazy, getting his jollies and maybe a spot on the local news.
“Swientisfts … BAD, … All wfhrong. U Go To Hell.”
But in a sense of it, Serrezze, Zwally, Mann, Jones and Hansen (shall I throw in Gore, He did appear, yes Gore lumped in too) are all wrong. Since I’m an Atheists it does not matter to me if they can find Hell or just a bar down the street.
Ha ha
WOW.
Had to Google this out:
http://www.carbonbrief.org/agu-2015-scientists-offer-latest-update-on-worsening-state-of-arctic
“The next generation may see an ice-free summer, but hopefully their descendents will see a return of more sea ice later in the century.”
GENERATION! That is about 25 years; 25 FU*KING YEARS.
Critical words: “may see”. That’s like, “If a dog wont do it, you wont see it!”
That’s a “not in hell” in a handbag!
While the Arctic, the real Arctic is doing fine and well, the AGU Cryosphere Section is burning AGU cash on the short and does not have a plan for the long. Ergo, AGU CRYOSPHERE SECTION dead in the water and when the 50-incher lobs in to the magazines at mid-ships, its all over baby! The Cryosphere Section Bismarck goes down beneath the waves of the North Atlantic and taking all of its misanthropes (Serrezze, Zwally, Jones, Mann and Gore) with it. GOOD RIDDANCE [trimmed].
Ha ha
Anthony – I am continually amazed by the arguments about the slight warming that has been happening recently.
I believe the ENSO cycles are natural cycles that have been happening millions of years. I believe the level of CO2 in the atmosphere has been increasing over the last 50 years at least partially due to man burning fossil fuels. I believe global temperatures reached a local (in time) peak in 1998 due to the natural variability from a massive El Nino. Then temperatures were pretty flat despite increasing levels of manmade CO2. Now, we are experiencing a slight run up in temperatures associated with another naturally occurring El Nino.
It seems obvious that the temperature rises we have seen in recent times are associated with naturally occurring events. The temperatures seem uncorrelated with levels of manmade CO2 levels. How can you say that manmade CO2 levels are the primary driver of changes in global temperatures?