By Larry Kummer, from the Fabius Maximus website
Summary: The coverage of this El Niño shows the fear and propaganda (used as clickbait by journalists) that clouds American’s vision of the world, keeping us ignorant. It also shows how the antidote lies within our reach. For the El Niño that means reading the NOAA’s well-written reports that accurately predicted this would be among the 3 strongest on record, contrary to the hysterical predictions by activists of a “monster” El Niño. It appears to have peaked, but the full impacts on the weather lie ahead.
The title of NOAA’s latest report about this El Niño gently mocks the hype about its effects (e.g., a “Godzilla El Niño”, destroyer of cites). The text debunks exaggerations about it being the greatest ever. So far this El Nino matches NOAA’s prediction that it would be among the three strongest on record (i.e., in the 65 years back to 1950).
This is another of NOAA’s well-written articles that put the El Niño into its proper historical context as a normal weather event. As usual these days, activists and their journalist fans often ignore what NOAA says (just as they do with the reports by the IPCC) in favor of exaggerations and wild predictions.
I recommend that you read the full essay. Here are some of the high points. Red emphasis added.
Excerpt: “December El Niño update: phenomenal cosmic powers!“
By Emily Becker, with comments by Anthony Barnston
At NOAA’s website, 10 December 2015
If you’ve been following the development of this El Niño, you may have heard in the media that sea surface temperatures in the central equatorial Pacific are at near-record highs. Are we seeing the most powerful El Niño ever?
… The important effects of El Niño on the U.S. and other regions are related to its average strength over the fall and winter, not how strong it is on any particular day or week. We do monitor the weekly and monthly changes in the sea surface temperature and the atmosphere to get a hint at where things are headed, but we’ll ultimately judge the strength of this El Niño by its average over the seasons.
… Right out of the gate, let’s talk about that November sea surface temperature in the Niño3.4 region. The ERSSTv4 data set shows that this November was 2.35°C warmer than the November average — tied with November 1997’s 2.33°C. (Yes, I know those numbers aren’t identical, but they’re within the statistical margin of error, which means as far as rankings are concerned, they’re tied.), This dataset has been carefully maintained to ensure that it is historically consistent, so it’s the best, most reliable one to use to compare 2015 to 1997 (or any other year.)
The Niño3.4 ERSSTv4 for September–November is 2.04°C, second to 1997’s 2.18°C. Since we’re looking at this El Niño very likely placing in the top three (with 1997-98 and 1982-83), let’s compare some of the other components of the system right now. I’m going to focus on 1997-98, since by most assessments that’s the strongest El Niño in our short, 1950-present record.

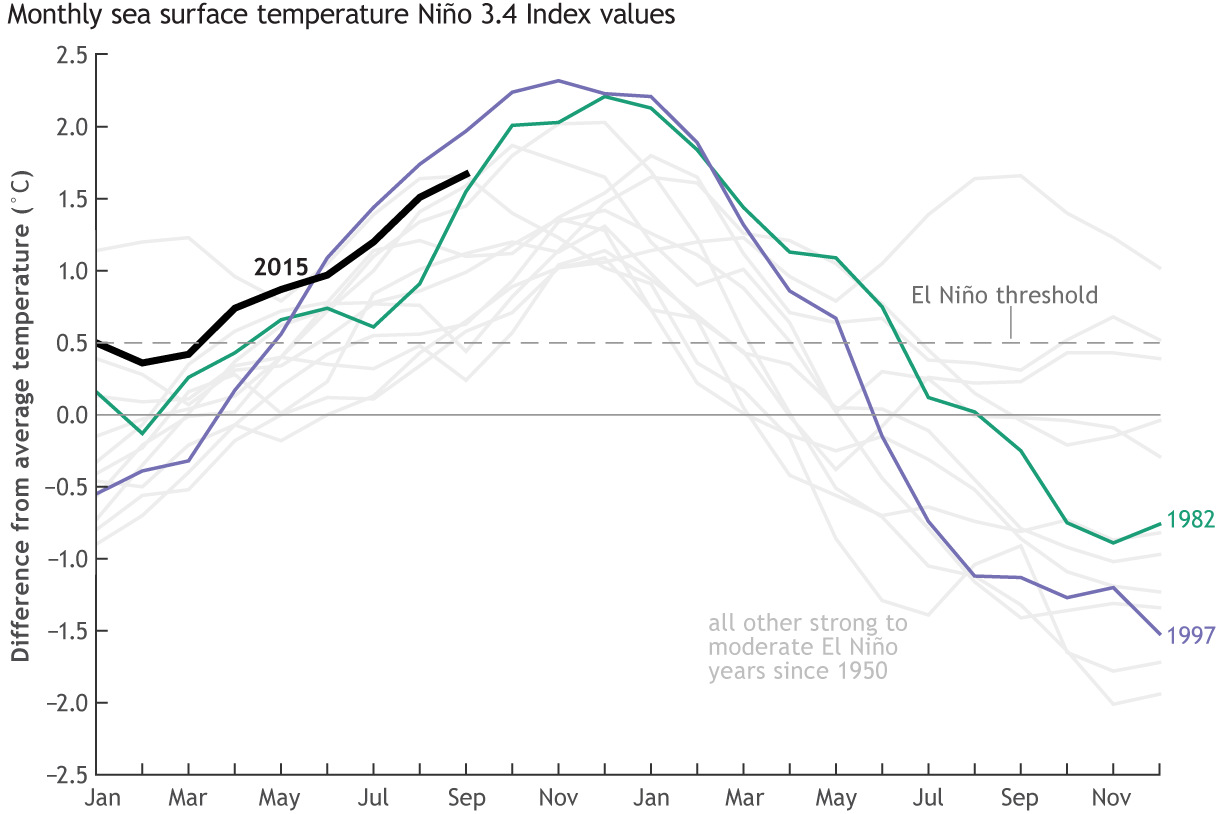
Monthly sea surface temperature in the Niño 3.4 region of the tropical Pacific compared to the long-term average for all moderate-to-strong El Niño years since 1950, showing how 2015 (black line) compares to other strong events.
… If you average the September – November low-level winds over the central Pacific, you get about 8 miles per hour, trailing 1982 (1.5 mph) and 1997 (-2.5 mph) pretty substantially (positive numbers means the wind is blowing from east to west, and negative means west to east). The average wind speed of the trade winds this time of year is about 16 miles per hour.
Another measurement of the atmospheric response to El Niño’s warmer waters is the Equatorial Southern Oscillation: November 2015 is currently third, behind 1997 and 1982. While we’ve seen consistently more clouds than normal over the tropical Pacific this year (evidence of increased convection due to the warm water), this response has also been less than it was in 1997 over the central to eastern Pacific.
There is a lot we don’t understand about how El Niño works, and exactly why the atmospheric response is weaker in 2015 than it was in 1997, despite very similar east-central Pacific temperatures, is going to be a hot research topic going forward. …
A look under the surface
… We monitor the ocean heat content in the upper 300 meters (about 1000 feet) of the equatorial Pacific. 2015 has had a large, consistently above-average ocean heat content since this El Niño began in March, as you can see below. However, a side-by-side comparison with 1997 reveals there is still not as much heat fueling this El Niño as there was 18 years ago. …

From Australia’s Bureau of Meteorology.
What does it all mean?
Every El Niño event is different, and even if there are some strong similarities between this El Niño and another, we’d be really surprised if everything lined up exactly the same. By most measures, this is one of the top three strongest El Niños since 1950, and there’s still a chance it could record the highest Oceanic Niño Index (the three-month-mean sea surface temperature anomaly in the Niño3.4 region, our primary ENSO metric). But ocean temperatures are just one way to measure ENSO, which can be tracked in many ways.
While the warmer-than-average ocean waters are likely reaching their peak about now, they will remain a huge source of warmth for the next several months to drive the main impacts on temperature and rain/snow over North America, which typically follow the peak. The main impacts season is December–March, so we’re just at the very beginning of finding out what this El Niño event will bring to the U.S. There’s no doubt that El Niño 2015-2016, which has already shown its power around the world, will have a significant effect on the U.S. winter.
Comments by Anthony Barnston
It’s going to be a very interesting “horse race” among the 3 events. I agree that the 1997-98 will probably retain its number one rank. As for beating 1982-83 or not, it’s going to be close! In terms of the ERSSTv4 SST data, we are currently running just a bit ahead of 1982-83, but in 1982-83 the SST slightly increased more for December, and stayed nearly as warm in January (using just 1-month average ERSSTv4) than it might do this December and January. So I wouldn’t want to bet the farm either way, as fun as it might seem.
… While most of the US has its strongest climate effects from ENSO during winter (December through mid-March), the West Coast’s impact tends to happen just a bit later in the season, even if the El Nino itself starts winding down. So I’m not at all surprised that so far, the pattern of dryer in the Pacific Northwest and wetter in southern California has not yet appeared in earnest. It’s possible that before that pattern does form, BOTH the southwest and northwest could receive alternating periods of pretty strong storm system passages.
—————————- End Excerpt —————————-
For more about this see Bob Tisdale’s December ENSO Update – “Shouldn’t Be Long Now Until the El Niño Starts to Decay”.
Nino 3.4 peaked in mid-November and will slowly decline from here.
And all we have is November temperatures to witness so far. The lag means the temperature impacts are still coming later, January February and March 2016.
Some of the measures such as those from the NCEP branch of the NOAA have this as the second largest El Nino on record.
http://www.cpc.ncep.noaa.gov/data/indices/sstoi.indices
http://www.cpc.ncep.noaa.gov/data/indices/wksst8110.for
http://s21.postimg.org/gbr75yjfb/Nino_3_4_lag3_UAH_RSS_temps_Nov2015.png
Just did major posting on Weatherbell. OLR is much more like 1957,1965,1987,2006,1986 blend then the aforementioned ones. This should lead to a huge mid and late winter flip like those years over the southern and eastern US with the NE a battle ground between what will turn into a hyper southern storm track and high pressures to the north. Unlike 82/83 the soi is no where near as strong. The centering of the warm water in relative terms of OLR is FURTHER WEST and this is crucial. In addition Scripps is spot on about the reverse coming so a La Nina develops. JAMSTEC ( which also says this winter will flip Dramatically, Also develops la nina by fall.
Major strat warm should evolve Jan 10-20, and if we are right, people will see the idea.
What to the models say about the evolution of this El Nino?
The mid-December IRI-CPC Plume of models predicts that it has or is peaking (Nino3.4 SST for Dec-Jan below Nov’s), fading fast but will remain a “strong El Nino” through Spring 2016.
http://iri.columbia.edu/wp-content/uploads/2015/12/figure42.gif
As Joe mentions, we might get a La Nina in 2016. They give odds of 24% for a La Nino in June-August, 37% for July – Sept, and 46% for August – October.
http://iri.columbia.edu/our-expertise/climate/forecasts/enso/current/
I forgot to add: model predictions for ENSO are unreliable this far out. They get much better in early summer — once past the “Spring barrier”.
I thought the folks at NOAA WERE the activists.
vlparker,
That’s why posts like this are valuable. Showing what NOAA actually says cuts through the urban legends. Only for those who wish to see clearly, of course.
Dear,
I think I’ve found the thing you were looking for, just take a look here http://reussirauxusa.blog/gain.php?5958
My Best, gerjaison