Guest essay by Andy May
This is an updated timeline of climatic events and human history for the last 18,000 years. The original timeline was posted in 2013. The updated full size (Ansi E size or 34×44 inches) Adobe Reader version 8 PDF can be downloaded here or by clicking on Figure 1. It prints pretty well on 11×17 inch paper and very well on 17×22 inch paper or larger. To see the timeline in full resolution or to print it, you must download it. It is not copyrighted, but please acknowledge the author if you use it.

Figure 1 -click for a much larger, printable poster (PDF)
References to the images and data are given in this essay as hyperlinks. I’ve done my best to verify the accuracy of the content by checking multiple sources. When references had different dates for the same event, I chose the most commonly cited date or the most prestigious source. All dates (except some in the modern era) are given as “BP” or before the year 2000 for simplicity, using 1950 (the radiocarbon zero) was too cumbersome.
The heart of the poster is the timeline of historical and climatic events. The Last Glacial Maximum (LGM) ended around 19,000 BP, the illustrations on the lower left of the poster illustrate what the world was like then. Much of the land area of the world was under ice or desert at the time and the exposed land had less precipitation than we do today. The history of civilization shows that cooler periods have less precipitation than warmer times. It seems counter-intuitive, but warm air has a higher water carrying capacity and this leads to more rain. For example, the Sahara is now becoming greener as Carbon Dioxide and air temperature go up. If there were any organized human civilizations during the last glacial period we have not found any evidence of it, other than some pottery in China, dated to 20,000 BP. At this time people lived in small communities of a few families and hunted for animals and edible natural vegetation. Domesticated animals (with the exception of dogs) and sedentary agriculture would not appear for another 6,000 to 7,000 years, around 13,000 BP.
Dogs were probably domesticated by man by 14,000 BP and perhaps more than 30,000 BP. The Natufians collected wild grains, fruits and vegetables and probably cultivated small gardens as early as 14,000 BP. But, this early, large scale organized farming was unlikely.
The central part of the poster shows two ice core records. The top chart is the most recent portion of the VostokAntarctic ice core record. The entire Vostok 400,000 year record is shown in the upper left of the poster with the time scale reversed, this chart also includes the Carbon Dioxide concentration (in green) and the dust concentration (in red). The roughly 100,000 year Milankovitch cycles are very apparent in the Vostok record. These cycles are composed of a dominant period of 413,000 years and lesser periods that fall between 95,000 years and 136,000 years. The tilt of the Earth’s axis is what produces our seasons and it varies about 3° on a 41,000 year cycle. Finally, the Earth’s axis wobbles (the precession cycle) on a cycle that should be 25,772 years. Due to modifications in the precession cycle predominantly by the Moon, Jupiter and Saturn, the dominant precession period is roughly 19,000 years with a secondary peak periodicity of around 23,000 years. The 25,772 year cycle is in theory only.
The precession cycle determines when orbital perihelion occurs, or the time of year when the Earth is closest to the Sun (see Figure 2). Currently, perihelion occurs in January. This means that in the Northern Hemisphere we currently receive 6.5% more solar radiation (88 Watts/m2) in the middle of winter than we do in the summer. This makes the seasonal variation in air temperature less than normal which reduces extreme weather. It is the opposite in the Southern Hemisphere. Thus, now their winters are colder than normal and the summers hotter, increasing their weather extremes. When this flips, as it will approximately 10,000 years from now, the North will have extreme summers and extreme winters and the Southern Hemisphere will be quieter. The last Northern Hemisphere maximum effect was between 12,000 BP and 10,000 BP around the end of the Younger Dryas cold period. The Holocene Thermal Optimum (roughly 9,500 BP to 5,000 BP) occurred as the Earth moved from the lower position in Figure 2 to the left position. The long cooling period from then to the present day occurred as the Earth moved from the left position to its present position with perihelion in January. The dates in the figure are approximate.

Figure 2 (click to see at source)
It is interesting that Tarling, 2010, concludes that
“Solar radiation is thus the driving force for terrestrial climatic change during the last 1-2 Myr, as suggested by Milankovitch (1941) and supported by Hays et al. (1976) but it is the planetary gravitational influences on the Sun itself that causes the dominant 100 Kyr periodicity in the Earth’s climate during the last 1-2 Myr. “
Changing the ellipticity of the Earth’s orbit changes the minimum and maximum amounts of solar radiation reaching the Earth. Changing the time of year that perihelion occurs through the precession cycle doesn’t change TSI (total solar irradiance) but it does change the extremes of summer and winter. This so-called “latitudinal change” in insolation can have a huge effect on hemispherical climate, some believe that the total radiation reaching the Earth at 65°N latitude is critical to the growth and decay of glacial ice sheets.
In the plot of the full Vostok ice core record in the upper left, you might just be able to see that the middle graph (Carbon Dioxide concentration, green line) slightly lags the temperature by about 800 years on average. This suggests that the changes in temperature might cause the Carbon Dioxide changes rather than the other way around. The airborne dust concentration (red line) increases when the world is cooler because in the cool periods it is also dryer. One of the primary reasons colder periods are a problem is that they are accompanied by drought.
Next to the complete Vostok record is a reconstruction of the temperature record for the last 600 million years. Temperatures, today, are lower than they have been for over 250,000,000 years according to this data. The bottom large chart is the actual central Greenland temperature, calculated by the Greenland Ice Sheet Project.
More recently, both the Vostok record and the Central Greenland record by Alley, et al, show a decreasing temperature trend since the Minoan Warm Period about 3400 BP. The trend is more subtle in the Antarctic record than in the Greenland record. Shorter term changes in the temperature records do not correlate well. But, warming from the Younger Dryas, a long flat warm period until about 3400 BP (Holocene Thermal Optimum) and then cooling to the present day is clear in both records. The start and end dates for the Holocene Thermal Optimum marked on the timeline are my best guess. There are no agreed dates. Many start and end dates are seen in the literature, for examplehere, here, here, here, and here. Long term trends that correlate between the Arctic and Antarctic are likely due to external events, such as changes in total solar irradiance (TSI) or certain orbital changes.
Bond Events
Just below the Central Greenland ice core record some of the “Bond” cooling events are noted. The Bond cooling events average 1,470 years +-500 years apart and some are more dramatic than others. The 8.2, 5.9, 4.2 and 2.8 Kiloyear events were major events, with dramatic cooling and they disrupted civilization around the world. Some major climate events, such as the 3177 BP climatic event that ended the Bronze Age in the Mediterranean, are slightly off of the Bond Event, but appear related. Timing of climate changes is fuzzy. Some researchers believe that the Little Ice Age was a Bond event.
During the last glaciation, the Greenland ice core record shows climatic change events called Dansgaard-Oeschgerevents or “D-O events.” These are very rapid warming events, followed by slower cooling, that occur in a cycle of roughly 1,470 years +- 12%. These events are probably the glacial period equivalent of the Bond events. They have a similar timing but the climate effect is different or, maybe, the events are the same but the record shows warming easier during a glaciation. Because the timing of these events stays about the same during glaciations and interglacials,solar variability is the probable cause. Internal oscillations due to ocean circulation patterns, etc. are unlikely to stay stable in their period as the Earth goes from the glacial state to the interglacial state.
In modern times, cooling is more noticeable than warming. Cooling and droughts are simply more disruptive than warming. This is particularly true in the Sahara. About 10,000 years ago the perihelion (Earth closest to the Sun) occurred in the Northern Hemisphere summer and the summers were warmer and more humid than we see today. This was the beginning of the aforementioned Holocene Thermal Optimum. During this period the Sahara became a savannah. This is called the African Humid Period (AHP). The AHP ended between 5900 to 4000 BP when the Sahara turned back into a desert as the climate began to cool. Towards the end of the period the progressive desiccation of the region led to widespread migrations and the abandonment of many North African villages. This exodus was coincident with the rise of sedentary life and the pharaonic culture along the Nile River.
Sea Level
Moving just to the right of the Last Glacial Maximum map on the lower left of the poster, you can see an artist’s (Robert Rohde) rendition of the rise in global eustatic sea level after the glaciers started melting. The data used to make the graph is from numerous sources listed in this web site. The earliest well documented evidence of human civilization dates to the middle of the most rapid rise in sea level in this period, roughly 12,000 BP at Gobekli Tepe. From 11,500 BP to 11,000 BP sea level rose an astonishing 28 meters (Meltwater Pulse 1B) or 6 cm/year on average. This is over 18 feet per 100 years! According to the University Of Colorado Sea Level Research Group, the current rate of sea level rise is about 13 inches per 100 years or 3.3 mm per year, much less dramatic.
Earliest evidence of civilization
Gobekli Tepe is near Urfa in southern Turkey. This site is roughly 300 meters by 300 meters and contains intricately carved stones. It predates Stonehenge and the earliest Egyptian pyramids by 7,400 years. Construction at Gobekli Tepe began during the Younger Dryas “Big Freeze.” The Younger Dryas was a sudden and short lived (geologically speaking, it lasted over 1,000 years) return of very cold and dry weather, similar to the cold that existed in the Last Glacial Maximum. The Gobekli Tepe site is composed of multiple circular stone monuments. The tallest pillars in these monuments are 16 feet high and weigh over seven tons. The rings are 65 feet across and probably have religious significance. Construction of the site appears to have occurred during a hiatus in the sea level rise between 11,000 and 12,000 BP. Then the site was mysteriously and deliberately buried around 10,000 BP, during a period of rapid sea level rise. The reasons for its construction and later burial are not known. But, one can probably safely speculate that it was buried to protect and preserve it. This task was accomplished, it is remarkably well preserved.
It is interesting that the wild wheat that grows in the area around Gobekli Tepe is a close relative, genetically, to modern domestic wheat. One can speculate that the early religious fervor that caused Gobekli Tepe to be built, may have inspired farming. After all, the construction of the religious monument would have required a number of people to live in one spot for a long time and they could not migrate in search of food.
The earliest evidence of large scale organized agriculture is seen in the Levant region of the Middle East in present day Syria and Israel. This occurred about 13,000 BP. There are some preserved pottery fragments from 13,000 BP in Japan and perhaps even older. Others have reported that pottery existed in China 20,000 BP. However, there is no evidence that the Japanese or Chinese pottery came from sedentary farmers. It is possible that rice was farmed to some extent in China 13,900 BP. It disappears from the record during the Younger Dryas cold period and reappears after 10,000 BP. The type of rice we eat today was originally farmed in China’s Yangtze Valley around 8,200 BP.
Between 13,000 and 14,000 BP a lot seemed to happen at various archaeological sites in the Middle East. Buildings improved, villages got larger and were more advanced. But, they were mostly abandoned as temperatures cooled during the Younger Dryas. This cool period was very dry. According to Steven Mithen few advances in human civilization happened in the period, people were just trying to survive. This is evident as the late Natufians, who lived during the Younger Dryas period, were in much poorer health (fewer teeth, often with caries) and smaller than the earlier Natufians from the Late Glacial Interstadial period. Further, the animal bones in their garbage dumps held bones of smaller animals than the earlier period.
When the Natufians began to build small villages the climate in the Levant was ideal, with abundant precipitation and lots of wild grain to harvest. The Younger Dryas cold and dry weather caused some of the Natufians to give up village life. Others began to cultivate the grain more intensely by watering it, saving the best seed for the next crop and so on. They also invented better farming tools and silos for grain storage. We know this from archaeological digs in the area around Jericho, Israel.
Larger Cities
The Middle Eastern Pre-Pottery Neolithic B (PPNB) culture began around 9,500 BP. It is a significant period in the history of human civilization because at this time man became more dependent upon domesticated animals and organized large scale (beyond single family) farming. It has also been found that the earliest Indian agriculture appears to have started in the Indus valley and in Pakistan around 10,000 BP. As noted by Anil Gupta, climate influenced the onset of man’s agricultural revolution.
As large scale agriculture took hold and the climate improved, man began building larger settlements in the Levant. Rectangular buildings appeared and larger more organized communities. Plaster and pottery are first seen in Middle East at this time, although they had existed for many thousands of years in China and Japan. It has been suggested by Ryan and Pittman that many people from many cultures gathered around the modern day Black Sea (which was a fresh water lake at the time) during the Younger Dryas since it was a reliable source of water. They exchanged technology and when the climate warmed and precipitation increased they returned to their historic homes bringing what they had learned with them. Thus, the new PPNB technology may have begun as people migrated back to the Levant from the Black Sea area. Other researchers believe that pottery, new domesticated crops and animal technology spread to the Levant from modern day Iran. Either way it seems likely that the new technology typical of the PPNB came from the East.
The PPNB ended with the 8,200 year BP event or Bond event 5, this was another sudden cold period that affected civilization and caused massive migrations of people in search of food and water. This period was undoubtedly another period of technology exchange between cultures. Over a period of 20 years, temperatures cooled roughly 3.3°Cin Greenland. It was not as severe as the Younger Dryas, but still significant. It lasted 200 to 400 years. The fact that the Black Sea became connected to the Mediterranean at about this time is not in dispute. But exactly when (8400 BP or 7600 BP or in several episodes between these dates) is a subject of debate. If the Black Sea was filled catastrophically, as described by Ryan and Pitman; it may have created the Great Flood legend. For example, Noah’s Flood or the older Gilgamesh story.
During the PPNB period evidence of relatively large settlements is found. Catalhoyuk, a city of 8,000, existed near present day Cumra in Konya Province, Turkey. This is a large, relatively modern “city” that existed 9,400 BP.
Jericho, in Israeli occupied Palestine, is often considered the world’s oldest continually occupied city, but Aleppo and Damascus, Syria may be older. Remains of early settlements, villages of 500 people or so, in Jericho have been dated to 11,600 BP. The first woven cloth known was found in Nahal Hemar cave in Israel. It is around 10,000 years old, it was found with bone shuttles that were used to weave the cloth. The cloth was a type of linen and not cotton, cotton was developed later in India.
Writing
Simple writing appears in Jiahu, China around 9,200 years ago and in Tartaria, Romania before 7400 years ago. Whether either is true writing or not is a subject of debate, the symbols on the Tartaria tablets have not been translated and may be a “picture” story. The Chinese writing has some symbols that are similar to modern Chinese writing. Because Chinese writing is not phonetic, it is hard to tell where “picture writing” stops and true modern writing begins.
True writing has been discovered from 5,500 BP in Syria in the Uruk period. By this time very large cities existed and the city of Uruk had over 50,000 people in it. The Uruk period was characterized by large scale urbanization, irrigation, roads and canals. It may have begun as early as 6,200 BP. The end of the Sumer Uruk period and the sacking of Uruk by Sargon of Akkad formed the Akkadian Empire, which may have been the world’s first multinational empire. The end of the Akkadian empire 100 to 200 years later, coincides with the third Bond event roughly 4,174 BP. Some researchersbelieve that climate change, cooler temperatures and more arid conditions, played a role in the collapse of the Akkadian empire. The 4.2 Kiloyear Bond event is highlighted in yellow on the timeline.
5.9 Kiloyear Bond Event
About 5,900 BP the Sahara became a desert. This is the 5.9 Kiloyear event or Bond event 4. This cooling event ended theUbaid Empire and caused a huge migration of people from the Sahara region in search of food and water. Many migrated to the Nile Valley in Egypt, in order to be close to a reliable water supply. Claussen, et al., 1999 has suggested that this drought was caused by a severe cooling event that occurred at the same time. He concludes that warmer temperatures cause more evaporation and more precipitation. The Sahara never recovers from this event. But, since the drought forces people into river valleys, larger cities are built and societies become more complex.
Following the end of the 5.9 Kiloyear event and the end of the Holocene Thermal Optimum the earliest Egyptian pyramids are built, Stonehenge is constructed in present day England and the first large cities appear in India. The earliest Mayan cities appear around 3,900 BP. Recently, some evidence has been uncovered that India may have had a large city as long ago as 9,500 BP. If this is true it would rival Catalhoyuk in age.
4.2 Kiloyear Bond Event
The 4.2 Kiloyear event was a very cool period in the Arctic (Bond Event 3) and it caused a severe drought in the Middle East. This probably caused the sudden collapse of the Egyptian Old Kingdom, famines and social disorder. Similar disruptions occurred in the Akkadian Empire as noted above, the Indus Valley and in China. It is interesting that the Monsoons in India, which are critical to farming in the Indus Valley, stopped between 4,200 BP and 4,000 BP.
Around 3,200 BP, the great Bronze Age civilizations in the Middle East collapsed or were disrupted. These included the Minoan, Mycenaean, Hittite and the Egyptian New Kingdom. This sudden collapse was probably caused by “climatological cataclysms that affected the entire eastern Mediterranean” in the words of Itamar Singer, as described by Eric Cline in “1177 B.C.” One could say this drought and famine was of Biblical proportions as the Exodus of Hebrews and the 10 famous plagues of Egypt took place at this time. As Cline notes in the afterword of “1177 B.C.” there was a century [actually 100 to 400 years] long drought at this time and it caused famine, upheaval, rebellion and war. The onset of this drought coincides with a sudden and extended cooling period in the Central Greenland ice core data. In general, most large scale droughts in the last 18,000 years appear to be associated with cooling in the Arctic. This drought and cold period marks the end of the Minoan Warm Period.
Greek Dark Age
After the collapse of the Bronze Age cultures the Mediterranean entered into a period called the Greek Dark Ages. This is a hiatus in the development of Middle Eastern civilization and not much happens until after 2,800 BP. The first phonetic alphabet was probably created just before this period by the Phoenicians. Little is seen of writing or the alphabet during the Dark Age, but it flowers in several forms as the Roman Warm Period unfolds. This alphabet was used, with alterations, by the Greeks and the Romans. It was the beginning of modern writing in the West.
Brandon Drake (2012) describes this period well:
“A sharp increase in Northern Hemisphere temperatures preceded the collapse of [the Minoan] Palatial centers, a sharp decrease occurred during their abandonment. Mediterranean Sea surface temperatures cooled rapidly during the Late Bronze Age, limiting freshwater flux into the atmosphere and thus reducing precipitation over land. These climatic changes could have affected Palatial centers that were dependent upon high levels of agricultural productivity. Declines in agricultural production would have made higher-density populations in Palatial centers unsustainable. The ‘Greek Dark Ages’ that followed occurred during prolonged arid conditions that lasted until the Roman Warm Period.”
Iron Age
This is the time of the Xia Dynasty in China, 4,070 to 3,600 BP. This part of Chinese history is poorly documented, but canals and crop irrigation existed at the time. It is followed by the Shang Dynasty which existed from 3,600 to about 3,050 BP. True Chinese writing began during the Shang Dynasty. It is the first dynasty with a written record. They also had an accurate calendar. The Shang Dynasty utilized bronze extensively. There is some speculation that both volcanism and climate change hurried the end of the Shang Dynasty, but no firm evidence has been found to support this. More likely the final Shang King, who was quite corrupt and very unpopular, was overthrown with the help of the Zhou provincial army.
More seems to have happened on the Indian subcontinent during this period. Little is known about the Indus Valley kingdoms and city-states prior to 3,200 BP. But after this, much happened during the rise of the Kuru Kingdom (3,200 to 2,850 BP), which marked the beginning of the Iron Age in India. Iron artifacts and furnaces in India have been dated to between 3,800 and 3,000 BP. The earliest iron artifacts in the Middle East are some Egyptian iron beads that have been dated to 5,200 BP, but these appear to have been made from an iron meteorite. Actual iron smelting in the Middle East probably did not begin until 4,000 BP, so it probably began there at roughly the same time as in India.
Mayan settlements begin to appear about 4,700 BP in Belize. The first well established Mayan cities (or large settlements) are dated to 3,800 BP in Soconusco, Mexico. This is near the beginning of the cold period in the Iron Age. However, evidence of a true Mayan civilization does not appear until 2,900 BP. The first written Maya history dates to 2,350 BP. This is also the time of the first large scale cities and significant intellectual and artistic development. The rise of the Mayan civilization is roughly the same time as the rise of Rome in the Mediterranean. The Mayan Golden Age was from 1700 BP to 1200 BP. Mayan civilization suddenly collapsed around 1100 BP during a cold and very dry periodin Central America. DeMenocal provides evidence of a 200 year long severe drought between 800 AD and 1000 AD in the Mexican Yucatan Peninsula. The Mayan collapses are a few hundred years out of sync with those in the Mediterranean, suggesting that big climatic changes did not happen at the same time in North America as in the Middle East.
Roman Warm Period
Once we enter the Roman Warm Period, roughly 2,400 BP, robust civilizations have developed in the Americas, around the Mediterranean, China and India. By the time Alexander invaded India (2,326 BP) they had a very advanced civilization. Major cities existed in India before 4,100 BP, but history is not well established until around 2,400 BP. This warm period truly marks the beginning of modern civilization, written records document all major events over most of the world since this time. Writings at this time suggest that temperatures during the Roman Warm Period were comparable to temperatures today.
European Dark Age
Normally the end of the Roman Warm Period is given as around 450 AD (1,550 BP) and the Central Greenland temperature cooled by almost 2°C from 1,500 BP to 1,200 BP, the height of the Dark Ages in Europe. It is interesting that the worst megadrought in the California and Nevada area lasted from 832 AD to 1074 AD, right at the end of the Dark Ages according to a recent study. Desprat, et al, 2003, identifies a very cold period from 450-950 AD.
Medieval Warm Period
The Medieval Warm Period is normally given as 950 AD to 1250 AD or 1050 to 750 BP. In the beginning of this period, temperatures in Central Greenland rose by almost 2°C in a little over 200 years. This has been fairly well documented as a worldwide event. It is uncertain what the global average temperature was during the period and whether the world as a whole was warmer than now. But, certainly in areas where we have records, such as Greenland, the UK, and in China, temperatures were comparable to today and in some cases warmer.
Little Ice Age
The Little Ice Age was not a true ice age, but the cooler period after the end of the Medieval Warm Period. It is generally considered to have started by 1350 AD and it ended by 1850 AD. In Central Greenland, temperatures drop about 1.5°C from 964 BP to 597 BP (1036-1403 AD). It was not cold over the entire period, but the Little Ice Age saw many periods that were very cold, from the famous year without a summer (1816) to the great famine of 1315, New York Harbor completely froze over in 1780, the Norse colonies in Greenland starved and were abandoned in the 1300’s. A recent study notes several droughts in Europe during the Little Ice Age. These occurred in AD 1540, 1590, 1626 and 1719, plus an especially intense drought from 1437-1473 AD. Colder times are the worst times.
Modern Warm Period
The Modern Warm Period starts around 1850 AD, which is also the time when people began systematically recording and collecting surface air temperature data from around the world. These temperatures were spotty in the beginning, but by the middle of the 20th Century a fairly good worldwide temperature database was developing. Finally, in 1979, satellites were launched that could give us a reasonably accurate and complete lower Troposphere temperature record over nearly the entire globe. A discussion of the accuracy of the satellite temperature measurements can be foundhere. In the poster, on the lower right, both datasets are shown. The satellite dataset is from UAH MSU and the surface temperature data shown is from the HADCrut dataset. The satellite temperatures show warming of 0.35°C from 1979 to the present. This is not particularly significant by historical standards.
The period from 1850 to 1979 is not well documented globally and the records used to construct the global surface temperature average have been significantly edited, thus raising doubts about their accuracy. They show a warming of just under 1°C in a period of 165 years. This is not unusual by historical standards. Over this length of time warming of over 13°C was seen at the end of the Younger Dryas in the Central Greenland ice core. In the same core, the beginning of the Holocene Thermal Optimum saw a warming of 5°C in less than 800 years.
Conclusions
Correlation is not causation, but many, if not all, of man’s worst times since the last glacial maximum occur during colder and dryer periods. Often these times were made worse by warfare as in the Greek Dark Ages, the sacking of Rome, the collapse of the Akkadian Empire, etc. The colder and more arid climate could have been part of the cause of the wars. We go to war when we are starving and thirsty. More importantly, I was unable to find evidence of a crisis that was due to warming.
Given that man-made Carbon Dioxide is a very recent phenomenon, the radical climatic changes before 200 years ago cannot be attributed to man’s influence. They must be natural. The recent warming of 0.85°C from 1880 to 2012 is pretty small compared to other temperature changes in the Holocene. It is clear from history that natural forces can cause significant climate changes. It is also clear that droughts are usually associated with colder periods, not warmer periods. Some climate changes are probably due to variations in the Earth’s orbit, but some might be due to variations in TSI (total solar irradiance) or other solar influences. How much is due to nature and how much is due to man is unknown.
Much of the last 18,000 years is characterized by more rapid sea-level rise than we see today. The current rise of sea level is very slow relative to the past and we are arguably more adaptable due to modern technology.
In the words of Professor Steven Mithen (page 507)
“The next century of human-made global warming is predicted to be far less extreme than that which occurred at 9600 BC [11,600 BP]. At the end of the Younger Dryas, mean global temperature had risen by 7°C in fifty years, whereas the predicted rise for the next hundred years is less than 3°C. The end of the last ice age led to a 120 meter increase in sea level, whereas that predicted for the next fifty years is a paltry 32 centimeters at most,…”
We have lots of proof of how warm it was during various warm cycle civilization periods: people went around wearing little clothing especially on the upper half of the body. Including often women! Minoan men wore only a short kilt while the women bared their breasts, for example. During the great civilization periods of ancient Egypt, ditto.
Civilizations always flourish during warm cycles, ‘Dark Ages’ that are uniformly emotionally viewed as cold and nasty were…cold and nasty and the rise of civilizations after various Dark Ages were all during warm, optimistic times. Agriculture which is the force behind all civilizations, is more productive during warm cycles than cold cycles.
Herder/hunters thrive during cold cycles and often destroy and ravage agricultural civilizations, sometimes utterly destroying them (China in particular has been hit by this repeatedly over the last 5,000 years!).
“Earliest evidence of civilization
Gobekli Tepe is near Urfa in southern Turkey.”
My understanding too however, it simply cannot have just appeared IMO. There would be some “root” culture(s) that lead to it. This seems to fit with all other known cultures to date.
In any case…the only thing(s) left in ~5billion years that may have shown a human “culture” on this rock will be the stones we have thrown in to space. The Voyager craft to start with. Eventually, no-one will be here to receive the message.
Gobekli Tepe – Not watched it yet, but the first few minutes look Ok. So it’s in the favorites
“it simply cannot have just appeared” Reminds me of the American Clovis culture (appeared from nowhere around 12,000yrs ago) Anyone that dug deeper and found stuff is/was considered a heretic.
Unfortunately, archaeology, like many other disciplines, advances one funeral at a time. I’ve seen some amazing artifacts from the US that are far less sophisticated and likely much older than the Clovis culture. In overall form they appear very similar to those produced by the Neanderthals in Europe. The establishment archaeologists may call me a heretic, but since when do they dictate reality?
If the strict religious authorities of Islam have their way, will Göbekli Tepe be destroyed in much the same way the Buddhas of Bamiyan had been destroyed by the Taliban in 2001?
“The Gobekli Tepe site is composed of multiple circular stone monuments.”
Why is anyone so sure this was not an observatory that pre-dates Stonehenge?
The pre-Roman Egyptians claimed to have 40,000 years of astronomical observations in their knowledge base. Is it so hard to consider that there were civilisations capable of gathering and communicating extensive histories?
The fact that it w as buried indicates it may have been used as a scientific instrument that should not fall into the hands of invaders.
“The establishment archaeologists may call me a heretic, but since when do they dictate reality?”
It wasn’t that long ago that ‘establishment archaeologists didn’t subscribe to the destructive power of earthquakes
Now how can we make this a must read (questions and answers ) for entry into the city of Paris ???
Wouldn’t such a requirement be a dream come true.
Unfortunately all indications suggest that the current class of “experts” are united only in their complete ignorance of the facts regarding the history of the earth’s climate and the processes involved in documented transitions.
Somebody should visit Paris with a short climate history test and ambush officials with it.
Obviously thought, the majority would refuse to participate.
Since, the majority probably do know that they don’t know anything about climate.
George, I was with you. But on a different page. I thought, this could be used by the powers to be as an entrance exam. Anyone who understands this will be denied entry to the island (Paris)…
Very cool poster. I think I will print a copy and hang it up in the hallway in my department – will be more educational than the usual fare of recycled conference posters.
Excellent poster. Thanks Andy.
Great synopsis of what I have read since 1960. In the last couple of years we found what may be a 13K years old city in 1500′ of water off the west Indian coast.
Very true and exciting! You will find a link to that Indian discovery in the last sentence of the 5.9 Kyr event, look at the link under “9,500 BP”. It is possible that that submerged Indian city is the oldest known.
I’m not sure that I follow the y axis of the second temperature line. It seem to have vertical high peaks indicating the MWP etc, but the vertical scale shows that vertical high is a LOWER temperature…?
Geezer – Realize that those temps are negative values and thus the lower (absolute value) number is a greater temp than the higher (absolute value) number. And it’s Greenland, so it bloody cold! Make sense?
Great post. A good read on a Sunday morning. Lots to think about. Thanks
The problem with pretending that the current observed warming is natural (which I think is what the article purports to) is that you have to a) identify what is causing the variation (like the MWP or LIA) in the absence of human effect, b) explain how it applies today, and c) explain how CO2, which is a known GHG in increasing concentration, can be discounted as the culprit. I’ve never come across someone or a place explaining this in simple terms (a grand alternative theory, if you will). It looks to me like skeptics approach the problem from the vintage point of “what if CO2 is not the issue”, and then try to come up with alternative hypothesis, none of which leading to serious peer-reviewed research.
Warming eras uniformly have CO2 amounts trailing the beginning. It doesn’t cause it to happen, it is an effect of the warming which happens to come from the sun.
The sun’s output isn’t uniform.
The problem is that the sun output does not correlate with recent temperature increase, and you are left with the problem of discounting CO2’s influence, which after all is a known GHG. Increasing it *should* have an effect, either directly on temperature, and/or on something else (clouds, rain fall patterns, etc.). That’s what a reasonable person would expect based on known physics. Also, the warming signature of external forcing is different than that of internal one, and measurements strongly suggest internal forcing.
Dan , you do realize that CO2 is only 0.04 % of the Earth’s atmosphere !! Right ??
Dan:
The ‘known physics’ we know includes the effect of cooling by thunderstorms that punch through the expected (but non-existent) “hot spot”.
CO2 is a contributing factor to the determination of the lapse rate. That is basic physics too. The lapse rate at 280-300 ppm is about 6.5 degrees per km altitude. When it is 650-700 ppm it is 6.8 degrees/km. This correction, based on physics, is not included in the atmospheric computer model outputs that are used as the basis for claiming that the doubling of CO2 will increase global temperatures 1.7-2.8 degrees (depending on who you ask). When calculated correctly, using known physics, the doubling of CO2 will increase global temperatures 0.1 to 0.2 degrees C, a far lower value, because the heating effect is strongly influenced by the lapse rate. As the lapse rate is not fixed, but affected by any change in GHG gas concentration, this correction should be applied to the climate models before claiming there is anything to worry about from a concentration change in CO2. It is as simple and as well-founded in physics as that.
It is therefore interesting to see how this matter has been avoided by the popular press which instead prefers to promulgate scary and alarming children’s fairy tales about CO2 goblins and methane ghosts.
I have to assume you forgot the sarc after your comment. Your 3 “have to’s” are wrong. To demonstrate CO2 not an issue is show there are times when temperatures were higher with CO2 lower than today and possibly the reverse. I do not have to provide an explanation.
It is not “what if CO2. Is not the issue” it is that CO2 IS not the issue and geologic history shows that.
Scientists call CO2 the “control knob”, helping keep temperature in a certain range (with notable failures, such as in snowball earth events). I would agree with what you say IF everything else was equal, such as solar output, earth albedo, orbital position, landmass distribution, etc. But in past eras, these other variables were different, and would have contributed with CO2 in different proportion to keep temperature in whatever range they were then.
Sorry Dan–some scientists WANT to call CO2 the “control knob” but only because they want control of CO2 for nefarious political reasons. “Climate Change” has been called a religion but I prefer to think of it as even less–a propaganda meme that serves the purpose of those intending to do harm to the biosphere by limiting the amount of the “gas of life” we add as humans. Brainwash enough people–laymen or leader–and it becomes a big problem.
Rocky – Thanks for the correction. English is not in fact my first language, though I have lived in the US since 99 – almost the entire duration of the pause ;). I don’t know if that comes across in other ways or not. About the satellite record, I believe it is in fact very heavily manipulated, starting from the fact that is does not directly measure surface temperature (how could it really, from out in space). That does not mean it should be discounted though, just taken “with a grain of salt”.
Dan, satellite data is UNADJUSTED RAW data, unlike the surface records !!! And if you think they are unable to measure temps at the surface you have a lot of learning to do !!!
Dan, there are two, independent, providers of satellite temperature data for the lower troposphere and upper atmosphere : RSS and UAH. There is remarkable agreement between these two data sets, even though the scientists in charge of them sit on opposite sides of the CACC debate. Roy Spencer (UAH) is a skeptic, while Carl Mears (RSS) is not.
Dan….your citation is a problem with pretending that the current warming period is caused by generation of CO2 by humans, when there is no evidence to support that conjecture. To wit, the last 20 years have shown a marked increase in CO2 but temps have remained flat. I will acknowledge that human emittance of CO2 has caused an insignificant amount of overall warming since the end of the LIA.
What you should do is apply the Scientific Method to your CO2 hypothesis and then scrap your hypothesis based on observable data.
The geologic record clearly shows a pattern of cooling periods followed by warming periods – a natural phenomenon.
I don’t dispute than climate change over medium and long periods is natural, and that also applies to shorter periods like the recent (apparent to some) hiatus. Global warming has not stopped, as evidenced by last year’s record temperature, and this year’s even greater spike, not to mention that each decade since the 70’s is warmer than the previous one. The pause (or hiatus) has been the talk of the town recently, but I suggest to take a step back and see what happens in the next few years, lest you may be left eating crows.
Temperatures are going up? According to who?–those who want to exercise political control over you by limiting your consumption of energy?
And how do these people that make outlandish claims justify them in light of the only measurement that’s devoid of human manipulation–the satellite record? Every other data set is suspect, Dan.
By the way, the saying is “left eating crow”, not “crows”. And should the planet continue to warm up, there’s still nothing out of the ordinary about a warming trend that ended the LIA.
Dan,
There is no correlation between increasing CO2 and temperature, except that the oceans give up more CO2 when warmer.
CO2 levels took off after about 1945 and have risen monotonously since then, but until 1977, the world cooled noticeably. That’s why scientists in the 1970s were so worried about a coming new ice age. The planet began warming in the late ’70s because the PDO flipped then. For about the next twenty years, rising CO2 and mildly rising temperature happened to coincide accidentally. Since the late ’90s (earlier in some data sets), temperature has been flat to down. Thus since WWII, rising CO2 has been associated with pronounced cooling for over 30 years, mild warming for less than 20 years and stable to slight cooling for about 20 years.
CO2 is a GHG, but its climatic effect is negligible after the first 200 ppm, except for making the planet greener up to about 1300 ppm.
1oldy,
Come back when you understand. Just because you can copy and paste a graph doesn’t mean you understand what it means.
The planet is still recovering in fits and starts from the Little Ice Age — one of the coldest episodes of the entire 10,000+ year Holocene. As we see here, the current warming step is no different from prior warming steps, which happened when CO2 was much lower:
http://jonova.s3.amazonaws.com/graphs/hadley/Hadley-global-temps-1850-2010-web.jpg
That is from data collected by arch-Warmist Dr. Phil Jones. It disproves what Dan Hue believes.
What we are observing is natural climate variability, nothing more. That is what the data shows. That is how skeptics know that the ‘climate change’ scare is nonsense. And it’s how we separate thinkers from people who start head-nodding when they hear “carbon”.
dbstealey
… And it’s how we separate thinkers from people who start head-nodding when they hear “carbon”.
Hmm…
is this where the term “carbon copy” originated?
/grin
1oldnwise4me@reagan.com
November 29, 2015 at 8:54 am
Rocky, Dan is correct about temperatures going up. Here’s the non-manipulated satellite data:
..
http://www.woodfortrees.org/plot/rss/plot/rss/trend
That is one of the worst example of linear regression I have ever seen passed off as science.
John Who: “is this where the term “carbon copy” originated?”
Probably from carbon paper. Remember that?
/Mr Lynn
1oldwise4me…the problem is that temperature is not, in general, linear as is presumed by your woodfortrees plot. Actually the historic data is rather cyclic, and can better be fitted to some sort of sine-wave like curve. The assumption that all CACC proponents have is that carbon dioxide is the ONLY thing that affects temperatures, and that is patently stupid (given the last 18 years). Clearly, other things affect temperatures: the sun, the oceans, albedo etc. We are almost at the stage when our ( proper) measurements can be used to determine trends. Just need a few more decades 🙂
Dan –
a skeptic does not have to show “a)” since it is clear that the natural variations (in the absence of human effect) did occur. It is up to those who proclaim that “human effects” are causing anything outside of the natural variation to prove their concept. You have it backwards.
The Warmist claim that it was natural from 1850 to 1950 but then, somehow, from 1950 on it is not natural but human caused, is what really requires scrutiny.
The skeptics who are scientists approach is even simpler than you describe. It is: show me the data that supports your assertion so we can process it through the scientific method. Warmists have corrupted that into a whiny “you just want to show that we are wrong” attitude. It is surprising that they don’t have enough faith in their own material to assume that they would actually be shown to be right, isn’t it?
Regarding your “c)”, you should be aware that most what are termed “skeptics” acknowledge that the additional atmospheric CO2 may be contributing somewhat to the atmospheric temperature. However, that contribution is very minor and may not be discernible using modern techniques.
John – It seems to me that all the skeptics arguments eventually devolve into accusation of fraud and malpractice, because the data is there. Even the raw data is not all that different from the adjusted one. No one disputes that CO2 is increasing, so the salient question to me is how could CO2 NOT be a factor in the temperature rise (or lack thereof). IOW, the issue to me is more theoretical than practical (or observational). I don’t see much research on the subject, if any at all.
Extraordinary scientific claims require extraordinary scientific evidence, which Dan has none of !!
Dan Hue says:
…all the skeptics arguments eventually devolve into accusation of fraud and malpractice, because the data is there.
Wrong. The data shows that current observations are no different from past observations, before CO2 emissions began to rise. So the data shows you are wrong.
Furthermore, as John Who tried to explain to you: skeptics have nothing to prove. The onus is entirely on the climate alarmist contingent, to provide solid evidence supporting their conjecture.
But they have failed. They have provided zero credible evidence of any kind showing that current temperatures are outside of normal parameters.
Thus, their “dangerous AGW” scare is debunked. It was a false alarm. Anyone who still believes in that nonsense has a problem with rational thinking.
Dan Hue
November 29, 2015 at 8:16 am
John – It seems to me that all the skeptics arguments eventually devolve into accusation of fraud and malpractice, …”
Dan, it seems to me that you are clueless regarding the actual skeptic position.
” … because the data is there.”
No, it is not.
The data that skeptics are looking for, is data that shows measurably the amount of warming of the atmosphere that Warmists claim human CO2 IS causing.
That data has not been presented.
Keyword there is “IS”, and not the often used “may be”.
@ur momisugly Dan, the warming alarmist have stated via the math that so much warming would occur by adding so much co2. Further, they ruled out everything else. Just by default, no arguments necessary, AGW is a dead theory. The lock step temperature and co2 levels hasn’t happen in 17 years now. Would you like to tell me why? ( and not the ” warmest year on record”, the current warming, if it is warming, is below the lowest modeled projection) .
No you don’t.
No you don’t.
No you don’t.
For your points A + B, all you need to do is recognize that these are natural ongoing processes.
If you wish to assert that these processes have somehow stopped and been replaced by anthropogenic causes, you may do so. In this case you need to provide the proof. In science, the burden of proof is critically important, and well defined. When you make an assertion, or advance a hypothesis, the burden of proof is on you. There is no burden on others to disprove, although that can sometimes be done quite handily.
For your point C: As you know, water vapor is the greenhouse gas of record on this planet, and CO2 is only a bit player. In any event, the radiative IR window is closed, as in slammed shut. As a result, heat transfer from the surface, up through the atmosphere is totally dominated by convection. The addition of any more GHGs does not seem like it should do anything at all.
Some people seem to disagree with me on point C, for some reason. Great! Advance your assertion, provide you evidence. Let The Games Begin.
PRO TIPS:
1) Any hypothesis which is contradicted by prior observation is DOA. Make sure there is no established knowledge which rules out your pet theory.
2) Do not worry about, or make demands, for “peer-reviewed research”. Here at WUWT, we are quite capable of evaluating quite complex data sets and theories. In fact, some of us are quite good at it. As far as publishing in the peer-reviewed literature, we have some of those, too.
TonyL,
Kudos on your concise explanation of scientific skepticism. It is a pleasure to see a climate alarmist so effectively debunked via the Scientific Method.
But Dan Hue will not benefit, I’m afraid. Look at what he says:
About the satellite record, I believe it is in fact very heavily manipulated, starting from the fact that is does not directly measure surface temperature
That ‘belief’ is clearly desperation. Satellite data is the most accurate temperature measurements we have. It does not just measure a few scant locations on land, which itself comprises only 29% of the planet. Rather, satellites measure the entire globe (except for a small area at the Poles).
Since the debate is over global warming, Dan Hue’s fixation on land-only measurements is nothing more than self-serving cherry picking, and his arbitrary rejection of satellite data demonstrates a closed mind ruled by belief.
Skeptics are the only honest kind of scientists. I wonder why Dan is listening to the other kind?
@ur momisugly dbstealey
Thank you, you are most kind.
Yes, I saw what Dan wrote about the satellite record. I wonder where people get that stuff and is it what is taught in the schools. Take heart, WUWT has been responsible for more than a few changes of heart.
I do not know if Dan is a committed alarmist, or just a product of a mis-education. As long as here is here, and engaged, there is hope.
I try to be mindful that WUWT has a *huge* lurker base, and for many, our open science based inquiry is totally new. The approach here is utterly different from the “settled science” propaganda, which is the only side of the debate many people have ever seen. For these people, their first exposure to WUWT must be a very disorientating experience.
All the best.
Maybe Dan and fellow travelers can explain this:
http://jo.nova.s3.amazonaws.com/graph/models/model-trend/graph-model-trend-mid-troposphere-2015.gif
Some accept the burden of proof reversed a.k.a Russell’s teapot.
https://en.wikipedia.org/wiki/Russell's_teapot
As I said above , ” Extraordinary scientific claims require extraordinary scientific evidence, which Dan has none of !! “
Dan, as you point out, there is no generally accepted quantitative theory to account for the MWP, LIA and so on. Therefore, we indeed can’t be certain what fraction of the recent warming (if any) was natural. This point was not lost on the warmists — indeed, it was the rationale for their desire to “get rid of the medieval warm period,” which is documented in the Climategate emails.
To claim that “CO2 is the control knob of the climate” is not supported by the evidence — the ice core records indicate that temperature changes drive changes in CO2, not the other way around.
Dan,
It is odd that you think some delusional hypothesis has to be kept if those who see the hypothesis is failed must come up with a better one before we jettison the failed hypothesis.
The planet’s climate cycles are complex and we are just beginning to see how it works. And the attention to the ridiculous idea that CO2 is “the control knob” has retarded our progress in this area. The fact we have not yet completely nailed down every aspect of what makes the climate tick does not mean your unicorns control the climate. By the way, there are indeed some very good theories on climate that don’t involve “back radiation of CO2” warming the surface.
it looks to me that Alarmists approach the problem assuming that CO2 is the ONLY cause – and DENY alternative hypotheses – producing research that needs to be pal-reviewed to pass muster – and strenuously ensuring contrary research doesn’t
it’s funny that when skeptics have presented hypotheses that match your (a), (b) and (c) – in scientific and in “simple terms” – you obviously didn’t pay attention
-john a eyon
Dan Hue says:
It looks to me like skeptics… try to come up with alternative hypothesis, none of which leading to serious peer-reviewed research.
Dan Hue, you are just beginning to learn. Unfortunately, you’ve gone to climate alarmist blogs and received mis-information. There is plenty of ‘serious, peer-reviewed research’ by skepics of the “dangerous AGW” (DAGW) conjecture. You just don’t see it at the blogs you’ve been visiting. They only show you what they want you to see.
For just one example, there’s the head of M.I.T.’s Atmospheric Sciences department, Prof Richard Lindzen. Dr. Lindzen is the author of twenty dozen peer reviewed papers on the climate. M.I.T. is arguably the premier engineering school in the world, so Dr. Lindzen has more credibility than any alarmist scientist. None of them comes close to Lindzen’s knowledge or output.
For example, Prof Lindzen wrote about the ‘DAGW’ scare:
Future generations will wonder in bemused amazement that the early 21st century’s developed world went into hysterical panic over a globally averaged temperature increase of a few tenths of a degree, and, on the basis of gross exaggerations of highly uncertain computer projections combined into implausible chains of inference, proceeded to contemplate a roll-back of the industrial age.
Lindzen also wrote:
The notion of a static, unchanging climate is foreign to the history of the earth or any other planet with a fluid envelope. The fact that the developed world went into hysterics over changes in global mean temperature anomaly of a few tenths of a degree will astound future generations.
Such hysteria simply represents the scientific illiteracy of much of the public, the susceptibility of the public to the substitution of repetition for truth, and the exploitation of these weaknesses by politicians, environmental promoters, and, after 20 years of media drum beating, many others as well…
Climate is always changing. We have had ice ages, and warmer periods when alligators were found in Spitzbergen. Ice ages have occurred in 100,000 year cycles for the last 700,000 years, and there have been previous periods… warmer than the present, despite CO2 levels being lower than they are now…
For small changes in climate associated with tenths of a degree, there is no need for any external cause. The earth is never exactly in equilibrium. The motions of the massive oceans where heat is moved between deep layers and the surface provides variability on time scales from years to centuries. Recent work (Tsonis et al, 2007), suggests that this variability is enough to account for all climate change since the 19th Century.
(my emphasis)
Further, Lindzen states:
There is ample evidence that the Earth’s temperature as measured at the equator has remained within ± 1°C for more than the past billion years. Those temperatures have not changed over the past century.
Prof. Lindzen puts climate sensitivity of CO2x2 at <1°C. Dr Craig Idso puts the sensitivity number at .37; Dr Miskolzci puts it at 0.00ºC; Dr Spencer puts it at .46; Dr Schwartz puts it at 1.1; Dr Chylek puts it at 1.4. Those climatologists all dispute the DAGW scare.
Finally, the 31,000+ co-signers of the OISM Petition (all of them with degrees in the hard sciences, including more than 9,000 PhD’s) have stated that the rise in CO2 is beneficial to the biosphere, and that there is no evidence that it has caused any harm.
Dan Hue, it is clear that you have been misinformed. If you are willing to visit this award winning “Best Science” site for a few months, you will see the true story.
This site (WUWT) gets more traffic than all the alarmist blogs combined. There is a reson for that: hundreds of climatologists, geologists, physicists, mathematicians, chemists, and many other well educated readers write articles posted here, and contribute in the comments. Those highly educated folks understand the subject, and the arguments, and science in general. Rather than listening to the neo-Nazi cartoonist running the skepticalscience blog, or equally unqualified folks running other alarmist blogs (hotwhopper comes to mind), you can learn real science here.
Best of all, your science-oriented comments will not be deleted, like skeptics’ comments are at many alarmist blogs. That lets readers see both sides of every argument. They can then make up their own minds — and when they do, they usually realize that the “climate change” scare is based on politics, not on science.
1oldy,
Nah. All you did was expose more of your ignorance.
1old,
I’ve read ’em all. They are an indictment of the climate alarmist clique of scientists: your gang of climate charlatans. Prof Lindzen had this to say:
Inevitably in climate science, when data conflicts with models, a small coterie of scientists can be counted upon to modify the data. Thus, Santer, et al. argue that stretching uncertainties in observations and models might marginally eliminate the inconsistency. That the data should always need correcting to agree with models is totally implausible and indicative of a certain corruption within the climate science community.
See, Lindzen was talking about corruption within the alarmist clique of scientists; the ‘small coterie’ outed in the Climategate email dump. But as usual, your projection comes to the fore, and you either wrongly presume that Dr. Lindzen is part of the problem, or you are being deliberately deceptive.
Which?
1oldy,
…false dichotomy”
Nah. In your case it’s one or the other.
dbstealey.
Is it troll season?
I think they are learning to work in pairs.
The folks here of course give them the benefit of the doubt and try to enlighten, but soon turns into a effort of herding cats as they drag people form the subject of the thread to dealing with them.
They come with pre-planned retorts, example:
Dr. Lindzen is the author of twenty dozen pal reviewed papers on the climate.
….
There…I fixed it for you.
The “There…I fixed it for you.” is a phrase widely used here. ” 1oldnwise4me@reagan.com ” using it a pre planned “gotcha” a attempt to mock.
You reply to one, the other drives the knife.
michael
here’s a starting place for studying skeptic sources – http://www.populartechnology.net/2009/10/peer-reviewed-papers-supporting.html
Namely, the IPCC has ruled out any other sources of climate change. I’ve been to few climate change events. In fact, the math from the IPCC is entirely oriented that way. If they have to admit that some other source is responsible, they would have to establish when that source was different, the changes it made, and how the that source is different or the same today. They can’t and they won’t
I’ll give you the simple answer. Levels of co2 during the LIA and MWP were flat. ( notably the hockey stick chart) The math for co2 warming is wrong, I don’t go back any further because these 2 events are both recent and the evidence is pretty overwhelming that it was worldwide. This is serious peer reviewed. The IPCC ignores it. … the IPCC denied this, has had the events and dates altered somewhat to cloud the situation, however since the drilling project confirmed both events ( and many others) there has been no statement. The IPCC also ignores all of the failed predictions it has made. The Antarctic isn’t melting anytime soon, the actual temperature is so far below any of the models if we had stopped producing co2 17 years ago it’s almost laughable, snow didn’t go away, the drought in the midwest ended and a raft of others. One the supports that CAGW holds is that co2 lasts thousand years, that doesn’t look like the case either. There is a lengthy discussion on ppm, the quantity released on another thread here at wattsup.
Read the science here and make up your own mind.
Dan, I think you have the null hypothesis turned around. The Earth has warmed naturally several times in the geologic past, and has warmed more suddenly and reached higher temperatures than in modern times. It’s up to CAGW supporters to explain why any recent warming is unnatural. Why would CO2 suddenly be the all-important control knob when it wasn’t in the past? CO2 has also been higher in the geologic past, so why would it be a problem now? Especially when you consider that according to ice cores, changes in CO2 levels have always lagged changes in temperature, generally by centuries.
Wrong.
Given that the historical and scientific record is clear as to the occurrence of major warm/cool variations in climate prior to significant volumes of man-made CO2 entering the atmosphere, the burden of proof is on those supporting an hypothesis that climate change is not a perfectly natural and continuous phenomenon.
Qui alegat probat.
So far, to any thinking person, CAGW’ers haven’t come close. Thinking of course, does not seem to be something CAGW’ers are strong on. It’s all about making a noise and “activism”.
Empty vessels etc.
For certain co2 doesn’t explain the LIA or the MWP. CAGW has to explain that in light that they claim that all climate change over the ages has been co2. (Go to a climate conference, they will tell you that, it’s co2 and nothing else) That’s why I’m extremely skeptical. The people supporting a theory have prove it’s relevancy.
Dan ,you need to read the link to the recent APS meeting where 3 alarmists discussed climate change with three sceptics (luke warmers). The author mentions that it is difficult from the transcripts to pick out which is which if you’re not familiar with the arguments (that would be yourself). Quite a lot of answers from the alarmists were (paraphrasing) that wasn’t in the models so FIK, especially when the question of why there was warming pre 1940 when emissions were very low and a stasis when it was over ten fold higher.
None of the sceptics denies that anthropogenic CO2 could have contributed to the warming.
I hope that helped you out, Dan.
I like how the temps track CO2 over millions of years. You need to squint to see it. Squint harder. No, you’re not doing it right – stand on your head first and look in the mirror. No, still not right.
Sheesh.
Not enough squinting in the world to see it.
Although, squinter extraordinaire Al Gore did it.
/grin
Actually, he just closed his eyes completely !!! That’s the only way to see it…it’s all in his head !!!! NUTS !!
The point of these plots is to demonstrate that CO2 tracks temperature, not that temperature tracks CO2. This of course depends on what you mean by tracking. I take it to mean “following”.
Except that in that particular plot, over millions of years one would be hard put to see any relationship between the two. CO2, over long periods appears to pretty much have a mind of its own. Now, over shorter periods, say thousands of years, perhaps a relationship can be established, ie. that it follows temperature with a some-800 year lag. I’ve never been quite convinced of that though.
That Wiki inspired graphic of precession is unclear at best.
It is easiest to say that the Earth’s axis precesses like a spinning top, over 25,700 years. This has always been known as the Great Year, and it is easiest to think of it as such. When combined with the Earth’s orbital eccentricity, the Great Year has seasons, just like a normal year. But due to apsidal precession, the Seasonal Great Year is only 21,700 years long, not 25,700. So the Great Summer Season is about 5,400 years long. Quite long enough to melt an Ice Age ice sheet.
And it is a fact that all Interglacials and all the semi-interglacials, are coincident with the Great Summer Season in the northern hemisphere (NH). (And never the southern Great Summer.). This tells us that the increased insolation on the northern ice sheets during the NH Great Summer is the most important driver of Interglacial periods.
However, not all NH Great Summers produce a full Interglacial. Why? Because one other key ingredient is required, and that is dust. It is albedo that provides the feedback that produces a true Interglacial, and so every true interglacial is preceded by a few thousand years of dust storms. And the extra absorption of insolation produced by the lower albedo, is even greater than the extra Great Summer insolation. The result is:
Great Summer increased insolation +90 wm2. (regionally)
Albedo reduction due to dust up to +120 wm2 (regionally)
CO2 increased forcing-feedback +4 wm2
Clearly CO2 plays absolutely NO role in the modulation of Interglacial periods.
https://www.academia.edu/16866736/Albedo_regulation_of_Ice_Ages_with_no_CO2_feedbacks
Ralph
Dust? Really? How does that fit with the regular intervals between the interglacials, i.e, what cosmic clock times the dust storms?
The glacial maxima precede interglacials. These very cold intervals of thousands of years are windy and dry, hence dusty.
>>Dust? Really?
Yes. Dust is an ingeneous and lateral side effect of CO2 concentrations that the warmists have not considered, and would hate and discard if they did.
CO2 concentrations decrease throughout the Ice Age, due to cooling temperatures and plant sequestration. And after about 80,000 years or so it gets to about 190 ppm. And at those levels, any poorly adapted plants, infertile land plants, or high altitude plants begin to die, especially during the summer when CO2 demands are at their highest.
So after about 80,000 years there is a worldwide die off of plantlife, entire continents of barren lands, and therefore worldwide dust storms. And about 10,000 years of dust storms severely reduces the albedo of the northern ice sheets, so when the next NH Great Summer comes along the increased insolation can get a grip on the dulled ice sheets and melt them. And as the last diagram in that article demonstrates, ALL the full Interglacials were preceded by a few thousand years of dust storms.
So yes, CO2 does cause global warming. But only by getting so low in concentration that nearly all the world’s plantlife all dies, and the world is enveloped in dust storms.
Vostok Ice Age record.
Note that CO2 drops to dangerously low levels just prior to an Interglacial.
http://www.brighton73.freeserve.co.uk/gw/paleo/400000yearslarge.gif
Thanks for the explanation, Ralf. Ingenious hypothesis!
… and this hypothesis should presented as a full post on WUWT.
Thanks Ralph! I’ve looked through your paper quickly and it makes a lot of sense. I will study it ASAP.
Quite true about the CO2, but I would disagree on the dust storm hypothesis. Considering that the glaciation of the Antartic 33 million years ago and the Artic 3 million years ago coincides with changes in ocean currents due to continental drift, the answer to glaciations and interglacials most probably lies within the ocean, not the atmosphere.
New thinking has proposed that the cyclical effects of glaciation and glacial retreat upon the Bering Sea, cutting off and reopening the flow of fresher Pacific water into the Artic, is the main engine of the current Quaternary Ice Age cycles. The Quaternary will probably continue as long as that gap exists between Alaska and Siberia.
https://www2.ucar.edu/atmosnews/news/1243/bering-strait-influenced-ice-age-climate-patterns-worldwide
>>I would disagree on the dust storm hypothesis
But it is a fact that each and every Interglacial is preceded by a few thousand years of dust storms. Do you not think these dust storms are a factor? Albedo can provide 30 times as much warming feedback as CO2 over the life of an Interglacial period. And much more than that in the fist few centuries of an Interglacial, when CO2 increases are very small.
So dust has a known and very powerful effect on insolation absorption, especially on bright white ice sheets, and the world is dusty just before it warms. Is the dust not causal?
http://www.richardmckie.net/images/stories/Environment/Vostok_Petit_data.jpg
I have never understood the attraction of the ocean circulation tipping point scenarios.
Let’s assume it cools until some tipping point is crossed, some ocean current reverses, and cooling gives way to warming. OK, I can accept that. However, when this happens, why does the warming go all the way? Why does the current not reverse again once the tipping point is crossed once again on the way up? At this point, things will inevitably get messy.
I started my own exploration of “climate change” with the ice ages — reasoning that an understanding of the natural climate cycles must precede a quantitative understanding of man-made climate change. To my great surprise, I never found any compelling explanation of the interglacials. Sure, the Milankovic cycles are an important part of the picture, but they are clearly not the whole picture.
The dust hypothesis is the first hypothesis to account for the regular occurrence of interglacials that actually makes sense to me, the first one that does not invoke some or other kind of “deus ex machina.” The glacial cycle stabilizes itself, using a simple, robust, straightforward mechanism, with no external driver or computer-amplified butterfly effect required. Ralph, I would really like to congratulate on this accomplishment. You are a real scientist.
>>Ralph, I would really like to congratulate on this
>>accomplishment. You are a real scientist.
Thanks Michael.
This began with a WUWT discussion with Leif Svalgaard, about why the Milankovitch NH Great Summer sometimes triggered a full Interglacial, sometimes a failed Interglacial, and sometimes nothing at all. I said such an anomaly should pique the interest of a scientist, but Leif was disinterested in the finer detail.
It was obvious the Interglacials followed NH Great Summer warming, so this had to be a precessional cycle event. So it was not a 100 k year cycle, as it is often cavalierly claimed, it is an 88 or 110 k year cycle, depending on which Great Summer triggers a full Interglacial. This was the first error in the standard analysis.
The next quest was this: ‘If the Great Summer can increase insolation by 90 wm2 in the high latitudes, then what can overcome such a huge surge in insolation?’ The answer was obviously not going to be puny CO2, with its 4 wm2 leverage. It had to be albedo, which can reflect 80% of the insolation – or up to 290 wm2 during a NH Great Summer. Now that kind of reflection across the whole of the northern latitudes could easily stop an Interglacial in its tracks.
So how can this reflection be reduced, to produce a full Interglacial? Answer – dust and dirt. And the ice core records do indeed record a sudden onset of duststorms just before an Interglacial, which can reduce the albedo and allow greater insolation absorption. But why only dust storms at the very end of an Ice Age? What would trigger them? That took a great deal of grey-matter steam-power to solve. And the answer is that the CO2 concentrations follow temperature down to dangerous levels. No CO2 = no plants = desertification = duststorms.
QED, as they say.
I like it as a theory, as it neatly explains everything. There are no great anomolies, like assuming the wrong periodicity, or not worrying about why some NH Great Summers are missed completely. It literally explains everything, and in a simple, logical manner.
Ralph
Ralph, are you going to have this published? In saner times, this should be Nature or Science material, but in these crazy days you never know. It might be useful to contact Will Happer at Princeton, he is a physicist who is interested in CO2 and a climate sceptic. He also has given advice to other people here at WUWT.
If I can help in any way, let me know. I’m not a climate scientist, but at least I do have some experience with publishing papers in general (you may of course have, too — I simply don’t know what field and job you’re in). You can hunt me down from my website (linked in the comment titles).
>>Ralph, are you going to have this published?
I have sent it to two publications (re-written with abstract and summary) but the answer was ‘it reads like a magazine article, and not as we would like a paper to be written’. Which is hardly surprising, as I write magazine articles. But no mention of whether the theory might be correct or not, just NIH (Not Invented Here).
But you always know when a theory is promising, as academia goes quiet. It is too difficult to refute, so they pretend it does not exist. Or say that you have no qualifications.
Thanks for the Princeton tip, I shall make enquiries.
Ralph
Good luck with the publication, Ralph.
BTW I brought this up at breakfast today. My wife, who is Chinese, mentioned that there have been very bad dust storms in China of late, which have been linked to widespread deforestation. Maybe these storms are linked to arctic ice melt via albedo reduction also. Should you mention that link in your paper, you can be certain that it will be shot down, magazine style or not.
Ralfelli,
I suppose you are aware that there are several theories in the scientific literature that attempt to explain why glacial-interglacial cycles appear to skip one or two obliquity cycles. I am aware of at least other three. Yours is interesting, but only one of several.
I am not so sure about yours, because if I understood correctly, all that dust should create a lot of warming by itself (through albedo reduction) for the theory to work, and the data indicates that when the dust was at its maximum, the temperatures were at their minimum. Hard to see that warming effect that you propose on the data. Given the time scale involved, dust was very elevated for thousands of years during which temperatures were either dropping or not raising.
Anyway, just my two cents. Keep well.
Ralfellis, your paper is the best explanation i have seen for the start and stop of the ice ages. It works very well with the 100Kyear cycle it doesn’t provide a compelling reason for the 41kyear cycle. Your hypothesis rests on the removal of CO2 from the atmosphere. Sequestration of CO2 is done by plants (for decades or hundreds of years) and geology (thousands to millions of years).
If the geological sequestration of CO2 is slow, CO2 levels may not get low enough to cause a plant die back. With Moderate CO2 sequestration plant die back would occur slowly eventually leading to dust storms. This fits the 100Kyear cycle. However is the CO2 sequestration is very fast the ice age cycle could be significantly shortened. leading to the 41Kyear cycle or even a 25Kyear cycle.
If the geological sequestration of CO2 affects the ice age cycle then something must have occured to cause to trigger them. My guess is the Tabeten plateau and Hemilyian mountains. Multiple lines of evidence suggest the mountain and plataeu uplift may have accelerated about 7 million years ago. Before that there is no evidence of an ice age cycle. However when the ice ages started they were at 41Kyear cycle consistent with major erosion and rapid CO2 sequestration. However as things stabilized and the ice age cycle shifted to a 100Kyear cycle.
http://www.geo.cornell.edu/geology/research/derry/himalaya.html
http://www.whoi.edu/pclift/BengalSummary.pdf
If the major science periodicals don’t want to publish your article you might want to consider Scientific American, Discover, or national geographic. They might be more interested and publication in one of them might get the major science periodicals interested. I also think WUWT should post an article about this.
There is an undeniable similarity between Golbekli Tepi and Stonehenge, and they may be of the same era. The conventional dating of Stonehenge comes from intrusive burials around the site. But site litter and intrusive burials are more likely to mark the end of the life if Stonehenge as a sacred temple, not its construction date. And the oldest carbon dating on the Stonehenge site actually goes back to 8,000 BC, or about the same era as Golbekli Tepi.
Archaeologists need to look again at the large assumptions they have made, when dating these constructions. A skeleton at the bottom of Avebury Henge, for instance, would not mark its construction. No true priest would allow an unclean burial on a sacred site, and the great dearth of burials within these larger henges indicate that these ancient priests conformed to this general rule. So what, then, are the true ages of sites like Stonehenge? It would be nice to have a reassessment of the data.
Wow and thank you for all this work. Great job.
What a great summary! Easy to read, great links and a poster to boot. A must read for all those Chicken Little’s out there.
Thank you Andy.
Dan, I don’t think it’s a question of “pretending”. Since it is impossible to do a controlled experiment on planet earth (one where CO2 is varied and the other where CO2 is held constant to determine the effects of changing CO2 concentrations on temperature) the proposition that anthropogenic CO2 is causing and will continue to cause a temperature rise is merely a conjecture, since it cannot be verified by experiment. I know that CO2 is a greenhouse gas. The question is this: what are the feedbacks associated with a rise in CO2 levels? Are they net negative or positive? The models have been calibrated on the assumption that CO2 is a net driver. The models use parameterization to “force” a fit because the Ahrraneus equation isn’t sufficient on its own to explain the temperature rise. This is not science, Give me any number of data points on a graph and I’ll derive an equation to fit those points. Mike Jonas, a mathematician, has a 4 part article on this site entitled “The Mathematics of carbon dioxide”. He used the equations employed in the GCMs and attempted to forecast the present hiatus with them. The equations can’t forecast. He also showed that they can’t hindcast. This is not surprising, since the IPCC itself admits that climate, like the weather, is essentially chaotic and is not amenable to forecasting. I don’t know the true answer. The temperature rise is caused by a combination of factors, possibly including anthropogenic CO2. What I dislike is the hubris displayed by those who “know” the truth, and their arrogant dismissal of any contrary view.
No, it’s a timeline of human history compared to a fantasy of a global temperature.
What’s wrong with the ice core records?
“What’s wrong with the ice core records?”
I’m sure they’re fine as local proxies, but that’s about it, even though we’re rarely presented with error bars. But you can’t extend a local “measurement” anywhere outside that locality. And you can’t average proxies together, nor with measured temperatures from all over the place. Intensive properties don’t work that way. There is no global temperature.
Because it disproves your preconceptions?
Thanks, Andy May, This is a very good article. It helps putting current-day events in a long-term historical perspective.
And, yes, cold kills, watch that Arctic!
As I like to say “A warm planet is a happy planet”. It drives the Warmistas nuts 🙂
At a nearby car wash there is a large sign that reads, “a happy car is a clean car”.
I’ve been trying to cheer my car up, in the hope that it will thereby become clean.
It’s not working. What am I getting wrong?
Andy May,
I’m afraid I stopped reading immediately after opening two links.
Maybe compare your LGM here: http://www.lakepowell.net/sciencecenter/paleoclimate.htm
with the modern idea of the LGM here: https://epic.awi.de/9052/1/Hub2004a.pdf Fig1, page 1335
Look in North-central Siberia, where your link puts miles of ice on Siberia, there was none. Instead the mammoths were thriving there (page 1339, fig 6)
Really the paleoclimate was totally different.
Andre, you do realize that by continuously turning left , you are simply going around in circles ????
Thanks for the link, I had not seen that paper before. It looks like my map has the ice going too far east.
@Leftturn….Not much if any difference between your link and the depicted ice sheet coverage that Andy has provided, both show little to no ice accumulation in ‘Siberia’ (a very large geographic area). From your now 12 year old (modern view?) Siberian GCM ice sheet article, their model still places roughly 2,500 feet of ice in northern/eastern Siberia, same as the depiction that Andy has provided in his figure 1. Both show little to no ice accumulation in central eastern to far eastern Siberia. You actually choose a non existent ‘issue’ to ‘claim’ a difference of an opinion….
Precisely, and luckily for us, we’re not the ones claiming “consensus” and “settled science”.
“This means that in the Northern Hemisphere we currently receive 6.5% more solar radiation (88 Watts/m2) in the middle of winter than we do in the summer.” So when the NH is at a greater incline it gets more?
Is the 17×22 inch poster available anywhere for sale?
No, but if you take the pdf to any print shop (like Kinkos) they should be able to print it for you on either ANSI C paper (17×22) or ANSI E (34×44). for a reasonable price. Or maybe a friend has a large scale plotter at work? I print on an HP Designjet at work. Just copy the pdf to a thumb drive.
Thanks!
$39.99 at FedEx Office:
http://www.fedex.com/us/office/poster-printing.html
The Cosquer Cave in France remains one of the most interesting pieces of evidence of true and alarming climate change and the resulting human experience. Nobody alive today has ever experienced the likes of it, and we will all go to our graves without ever having experienced the likes of it. Thank God nobody did anything about it 25,000 years ago. We learn nothing from history.
“The onset of this drought [1177 BC] coincides with a sudden and extended cooling period in the Central Greenland ice core data. In general, most large scale droughts in the last 18,000 years appear to be associated with cooling in the Arctic. This drought and cold period marks the end of the Minoan Warm Period.”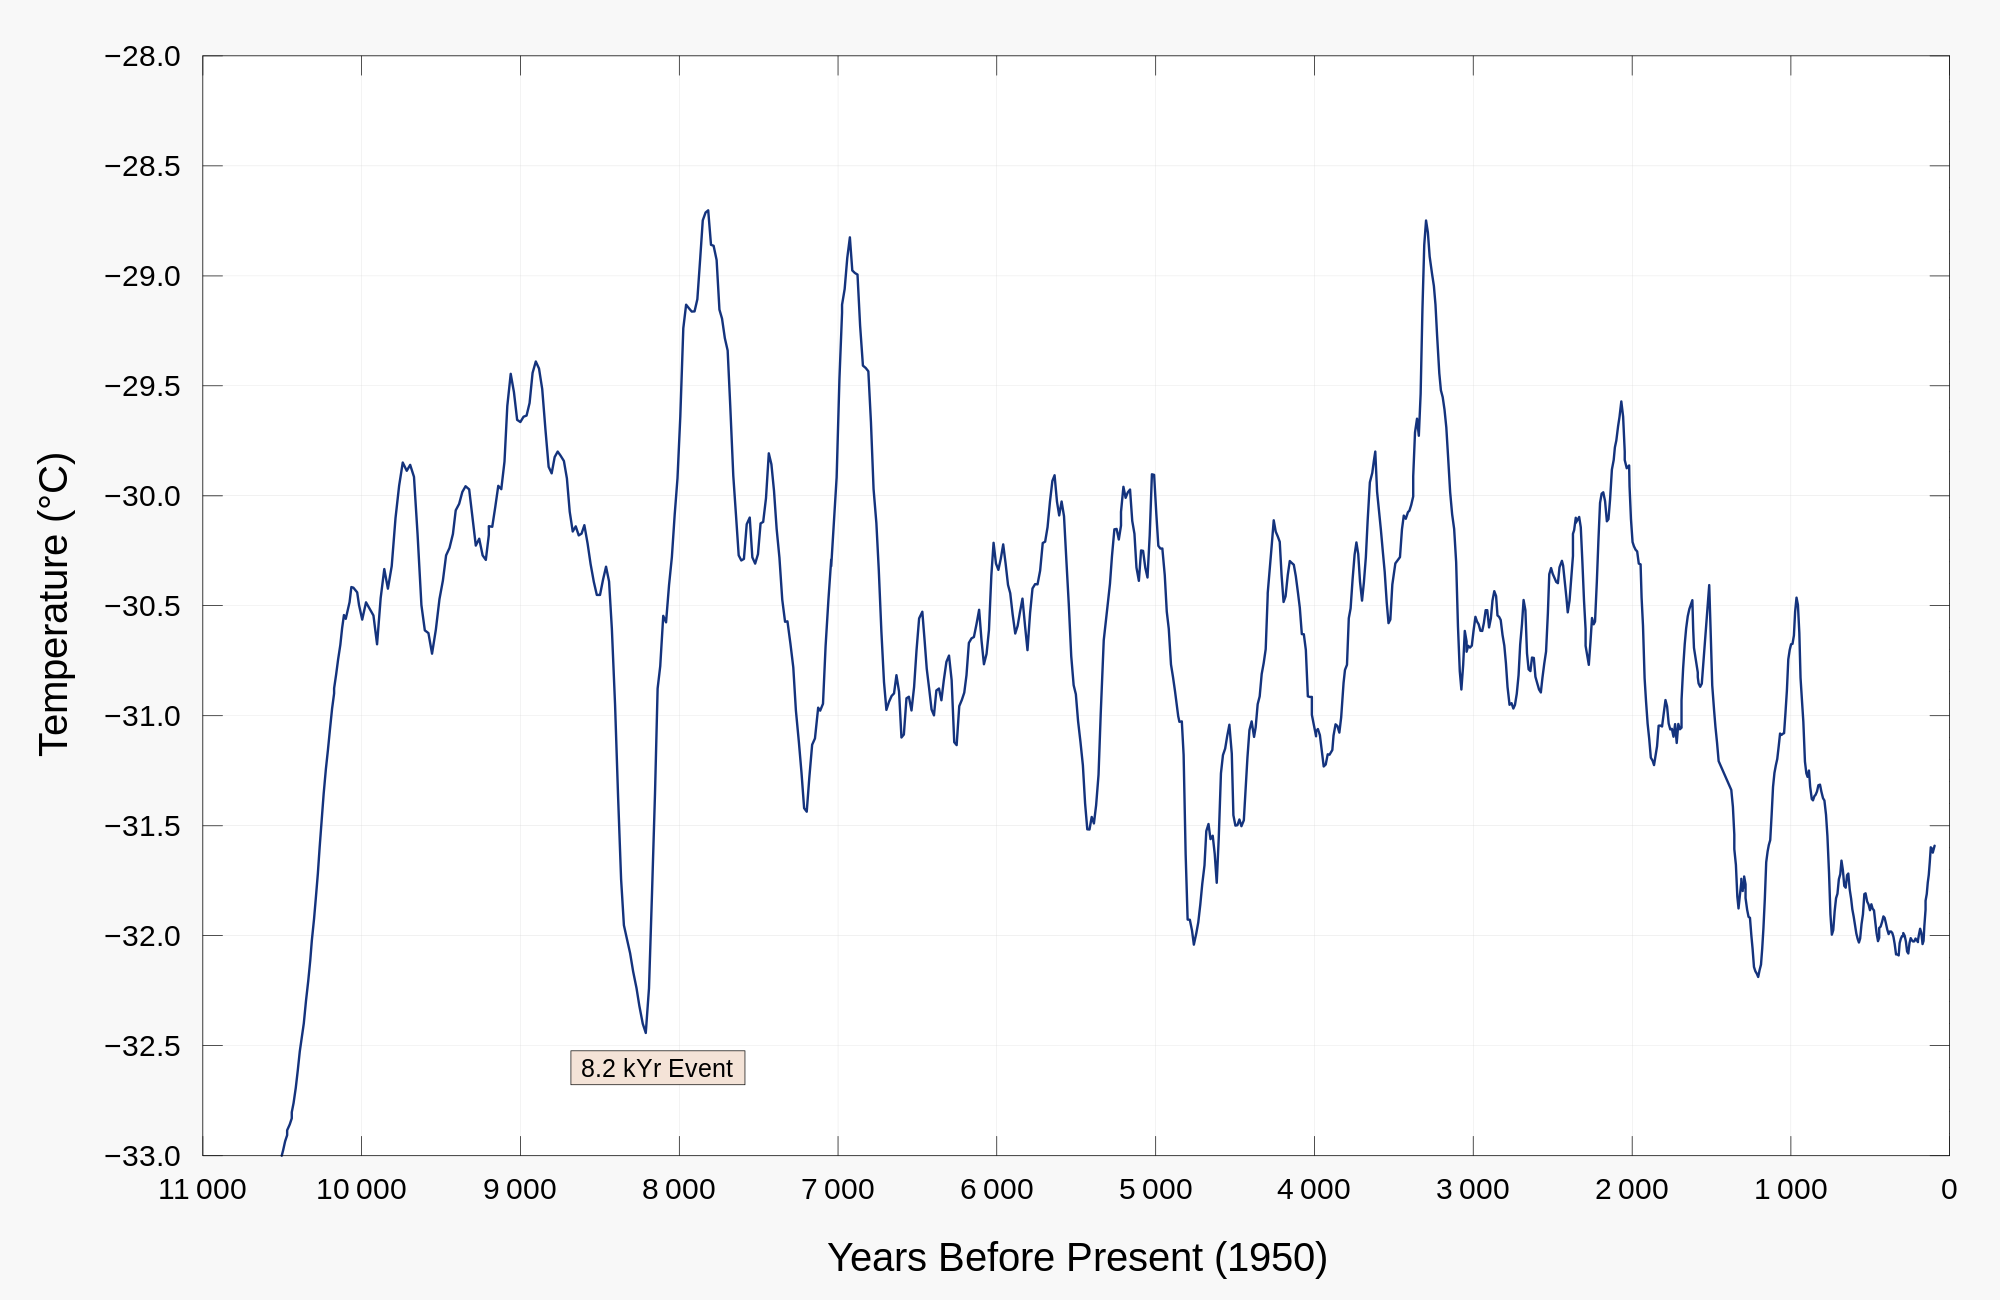
I would suggest that is still within the ~1350-1150 BC warm period in Greenland, which was likely a triplet of solar minima. The cold event in the mid latitudes around 2200 BC was also during a warmer period in Greenland.
“Normally the end of the Roman Warm Period is given as around 450 AD (1,550 BP) and the Central Greenland temperature cooled by almost 2°C from 1,500 BP to 1,200 BP, the height of the Dark Ages in Europe.”
The Roman Warm Period was largely in the first four centuries AD, where there is downturn in Greenland temperatures, and the cold Dark Ages period of roughly 380-540 AD is during a warmer period in Greenland. In the 8th century when Europe was warmer than now, Greenland was at its second coldest for the Holocene.
2700-2500 BC would be better known as the Minoan warm period, along with all the other cultures that flourished globally then, during another cold period in Greenland.
King Tut’s father began the worship of Ra to the exclusion of other deities of the day, I’ve read. It seems to me that this followed a cold period which might have been the inspiration of worshiping the sun. They might have thought that praying to Ra – the sun, might have made the deity more powerful. Then, perhaps later, as things began to get too hot, they might have decided that it was time that some of the other gods reigned in the heat? Ahkenaten’s reign ended around 1350 BC. Above, the chart says that 3300 years ago was severe drought and war in the Middle East. Just wondering if you think there might be a connection.
>>King Tut’s father began the worship of Ra to the
>>exclusion of other deities of the day, I’ve read.
If you mean Pharaoh Akhenaton, then his monotheistic solar deity was known as Aton or Adon, not Ra. The Israelites appropriated this deity, which is why the monotheistic god of the Torah is often called Adon (as well as Yahweh).
As an aside, it is highly unlikely that Tut was the son of Akhenaton, because Akhenaton never aknowledged a son. And there is no way a pharaoh would forget to mention his only son and heir, while continually acknowledging his six daughters. It is much more likely that Tut was the son of Pharaoh Aye. But since Aye was probably the uncle of Akhenaton and the father of Nefertiti, and the entire family practiced incest, their genotype and phenotype are likely to have been rather similar.
Ralph
Thanks Andy for a very interesting article, I would imagine the graph will not be the highlight at the Paris conference
They don’t need to trouble themselves with facts or information about the climate.
They’ve all watched “Inconvenient Truth” and now they’re all experts.
On top of which, the process of committing to the spending of trillions of dollars of other people’s money is very complicated and time consuming.
The experts in Paris have no time for potentially career ruining “climat investigation”.
They need to “act now” according to the “leap before you look principle”.