From the “settled science” department and former chief alarmist Jay Zwally, who for years had said the Arctic was in big trouble (only to have his prediction falsified), comes this Emily Litella moment in climate science: “Never mind!”. Curiously, WUWT reported back in 2012 about an ICEsat study by Zwally that said: ICESAT Data Shows Mass Gains of the Antarctic Ice Sheet Exceed Losses. I surmise that with the publication of this second study, the original is now confirmed. I suppose John Cook will have to revise his “Denial 101” video on Antarctica now.

From the NASA/GODDARD SPACE FLIGHT CENTER via press release:
NASA study: Mass gains of Antarctic Ice Sheet greater than losses
The research challenges the conclusions of other studies, including the Intergovernmental Panel on Climate Change’s (IPCC) 2013 report, which says that Antarctica is overall losing land ice.
According to the new analysis of satellite data, the Antarctic ice sheet showed a net gain of 112 billion tons of ice a year from 1992 to 2001. That net gain slowed to 82 billion tons of ice per year between 2003 and 2008.
“We’re essentially in agreement with other studies that show an increase in ice discharge in the Antarctic Peninsula and the Thwaites and Pine Island region of West Antarctica,” said Jay Zwally, a glaciologist with NASA Goddard Space Flight Center in Greenbelt, Maryland, and lead author of the study, which was published on Oct. 30 in the Journal of Glaciology. “Our main disagreement is for East Antarctica and the interior of West Antarctica – there, we see an ice gain that exceeds the losses in the other areas.” Zwally added that his team “measured small height changes over large areas, as well as the large changes observed over smaller areas.”
Scientists calculate how much the ice sheet is growing or shrinking from the changes in surface height that are measured by the satellite altimeters. In locations where the amount of new snowfall accumulating on an ice sheet is not equal to the ice flow downward and outward to the ocean, the surface height changes and the ice-sheet mass grows or shrinks.
But it might only take a few decades for Antarctica’s growth to reverse, according to Zwally.
“If the losses of the Antarctic Peninsula and parts of West Antarctica continue to increase at the same rate they’ve been increasing for the last two decades, the losses will catch up with the long-term gain in East Antarctica in 20 or 30 years — I don’t think there will be enough snowfall increase to offset these losses.”
The study analyzed changes in the surface height of the Antarctic ice sheet measured by radar altimeters on two European Space Agency European Remote Sensing (ERS) satellites, spanning from 1992 to 2001, and by the laser altimeter on NASA’s Ice, Cloud, and land Elevation Satellite (ICESat) from 2003 to 2008.
Zwally said that while other scientists have assumed that the gains in elevation seen in East Antarctica are due to recent increases in snow accumulation, his team used meteorological data beginning in 1979 to show that the snowfall in East Antarctica actually decreased by 11 billion tons per year during both the ERS and ICESat periods. They also used information on snow accumulation for tens of thousands of years, derived by other scientists from ice cores, to conclude that East Antarctica has been thickening for a very long time.
“At the end of the last Ice Age, the air became warmer and carried more moisture across the continent, doubling the amount of snow dropped on the ice sheet,” Zwally said.
The extra snowfall that began 10,000 years ago has been slowly accumulating on the ice sheet and compacting into solid ice over millennia, thickening the ice in East Antarctica and the interior of West Antarctica by an average of 0.7 inches (1.7 centimeters) per year. This small thickening, sustained over thousands of years and spread over the vast expanse of these sectors of Antarctica, corresponds to a very large gain of ice – enough to outweigh the losses from fast-flowing glaciers in other parts of the continent and reduce global sea level rise.
Zwally’s team calculated that the mass gain from the thickening of East Antarctica remained steady from 1992 to 2008 at 200 billion tons per year, while the ice losses from the coastal regions of West Antarctica and the Antarctic Peninsula increased by 65 billion tons per year.
“The good news is that Antarctica is not currently contributing to sea level rise, but is taking 0.23 millimeters per year away,” Zwally said. “But this is also bad news. If the 0.27 millimeters per year of sea level rise attributed to Antarctica in the IPCC report is not really coming from Antarctica, there must be some other contribution to sea level rise that is not accounted for.”
“The new study highlights the difficulties of measuring the small changes in ice height happening in East Antarctica,” said Ben Smith, a glaciologist with the University of Washington in Seattle who was not involved in Zwally’s study.
“Doing altimetry accurately for very large areas is extraordinarily difficult, and there are measurements of snow accumulation that need to be done independently to understand what’s happening in these places,” Smith said.
To help accurately measure changes in Antarctica, NASA is developing the successor to the ICESat mission, ICESat-2, which is scheduled to launch in 2018. “ICESat-2 will measure changes in the ice sheet within the thickness of a No. 2 pencil,” said Tom Neumann, a glaciologist at Goddard and deputy project scientist for ICESat-2. “It will contribute to solving the problem of Antarctica’s mass balance by providing a long-term record of elevation changes.”
###
Source: http://www.nasa.gov/feature/goddard/nasa-study-mass-gains-of-antarctic-ice-sheet-greater-than-losses/
In a piece at Nature News, Zwally has said:
“Parts of Antarctica are losing mass faster than before,” says Jay Zwally, a glaciologist at NASA’s Goddard Space Flight Center in Greenbelt, Maryland, and lead author of a paper to appear in theJournal of Glaciology1. “But large parts have been gaining mass, and they’ve been doing that for a very long time.”
The findings do not mean that Antarctica is not in trouble, Zwally notes.
“I know some of the climate deniers will jump on this, and say this means we don’t have to worry as much as some people have been making out,” he says. “It should not take away from the concern about climate warming.” As global temperatures rise, Antarctica is expected to contribute more to sea-level rise, though when exactly that effect will kick in, and to what extent, remains unclear.
Gee, thanks.
The study:
Mass gains of the Antarctic ice sheet exceed losses
Source: Journal of Glaciology doi: 10.3189/2015JoG15J071
Abstract:
Mass changes of the Antarctic ice sheet impact sea-level rise as climate changes, but recent rates have been uncertain. Ice, Cloud and land Elevation Satellite (ICESat) data (2003–08) show mass gains from snow accumulation exceeded discharge losses by 82 ± 25 Gt a–1, reducing global sea-level rise by 0.23 mm a–1. European Remote-sensing Satellite (ERS) data (1992–2001) give a similar gain of 112 ± 61 Gt a–1. Gains of 136 Gt a–1 in East Antarctica (EA) and 72 Gt a–1 in four drainage systems (WA2) in West Antarctic (WA) exceed losses of 97 Gt a–1 from three coastal drainage systems (WA1) and 29 Gt a–1 from the Antarctic Peninsula (AP). EA dynamic thickening of 147 Gt a–1 is a continuing response to increased accumulation (>50%) since the early Holocene. Recent accumulation loss of 11 Gt a–1 in EA indicates thickening is not from contemporaneous snowfall increases. Similarly, the WA2 gain is mainly (60 Gt a–1) dynamic thickening. In WA1 and the AP, increased losses of 66 ± 16 Gt a–1 from increased dynamic thinning from accelerating glaciers are 50% offset by greater WA snowfall. The decadal increase in dynamic thinning in WA1 and the AP is approximately one-third of the long-term dynamic thickening in EA and WA2, which should buffer additional dynamic thinning for decades.
Full study: OPEN SOURCE
zwally-antarctica-study (PDF)
It deserves acknowledgement that growing Antarctic land ice was actually forecast by the IPCC.
The reason it deserves acknowledgement is that I have previously pointed out the opposite. That the claimed shrinkage was the opposite of what they’d forecast.
Now all they need to do is explain the causes of the earlier errors, and put the numbers to the forecast and reality, and account for discrepancies, and they will have achieved the very first ever accurate ‘Global Warming’ forecast. (Provided the numbers match up, of course.)
Well, duh, Antarctica has been slightly cooling and the sea ice increasing. So, would one think the land-ice has been increasing or decreasing?
“The good news is that Antarctica is not currently contributing to sea level rise, but is taking 0.23 millimeters per year away,” Zwally said. “But this is also bad news. If the 0.27 millimeters per year of sea level rise attributed to Antarctica in the IPCC report is not really coming from Antarctica, there must be some other contribution to sea level rise that is not accounted for.”
Or maybe, just maybe the IPCC report is wrong about sea level rise?
Or, maybe, gasp, the science is not settled.
Naw. All those smart guys can’t be wrong.
Harry,
The problem with your analogy is that Zwally has actual numbers to make his prediction. From his conclusion, “If dynamic thinning continues to increase at the same rate of 4 Gt a–2 with no offset from further increases in snowfall, the positive balance of the AIS will decrease from the recent 82 Gt a–1 to zero in ~20 years.”
In other words, the glacier is gaining mass rather than loosing mass. And they have difficulties (ten years of work!) in measuring the change to know even if the sign is positive or negative.
This is of course alarming, since we’re busted if glaciers grow. It’s the delicate balance of Nature again.
Luke:
You say in total
The problem with your quotation is that it is selective.
Zwally is also reported to have said
Your quote gives an “If … ” statement that provides quantification and dates.
My quote says the effect is “expected” but “when exactly that effect will kick in, and to what extent, remains unclear”.
Simply, Zwally is NOT using “actual numbers to make his prediction” which is pure pseudoscience. And you knew this because I explained it to you in this thread here and davidmhoffer explained it to you in this thread here.
Richard
Richard states “Zwally is NOT using “actual numbers to make his prediction”
He certainly did in his paper. Go take a look.
Luke:
You refuse to understand the explanations of your error provided by me and davidmhoffer so please read the explanations of your error provided by harry here and here.
Richard
No, he uses one set of numbers and then assumes no increase in the other. Assumption isn’t data.
As I point out, the two physical phenomena are not related. Assume all of West Antarctica (my wallet) melts, clearly as the rest of Antarctica continues to add snowfall the balance returns to positive. West Antarctica acceleration has zero affect on the rest of Antarctica (my bank balance).
Since we are talking of a physical system, clearly West Antarctica is limited in terms of how much it can accelerate, since at some stage the amount of ice available to melt reduces so much it can’t accelerate.
Luke says:
…Zwally has actual numbers to make his prediction.
And so what? It’s the prediction that matters here, not the numbers.
I predict Zwally will be wrong about the word “If” in his conclusion.
What’s your prediction?
(Fake screen name of banned commenter. ~mod.)
Just last year someone smelt a rat in Antarctica.
Greenland………………….seeing is believing OR don’t believe your own lying eyes.
Greenland Ice Sheet Surface Mass Budget: DMI
http://beta.dmi.dk/en/groenland/maalinger/greenland-ice-sheet-surface-mass-budget/
http://beta.dmi.dk/uploads/tx_dmidatastore/webservice/b/m/s/d/e/accumulatedsmb.png
Does he get paid for a copy and paste (Weekend Rebel Science Excursion – 52)?
Another “hiatus”. Woohoo!
http://4.bp.blogspot.com/-ikXzCCe1bNc/U9h19XT0smI/AAAAAAAAN90/3BaMbOGCItM/s1600/NASA-s.png
Barry:
Please explain what if any relevance your post has to the subject of this thread which is finding of Zwally that Antarctic ice is increasing.
Richard
Please show the tide gauges that confirm this chart by direct measurements.
Oh, wait…you cannot, because there are no such confirmatory measurements.
In other words, that chart is made up hooey-bunkum malarkey-drivel.
But it does imply scientific authority…
Fact or fiction is not of import, only the campaign to keep the public believing in the authority of government paid scientists and their climate clairvoyance.
Calm down Barry:
http://www.globalwarmingart.com/images/1/1d/Post-Glacial_Sea_Level.png
It does make you wonder what methane hydrates were doing along this sea level rise curve. They could act as a magnifier in the warming cycle and then get relatively used up to help form a top.
Can you tell me when sea level began to rise over the last 25,000 years?
Deceleration in the rate of world sea level rise.
http://www.jcronline.org/doi/abs/10.2112/JCOASTRES-D-10-00157.1
http://www.sciencedirect.com/science/article/pii/S0921818113002397
—
http://www.ncdc.noaa.gov/paleo/pubs/ipcc2007/fig68.jpg
What is with the “climate denier” stupidity with these subhuman lifeforms? Can some one point out who these actual “climate deniers” are?
Oh and by the way I forgot to mention climate always changes!
Well, there is that.
Plus, there is not any one single climate on the Earth, and the climate zones delineated over a hundred years ago remain unchanged.
Have you never heard the expression “less is more”?
More or less.
I find NASA’s timing of this data dump of growing Antarctic land ice very interesting as it comes one week after NASA refused Congress’ request for data on the hiatus-busting and highly controversial Karl2015 paper and just weeks before the Paris Left-FEST.
I think NASA is getting ahead of the curve to avoid another scandal prior to the Paris Left-Fest by announcing Antarctic’s growing land ice now, as it would make much sense tactically to announce this after Paris…
Something very strange is happening…
S
I agree. It’s orchestrated theatre.
Red meat for the skeptics to feast.
Faux moral high ground for the warmist.
Since it’s actually nonconforming data and potentially a bombshell to one of the pillars, it behooves them to “take the wind out of the sail” by releasing it first in some non MSM matter. CAGW is a multipronged weight of evidence narrative. At this point pre Paris, WUWT and Nova would do well to produce the top ten things that haven’t happenned concerning CAGW claims. MSM likes top tens. It’s easily consumable and pass up the line.
They run like a military propaganda campaign.
Skeptics should be as organized and anticipate instead of being in reaction mode.
Thanks WATTSUPWITHTHAT for the coverage of this new science. Re “chief alarmist’s” previous “prediction falsified”, I say not really. My quote in 2007 was “At this rate, the Arctic Ocean could be nearly ice-free at the end of the summer by 2012, much sooner than previous predictions.” What actually happened is that at the end of summer 2012, the ice volume was down to 25% of what it was in the 1980’s (about 50% decrease in thickness and 50% decrease in area), which is a serious reduction with yearly ups and downs on a downward trend.
Jay Zwally,
In other words, you were wrong.
Every scary prediction by the alarmist crowd has been wrong. So I have a question:
At what point will you admit that your ‘dangerous AGW’ (DAGW) conjecture is wrong?
Or, can you never admit what most folks can clearly see? There is no DAGW. It is a baseless scare, which has now morphed into the silly arm-waving over “ice”.
Polar ice fluctuates. Naturally. Deal with it.
DB
The current strategic advantage of the skeptic is that many of the pillars in the weight of evidence approach are weakening.
The disadvantage is that the unorganized approach of the skeptic don’t allow them to anticipate in the attack. They are unfortunately mostly left to reacting.
The solution is to compile an easy top ten and publish it via the various media options, blogs, video (sunny eg), twitter, representative webpages.
In this way you steal a play from the warmists playbook.
Thinking out loud as I’ve watched the approach to Paris.
There’s a huge difference between nearly ice free and a a reduction of 25%. That’s probably an error nearly 400 %. And a very alarmist prediction. What was the purpose of that statement you made in 2007. Statements like that show that the alarmists views can not be trusted. If their statements can’t be trusted…can their work be trusted?
I’m a professional engineer…..if I made statements like that in report…and they were proven false Or ridiculous I woulld stand a high chance of losing my engineering license….
“the ice volume was down to 25% of what it was in the 1980’s” means a 75% reduction not “a reduction of 25%”. It’s scary that a professional engineer does know the difference!
Was it really necessary to spam this post twice?
2012–Glory days.
Ice hits record low (for the immensely long period of satellite coverage) due mainly to a storm in August blowing ice out of the Arctic.
What’s happened to ice coverage since 2012 or doesn’t that count?
Dear Jay Zwally, You seem to claim that volume measurements somehow let you off the hook for your falsified area predictions. There is no shame in admitting your prediction was wrong. Not sure why this is so hard to accept. Pretending otherwise is far worse for your credibility than just being honest with yourself. Just my unsolicited advice.
Knute
You just volunteered, You write pretty good. Put together a top 10 and submit it to Anthony.
Thanks Knute : )
D
Thanks, but I’m a pebble compared to the boulders at this webpage. I know a few toppers, but they come at me from reading here and elsewhere. Perhaps a more on top of the facts poster like DB, Harmon, Ball, Frog or others can weigh in or maybe by all posters contributing in a group write.
Graphs, cites, pictures … those are all at the tips of some folks fingers, but not mine.
1. There has been NO appreciable warming in 18 years and the IPCC models failed to predict this despite increases in atmospheric CO2.
2. The Antarctic/Arctic ice gains/losses balance each other out.
3. There has been no appreciable sea level rise.
4. Polar bear pops are indeed stable.
5. Where 97% came from and why it’s BS.
My pressing suggestion is realize that in order for other people to HEAR a fact, you first have to realize it has to get thru an emotional bias.
Imagine being a kind Uncle explaining to his puppy dog in love nephew that indeed Jane is good at seduction, but not because she only has eyes for him. The awakening needs to be his. The Uncle plants the seed.
I agree that there was more ice at the end of the cold phase of the approximate 64 year oceanic cycle. Was there 4 times as much ice in 1946? Was there more during the “Golden Age” of Arctic Exploration? Read up because the evidence is compelling that you are, in effect and regardless of your intent, cherry-picking your comparison date.
I don’t know what you think but you ARE not being quite perfectly straight with the start date. Satellites or no we DO know there had been less ice earlier in history. Your implication appears to be that “we” melted the ice with GHGs but history shows Nature had melted it without our help before the freeze-up of the 70s.
Yada, yada 1980’s.When we have satellite data from the early to late 1970’s (pre-1978, that magical year), and even data from the 1960’s.
If you are the real Jay Zwally you would be aware of what nearly ‘ice-free’ means. An ‘ice-free’ Arctic is extent of 1 million km2 or less, as it is very difficult to melt the thick multi-year ice in the Canadian Archipelago. You or your name-sake are still wrong.
List of Arctic ‘ice free’ failed predictions.
This has pretty large implications. First…sea level rise water gains have been based on Antarctica. Satellites show that 3.2-3.4 mm/yr rise. A large portion of this is coming from Antarctica. So if this now is a negative impact…..where’s the rise coming from. Some studies show that SLR is only about 1 mm/ yr……this seems more reasonable with this new paper. Second the grace satellites analysis showed an increase of 106 gt/yr in Antarctica. Is the grace analysis so flawed that it can’t be trusted for mass gains anywhere?
Sorry loss of 106 gt/yr
Antarctica is a continent surrounded by ocean, with a dominant circumpolar current.
The arctic region is an ocean surrounded by continents with two currents carrying warm water into the region and no circumpolar current to block that mixing.
The impression that the alarmists have made on the world is that both poles behave in the same fashion and the ‘hockey stick’ was reflective of both hemispheres.
Perhaps it’s the biggest misconception next to the gross exaggeration of CO2’s temperature forcing abilities that the general public has been programmed with.
This is today’s Arctic ice extent, versus past years: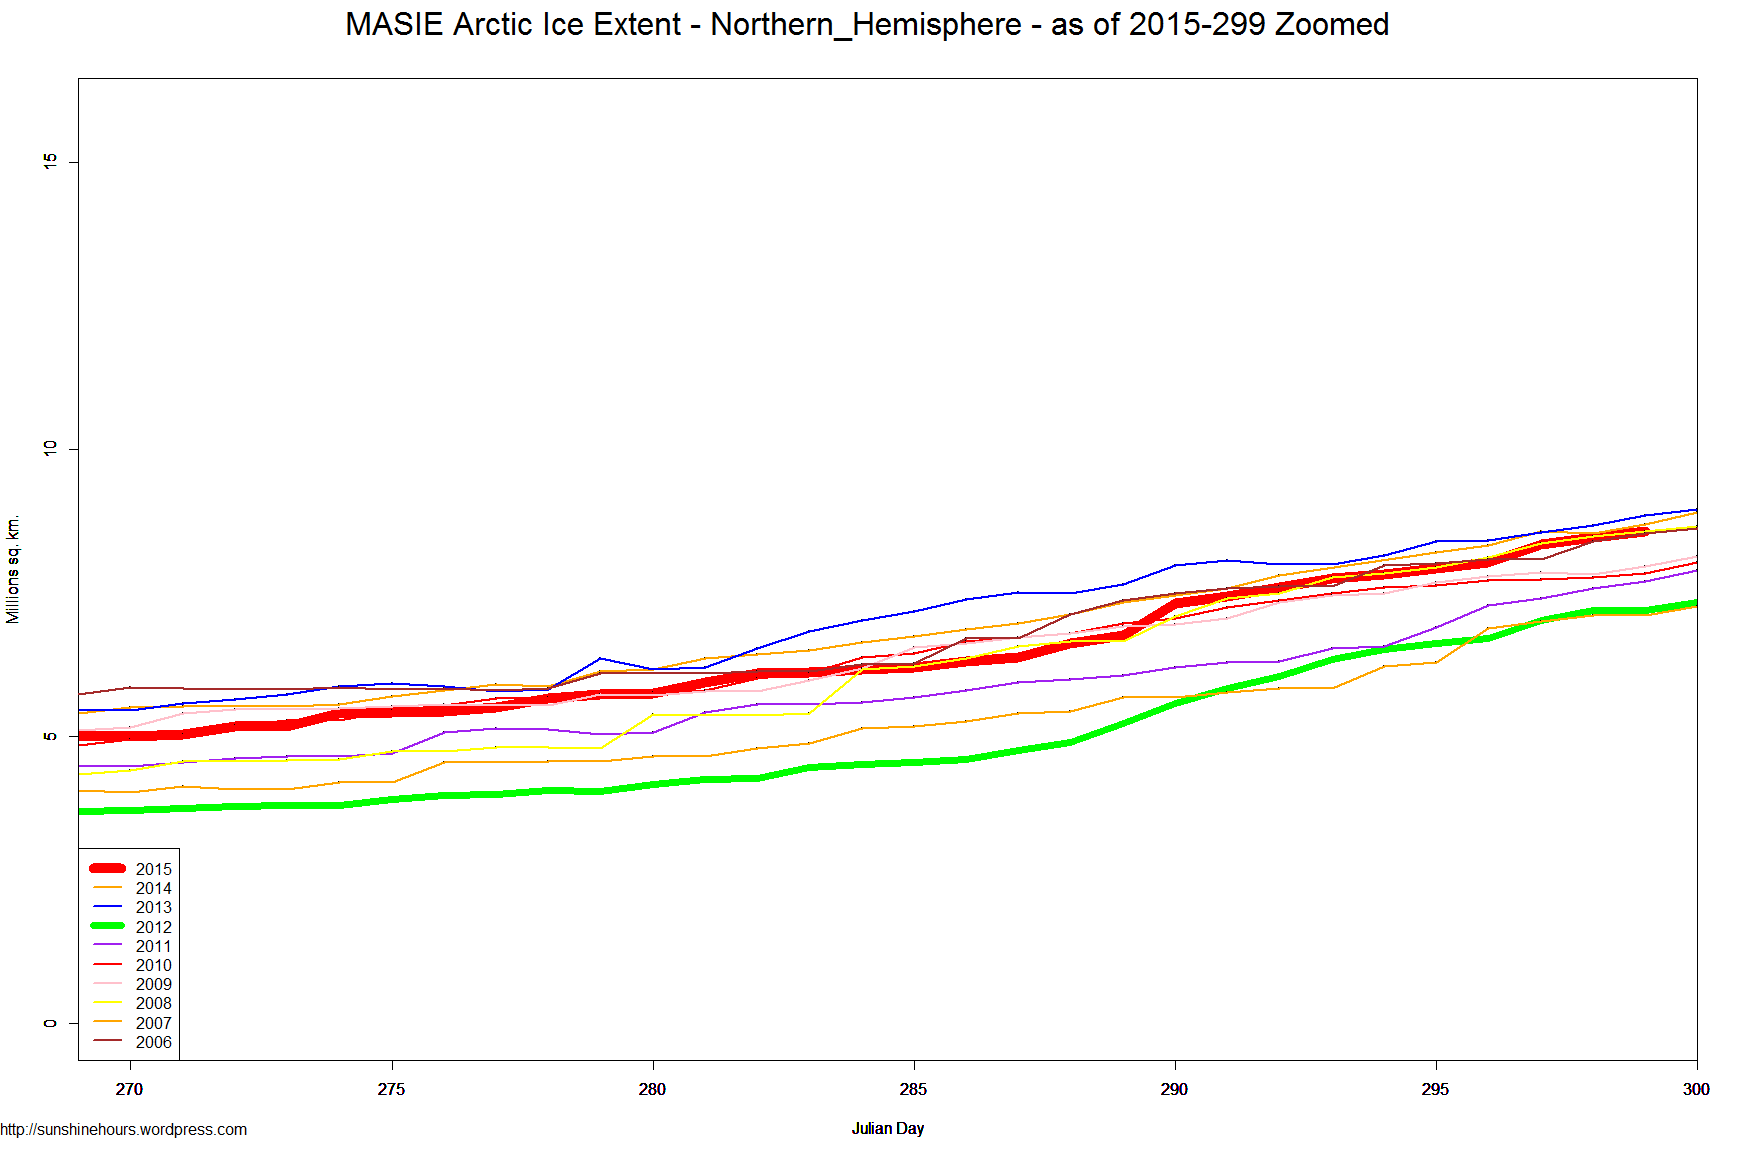
Yes, Arctic ice naturally dipped for a few years between 2006 – 2012. Polar ice fluctuates; that’s what it does. And it’s been recovering since then.
But the alarmist cultists who jumped on the short term dip with their predictions of an ‘ice free Arctic’ are all silent now, ignoring the year-over-year recovery.
They call themselves scientists. They’re not. They are pushing their climate alarmist narrative for self-serving reasons. By doing that they forfeit any credibility.
Skeptics are the only honest kind of scientists. But there are no skeptics among their alarmist clique. Planet Earth is proving them wrong, but they just cannot admit it.
(Sockpuppet’s comment deleted. -mod)
The reply was regarding Zwally’s 2007 prediction. From 2007 on, Arctic ice has been recovering — as your own graph shows.
And you neglected to show the Antarctic:
ftp://sidads.colorado.edu/DATASETS/NOAA/G02135/Mar/S_03_plot.png
Global ice cover is pretty close to its long term average, so there is nothing to be alarmed about.
DB
Nice cherry pick counter.
THAT is the type of answer that the currently disorganized skeptic groups need to promote.
It’s visual.
I can understand it.
It’s easy.
Took me 5 seconds to get it.
Feeder special interest NGOs flood the information machine with more nonsense than skeptics counter with. I gave
menicholas an example in an earlier post.
(Sockpuppet’s comment deleted. -mod)
Craig Loehle,
You’re cherry-picking to beat the band.
This year (which isn’t even over yet) isn’t what anyone would call a trend. It’s a cherry-picked anomaly. And as we see, it’s rising again.
The issue is, and has always been, global warming. By the chart you linked, global ice cover is very near its long term average — as I stated.
So what’s your point? That a 0.7ºC wiggle over the past century and a half is anything other than the planet’s natural recovery from the LIA?
If so, produce measurements supporting whatever it is you’re trying to say. IOW: produce measurements quantifying AGW. That’s the starting point; everything else is conjecture.
(Note: That was not Dr. Loehle, it was a banned sockpuppet stealing his identity. The faker’s comments have all been deleted. -mod.)
Looks like a recovery, goes up and down, and up again… check in a couple of months.
ftp://sidads.colorado.edu/DATASETS/NOAA/G02135/Mar/S_03_plot.png
Anyway, Antarctic Sea Ice Extent refutes CAGW
Craig Loehle
We can do all sorts of projections. But extrapolations have a large chance of being wrong. Even if you are using a “sophisticated” GCM. Plus we can all cherry pick start dates and choose whatever shape for the curve we need to fit our bias. Research often gives us the results we expect as we haven’t done our checking and verification very well. But tree stumps under glaciers, trees submerged in lakes, analysis of sediments and debris on Arctic shorelines and so on suggest mother earth has seen it all before. Who knows what is coming? 67 million years of dinosaurs, then poof! 200,000 years of homo sapiens sapiens and then ??? Maybe the Arctic sea ice will go to zero in September in a decade or two. Or maybe the polar see saw will kick in the Antarctic will warm and the Arctic will cool. I am betting on the latter but it may be a decade from now before we can look backwards and see the “measured” trend.
http://i67.tinypic.com/21ou5ox.jpg
http://i63.tinypic.com/29cv2wm.jpg
(Note: That was not Dr. Loehle, it was a banned sockpuppet stealing his identity. The faker’s comments have all been deleted. -mod.)
Oh darn.
http://i63.tinypic.com/29cv2wm.jpg
http://i67.tinypic.com/21ou5ox.jpg
How about a graph from 1930 through 1988? Or 1930 through 2010? 1930 through 2012?
C’mon, either use a long time period or leave it alone. 1978 is cherry picking.
How about using the best estimates going back as far as you can find decent data? Perhaps I have become “sensitive” but AGW believers leave out much of what is known. Actual instrument records show 1930s the hot decade in the US. Compelling evidence shows the Medieval, Roman and Minoan Warm Periods.
Our climate is cyclical. It gets warmer AND cooler. Choosing a date near the end of a cooler period seems dishonest to me. It is certainly meaningless.
A bit of “heat” here but I feel “you guys” are deserving of it since with skill and effort most folks can get statistics to say nearly anything.
Craig, where did you come up with that graph in your post about “average monthly arctic sea ice extent march 1979 – 2014?
(Note: That was not Dr. Loehle, it was a banned sockpuppet stealing his identity. The faker’s comments have all been deleted. -mod.)
(Sockpuppet’s comment deleted. -mod)
Thanks
Since the fake “Craig Loehle” identity thief ends his link at 2014, here’s a comparison of Arctic ice between 2012 and 2014:

http://36.media.tumblr.com/b835c0fc2b0a25b008f736419e545cf6/tumblr_inline_nnty350Cn51qij8k6_500.png
Antarctic ice reached a new record high in 2014:
Next, here’s a comparison blink chart between 2006 and 2015:
Arctic sea ice thickness is recovering:
http://news.bbcimg.co.uk/media/images/79721000/jpg/_79721234_cryosatmap1.jpg
Another view of Arctic ice thickness:
Global sea ice is now rising (recovering):
And NSIDC “adjusts” inconvenient data to produce their own ‘data’:
http://oi28.tinypic.com/2co31gi.jpg
Finally, global ice cover is right around its long term average:
http://www.climate4you.com/images/NSIDC%20GlobalArcticAntarctic%20SeaIceArea.gif
The “ice” scare is just another false alarm. The planet has been recovering in fits and starts since the LIA — one of the coldest episodes of the entire 10,000+ year Holocene. It is only natural that temperatures are reverting to their long term average.
(Sockpuppet’s comment deleted. -mod)
Craig Loehle says:
Not really, because due to Milankovitch cycles…&etc.
Really. ‘Fits and starts’:
http://jonova.s3.amazonaws.com/graphs/hadley/Hadley-global-temps-1850-2010-web.jpg
Unless the Milankovitch cycles hypothesis has been shown to fully explain the LIA…
(Note: That was not Dr. Loehle, it was a banned sockpuppet stealing his identity. The faker’s comments have all been deleted. -mod.)
Fit’s and starts
(Comment deleted. -mod)
Nonsense, “Craig”.
You can do anything with WFT — as you show here.
And that’s not ‘my’ graphic. The data was provided by Dr. Phil Jones.
(Sockpuppet’s comment deleted. -mod)
Hi folks,
I’m familiar with Dr. Loehle’s writing. He doesn’t make amateurish mistakes like writing “Fit’s and starts”. There is no apostrophe. Only a dummy writes like that, and Dr. Loehle is no dummy.
That is grammar written by someone ignorant. Someone I suspect is about as ignorant as the sockpuppet who desperately tries to comment here, after being repeatedly banned.
Mods, can you please check on this “Craig Loehle” character? I’m pretty sure it’s the same loser who’s been booted many times before for identity theft.
Thanks.
(REPLY: Correct assumption. Those comments were not made by Dr. Loehle. The impostor has wasted his time. His fake comments will be deleted. -mod)
(Sockpuppet’s comment deleted. -mod)
HA…
(Joke’s on you, chump. All your comments have been deleted. Everyone else’s remain. -mod)
[Wrong-o, sockpuppet. It’s a waste of time so we don’t bother. But not as much a waste of time as yours. -mod]
And NSIDC “adjusts” inconvenient data to produce their own ‘data’:
Yes they smooth it with a 5 day average.
So who was the banned commenter who stole another man’s name?
They should be outed and publically shamed.
dbstealey. I think the weight of evidence points to Arctic sea ice extent going down in the future. What do you think? Is it going up or down? You have said previously that it is going up.
If you have had another look at the evidence and now think it is going down, you can say so. There is no shame in changing your view. Or you could say you don’t believe the evidence is strong enough to say either way. You could still argue that it doesn’t affect your broader point about global warming because Antarctic ice is going up, or whatever.
What you cannot reasonably do is say you think it is going up, that the evidence clearly indicates it is going up, keep posting selected data you say supports that view, then refuse to stand by your claim. So which is it? Is the evidence strong enough to support your previous claims? Will you take my little wager?
Another nail in the AGW noble warming scam. The only thing that can be predicted accurately is they can’t predict anything accurately.
“his team used meteorological data beginning in 1979 to show that the snowfall in East Antarctica actually decreased by 11 billion tons per year during both the ERS and ICESat periods.”
Given that Antarctica is 14 million square kms and 1 ton of water equivalent precipitation covers a surface area of a minuscule 10 square m at 1 cm deep, Zwally is claiming an annual precipitation accuracy of just a millimetre per year over vast areas of unmeasured continent. Something on the back of my envelope smells fishy.
Anyone feel like checking my work?
grr I already see that he said East Antarctica not the whole thing. I don’t know what “East Antarctica” area is so I can’t redo the reverse engineering.
Instead of ten square meters, perhaps you meant ten meters, squared? That would be 100 square meters, times one centimeter equals one cubic meter…or one metric ton of water.
According to Zwally in 2007, the Arctic was a “dead canary”, and it was “time to get out of the coal mines”.
Unfortunately for him though, the issue of ice fluctuations is nothing but a red herring, and his cAGW ideology has become a dead parrot.
About the real meteorology, by station, that is true and very little known for certain (especially measurement accuracy and precision) including surface winds that affect the metamorphism of snow (low density) to firn (variable mid densities) to glacier ice (high density) on the +3 km elevation basin divides (ice divides).
But in general, and sloppy, the truth is out.
I’m waiting for NSIDC to stop faking the numbers in SH_seaice_extent.csv but I suspect the “addictions” are getting in the way. After all, Colorado. Ha ha.
Its very confusing to me how a scientific story about the Antarctic ice sheet can make claims completely contradictory to the 13 year accumulation of data from the NASA GRACE satellites without even mentioning that they looked at that data. The 2 NASA Gravity Recovery and Climate Evaluation satellites have been measuring Antarctic and Greenland ice sheet masses since 2002 and over that 13 year period show a decline of 134 billion metric tons per year for the Antarctic ice sheet. Years of work and $100 million of NASA’s budget was spent with claims of providing mass and gravity measurements “with unprecedented accuracy”. There has never been any error band given with the GRACE measurements, implying any errors were small. Is this report saying the GRACE measurements are garbage or is there a difference because “ice sheet” includes sea ice in this report and not in the GRACE data? They mention ICESat data but that ended in 2009, why would they not even mention the GRACE data that covers the same 2003 to 2009 that ICESat did plus the last 6 years? Both are NASA satellites. Is GRACE data considered bogus by some climatologists?
The actual data from grace showed little change in mass. It only showed a negative balance because they applied the GIA. …I think the GIA was is only about 3 mm elevation gain.. So with this it would be the GIA would be about a 3 mm drop.
If you think about it…..the average ice thickness say near 7000 feet…..their trying to measure a few mm thickness difference. I say that’s impossible.
But if they get the GIA wrong here….what about everywhere else where sea level rise Is also base on GIA.
J
There are NO words of astonishment that explain the feeling of realizing that there is a debate over a few millimeters of measurement concerning ice thickness in the natural environment. An environment outside the confines of a controlled lab setting.
Do scientists ever get together and perhaps one jumps on the round table shouting and writhing in the crazy man dance about such things ?
Knute says:
Do scientists ever get together and perhaps one jumps on the round table shouting and writhing in the crazy man dance about such things?
It’s worse than that.
What are the error bars on “nearly”?
+almost_completely -not_much_at_all?
This what happens when you make Computers your god, as I’ve recently found out from three different Hyundai Mechanics, who were unable to diagnose and fix a mechanical problem on my car because today mechanics use computers for all diagnosis of a cars problem, instead of using the older methods of trial and error and process of elimination to diagnose a cars problem. So, I sit here with the same car problem having spent a bucket full of money because today’s mechanics can’t diagnose a problem without relying on their little computer gods. I believe the analogy to Algore Inc’s and the IPCC’s and the U.N.’s use of computer models to always predict what’s going to happen with the weather 20-30 years from now is obvious…
WHAT A CROCK OF DO DO