From NASA Goddard and JPL:

NASA studying 2015 El Niño event as never before
Every two to seven years, an unusually warm pool of water — sometimes two to three degrees Celsius higher than normal develops across the eastern tropical Pacific Ocean to create a natural short-term climate change event. This warm condition, known as El Niño, affects the local aquatic environment, but also spurs extreme weather patterns around the world, from flooding in California to droughts in Australia. This winter, the 2015-16 El Niño event will be better observed from space than any previous El Niño.
This year’s El Niño is already strong and appears likely to equal the event of 1997-98, the strongest El Niño on record, according to the World Meteorological Organization. All 19 of NASA’s current orbiting Earth-observing missions were launched after 1997. In the past two decades, NASA has made tremendous progress in gathering and analyzing data that help researchers understand more about the mechanics and global impacts of El Niño.
El Niño is a fascinating phenomenon because it has such far-reaching and diverse impacts. The fact that fires in Indonesia are linked with circulation patterns that influence rainfall over the United States shows how complex and interconnected the Earth system is, said Lesley Ott, research meteorologist at NASA’s Goddard Space Flight Center, Greenbelt, Maryland.
Using NASA satellite observations in tandem with supercomputer processing power for modeling systems, scientists have a comprehensive suite of tools to analyze El Niño events and their global impacts as never before. Throughout this winter, NASA will share the latest scientific insights and imagery updates related to El Niño.
For instance, scientists are learning how El Niño affects the year-to-year variability for fire seasons in the western United States, Amazon and Indonesia. El Niño may also affect the yearly variability of the ground-level pollutant ozone that severely affects human health. Researchers will be keenly focused on how the current El Niño will affect the drought in California.
We still have a lot to learn about these connections, and NASA’s suite of satellites will help us understand these processes in a new and deeper way, said Ott.
Many NASA satellites observe environmental factors that are associated with El Niño evolution and its impacts, including sea surface temperature, sea surface height, surface currents, atmospheric winds and ocean color. The joint NASA/NOAA/CNES/EUMETSAT Jason-2 satellite measures sea surface height, which is especially useful in quantifying the heat stored and released by the oceans during El Niño years.
NASA satellites also help scientists see the global impact of El Niño. The warmer than normal eastern Pacific Ocean has far-reaching effects worldwide. These events spur disasters like fires and floods. They change storm tracks, cloud cover and other weather patterns, and they have devastating effects on fisheries and other industries.
NASA’s Earth-observing satellites help monitor those and other impacts by measuring land and ocean conditions that both influence and are affected by El Niño. For instance, NASA’s Global Precipitation Measurement Mission provides worldwide precipitation measurements every three hours. NASA’s Soil Moisture Active Passive mission measures soil moisture in the top layer of land. Both of these satellites are useful for monitoring drought, improving flood warnings and watching crop and fishing industries.
NASA is at the forefront in providing key observations of El Niño and advancing our understanding of its role in shaping Earth’s weather and climate patterns, said Duane Waliser, chief scientist of the Earth Science and Technology Directorate at NASA’s Jet Propulsion Laboratory in Pasadena, California.
###
“Every two to seven years, an unusually warm pool of water — sometimes two to three degrees Celsius higher than normal develops across the eastern tropical Pacific Ocean to create a natural short-term climate change event. ”
//////
But the 1997/8 Super El Nino did not create a short term climate change event, but rather a long term one.
If one reviews the satellite data set, it clearly shows that temperatures were flat (no statistically significant trend) since 1979 (the launch date) and through to the end of 1996/early 1997 (ie., the run up to the 1997/8 Super El Nino) and following that event, temperatures were once again flat (ie.,no statistically significant trend) from say 1999 to date.
In the satellite data set, there is no straight line linear trend in temperature rise from launch (1979) to date, but rather a single one off temperature step change coincident upon the 1997/8 Super El Nino.
The satellite data set is a strong indicator that a Super El Nino can create a step change in temperature that does not simply result in “a natural short-term climate change event ” but rather one that can have some long term effect.
It will be interesting to see whether this 2015/6 Strong El Nino also results in a step change in temperatures or whether the following La Nina cancels out whatever warming resulted from the 2015/6 El Nino so that that particular El Nino resulted only in a natural short-term climate change event lasting no more than a year or so.
We should know more by 2020. Perhaps even by 2019, ie., the date when AR6 will be released on the world. I bet that a lot of warmists are hoping that the 2015/6 Strong El Nino will cause an upward temperature shift which they will then massage as part of a straight line linear trend so as to keep their pet theory alive and running longer.
Let’s see what happens.
I am a bit surprised that of all the claims made in this article of what can be caused by an El Nino there is no mention that an El Nino can lead to a rise in global temps. They appear to be ignoring that prospect.
They appear to be suggesting that weather patterns might be more informative than global averaged temperature, carbon dioxide emissions, and old-fashioned stuff like that, for determining what actually happens on the ground where we live. They also whitewash the fingerprint of humanity from the crime scene by imputing that nature is somehow to blame for the magnitude of an El Nino.
It looks a lot like heresy to me.
If NASA were at the “forefront” of studying and analyzing El Niño’s, one would think they would discuss the cause. Seems silly to me that the Sun would routinely heat up specific spots in the Pacific Ocean including the Pacific Blob. A better explanation might be found “below”. Check out the date on this article and ask; where is the follow up research on this is? http://www.nytimes.com/1995/04/25/science/hot-vents-in-the-sea-floor-may-drive-el-nino.html?pagewanted=1.
No, not enough thermal flux from the black smokers.
That’s like saying volcanoes are too small to have an impact. They can be huge. The continents float upon a planet of molten rock. There is no shortage of heat down under.
This El Niño will not be as strong as 1997, the drivers are starting to fall of now.
But it will be in the top ten El Niño events since 1860 and the climate impacts are already starting to be felt but the biggest impacts will not occur until Feb to April 2016.
Warm winter for Alaska to Minnesota. Cool winter for the US Southeast, rain is coming to California and Indonesia will get even dryer than it is already. Australia has escaped the lack of rain pattern so far but that will come soon.
Bill, here in the mid-Appalachians, I worry about the strong subtropical jet joining up w/a polar jet & producing a massive snow or ice-storm.
Look at the model forecasts for Nino 3.4 temperatures. Their trends raise the possibility that this El Nino might not be “precedent breaking” — but instead match the more careful statements by NOAA and NASA.
* Through 2015 the peak of the CFSv2 average was > 2.5, peaking in June far above 2.5 (literally off the chart). Since then it’s dropped to ~2.5 (Oct is not yet posted).
* The averages of the IPI plumes of dynamic models and statistical models were both lower than the CFSv2 average, but rising. In August the Dynamic model rose to 2.5, equal to CFSv2.
* Since then the peak of CFSv2 & Dynamic model averages have remained at 2.5 (both above the peak of the Statistical Model plume’s average).
A peak at 2.5 would be only slightly above the 2.3 peak in 1997-98 (the Oct-Dec and Nov-Jan averages). Might this El Nino be similar to 1998, rather than the “unprecedented” “Godzilla” cycle widely expected?
Comments by readers who understand these things would be helpful! (They’re over my pay grade.)
Data sources (I could not find the past forecasts of the CFSv2 *PDF-corrected* model used in the weekly CPC reports).
http://iri.columbia.edu/our-expertise/climate/forecasts/enso/current/
http://www.cpc.ncep.noaa.gov/products/CDB/CDB_Archive_html/CDB_archive.shtml
http://www.cpc.ncep.noaa.gov/products/analysis_monitoring/ensostuff/ensoyears.shtml
On some points I concur with Bill Illis. The NOAA and others seem to forget or ignore that El Nino is historically only a Pacific phenomenon. It does not apply to the Atlantic. The name was coined in 1982-83 to describe the warmth reaching Peru from the west, which mets decided to monitor forever afterwards using the sea surface temperature differentials between Tahiti and Darwin. Hot flows to cold. The oscillation is a lunar one. And I would say that to date the most severe El Nino would have been 1965-66, which everyone seems to have forgotten.
In Australia the temperature effects of El Niño are felt most strongly during winter and spring – dry season. Temperature effects of La Niña have their greatest impact October to March – wet season. This immediately should alert the reader to a falsehood when someone says a ‘strong El Nino summer’ is coming to the southern hemisphere. No, that cannot happen. It is just summer, that is all.
Statistically more wetter years appear around minimum lunar declination (18deg), e.g. 1978, 1997 and 2015. More drier years appear around maximum lunar declination (28deg), e.g. 1970, 1987 and 2005. Well, 2015 is the lunar standstill year, the year of the moon’s smallest monthly hemispherical change, in which volumes of water are exchanged across the equator and barometric changes occur because the oceans and air are one joined system. Minimal wave transference results in less barometric extremes.
In standstill years the moon slows and currents diminish in strength. including the Gulf Stream, zapping the strength of the jet streams, making them sluggish, causing cooler, wetter weather. Look out for that in the next southern hemisphere winter. In the northern hemisphere expect less tendency for polar air to descend beyond polar regions in coming months, the result of which will generate milder winters for Ireland and England.
El Ninos correlate to ocean current strength. When currents slow, stall and reverse this puts the brake on cyclones. And in the northern hemisphere a strong El Nino will never result from a slowed Gulf Stream and/or diminished jet stream activity, BOTH of which ARE occurring now.
Yes I estimate there will be a lot of dryness in NZ from November to June, especially for some eastern regions, but not for the whole country and not even for all eastern parts. El Nino is usually not that selective. Australia should see some severe rain deficits in some already dry regions but many Australian farmers will be delighted with widespread autumn relief for the start of the growing season. However, my calculations are that heavy winter rain, gales, thunderstorms, floods etc in many Australian states will ruin crops. Does this sound like El Nino? Plus all indications from an amalgam of historical cycles points to the return of La Nina in spring.
Ken Ring? If not one of his brainless followers?
Your twaddle about the moon driving weather and climate and just about every other natural global event has been shown to be baseless. https://en.m.wikipedia.org/wiki/Ken_Ring_(writer)
Might I suggest you send a selection of your forecasts to Anthony so he can compare them to observations a bit like his expose of Piers Corbyn. I already know your response, but until you show how your claims work and it is repeatable then you will always be considered a quack.
Sorry for being off topic.
Quoting Wikipedia as a reliable source for anything wins no debating points. The article is stacked with entries by prominent (in their minds) state-salaried graduates that included a phD on the sex-life of the snail who suddenly became a spokesman on earthquake predictions.
Suggest all you like. I suggest your ad hominen attack says more about you.
Ken Ring
Ok agreed that wikipedia is not the most reliable source but people here need to know (if they dont already) that you make vague generalised predictions that fit many scenarios just like fortune tellers and like your fellow charlatan Piers Corbyn who Anthony W exposed clinically here http://wattsupwiththat.com/2012/07/05/putting-piers-corbyn-to-the-test/
You claim success like Piers Corbyn by cherry picking examples, but ignoring the far many failures taking advantage of human nature’s short term memory and tendency for confirmational bias.
Ireland for some reason is rich fishing grounds for both you and Piers but even here they are questioning your success.
https://irishmansdiary.wordpress.com/2014/01/05/announcing-ken-ring-watch-2014-kenringwatch/
And a few others
http://www.sillybeliefs.com/ring.html
http://sciblogs.co.nz/the-atavism/2010/11/19/ken-ring-cant-predict-the-weather/
http://m.nzherald.co.nz/nz/news/article.cfm?c_id=1&objectid=10904342
( from last link “In 2011, Ring went into hiding after he was blamed for causing thousands of Christchurch people to flee the city.” After he predicted a historical quake to occur on March 20 2011 in a period of after shocks after the main Christchurch Quake.)
It is not hard to find countless links to show the obvious inaccuracy of which I tested myself along with Piers Corbyn. It shows you would do far better tossing a coin and to some extent there is negative correlation. Although it is near impossible to accurately analyse predictions because they are so broadbrush and climatically generic.
Finally and most importantly the reason I am raising all this is not a focused attack on Ken Ring, but an attempt to disassociate the WUWT message from unscientific methods and beliefs from the likes of Ken Ring. This is because as sure as night follows day, pro AGW scientists and followers will point to blogs like this and use it as evidence that the ‘Skeptics’ are made up of people like Ken Ring and Piers Corbyn and therefore proof they should be ignored.
Does this mean that including this year in our trend lines will skew the average like is claimed with 1998? If we plot from 1998 through 2015, there were would nothing usable according to the global warming community because you can’t start or end with an El Nino year. It seems we’ll need at least 5 more years and probably more before warmist aren’t guilty of “cherry picking” using an El Nino year, if their own rules apply to themselves.
It is complicated. Interfering and reinforcing cycles either strengthens or weakens these events. Every time you throw a rock, different size, shape, and position, it changes the patterns on the water. Or in this case weather/climate. When we can understand the patterns, we can say something more meaningful. A lot of speculation..
The MSM and herd here are already giving three cheers for El Nino, acting like it’s in the bag. I’ll join in if this actually lasts into next Spring. And even with that it could be one and done, back to abnormally low precip during the 2016-17 water year. We need 2 – 3 above normal water years to dig us out of this deep hole.
Major difference between 97 and today is the jet stream and concentration location. Tropical jet is starting to level out but is still completely dominated by blocking polar highs. 97 was much more conductive to sending those tropical plumes to parts north in long waves. Not so today, is more conductive to short pulses or containing plumes to the tropics. I suspect any major long wave effects to only be evident for next 3-4 months in parts away from the tropics.
“We still have a lot to learn about these connections, and NASA’s suite of satellites will help us understand these processes in a new and deeper way, said Ott.
Many NASA satellites observe environmental factors that are associated with El Niño evolution and its impacts, including sea surface temperature, sea surface height, surface currents, atmospheric winds and ocean color. The joint NASA/NOAA/CNES/EUMETSAT Jason-2 satellite measures sea surface height, which is especially useful in quantifying the heat stored and released by the oceans during El Niño years.”
Hypocrites, why not stick to only surface observations? I thought satellites were awful, interpolating and guessing conditions were better. The smaller surface area you cover also gives best results. (sarc/off) Until NASA also accept satellite to being a superior observation tool for all temperatures, they may get some credibility back.
Matt – for your information, NASA does not accept satellites for global temperature because their own temperature curve is falsified. In the eighties and nineties there was a stoppage of warming comparable to the present day warming ‘pause’ or ‘hiatus’ we are living through right now. That one lasted from 1979 to 1997 and NASA knows this. I have a document proving it. That was an 18 year stretch of no warming, comparable to the present hiatus. I discovered it in satellite records in 2008 but when I went to cross check with NASA they had disappeared it and were showing an imaginary “late twentieth century warming” in its place. It does not exist but they are bold enough to show it as part of the official temperature record even now. In case you should want to know, the boss at NASA in the eighties and nineties was James Hansen himself. The falsified data was produced in cooperation by GISS, HadCRUT3, and NCDC. A RICO investigation of how this happened is what we need.
Dutchmen cause El Ninos, obviously. I went to live in Chile, in a coastal town, at the end of 1982-1983 El Nino season. The tail-end of that one brought unprecedented quantities of rain to Northern Chile. Being Dutch, I was blamed by the locals for having caused it.
Ed, I thought they would have praised you for bringing it !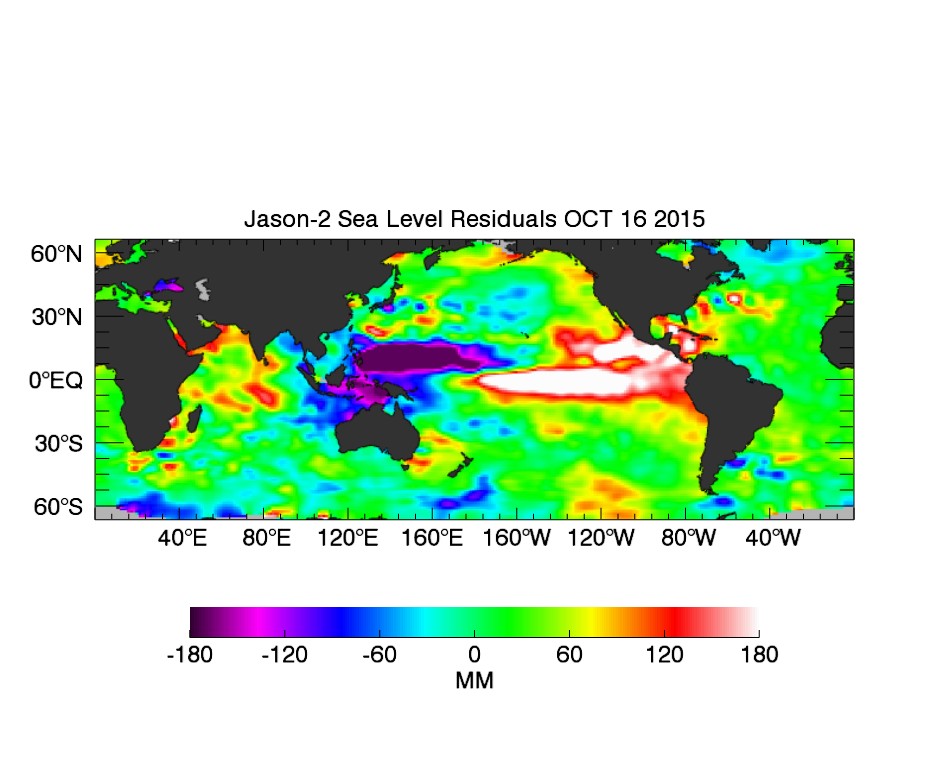
The latest Jason 2 sea level residual has arrived (they are very slow at updating)
If this is understood to be a good proxy for SST’s, you can see why the 3.4 index is so high, it sits almost in the centre of the region, region 1 appears to be cooling. The puzzle for me is why this mass of warm water is sitting off the SA coast and not spreading South down the coast at it clearly did in ’97.
Too much rain in a desert like the coastal Atacama is a recipe for a disaster. The Panamerican highway was seriously damaged over 100s of miles by water filling dry riverbeds (quebradas) breaching the road in spite of the culverts and in places where they didn’t even know there was a dry river bed. There were flash floods in the desert and heavy trucks got stuck in the rapidly rising water with people drowning in the cabins. El Nino has a reputation in SA and not for nothing.
the comment section is still comedy gold.
moaning about science by consensus and models (which is far from reality)
but then doing “science” by wildly guessing and making stuff up on the spot.
DK,
So, you just made that up on the spot, eh?
So am I reading those images right? Two satellites, 18 years apart, covering the exact same area of the earth displaying exact same perspective and area?
Until the tropical fish show up in Peru, there is no story. A weekly satellite update will suffice, IMO.
The very funny thing is that the NOAA are using satellites to predict the future, comparing what the satellites saw in 1997 and what they are seeing now. At the same time they claim that astrometeorology, which is the use of nature’s orbiting satellites to predict weather, is impossible and should be banned outright as snake-oil. Ouch.
They have ended up with a comparison of one, because El Niño came about in 1982-83 and was (and still is) only called off on in hindsight. So 1997-98 was the first sample and the current one has not yet revealed its hand.
But they may as well go the whole hog on the natural satellites. If they did, and swallowed the very large astrology rat, they would work out that:
• 133 years=12 sunspot cycles=29 El Niño’s= 4.6 Saturn cycles
• One Saturn cycle = 6 El Niño’s
• 2 sunspot cycles = 5 El Niño’s
• 1 decade = 2 El Niño’s
• 60 years=13 El Niño’s
Odd that last one. Here’s the thing.
60 years is Solar (Inigo Jones’s drought cycle); 13 was called ‘the moon’s number’ by the Egyptians because the 13th letter of the Hebrew alphabet, “mem” (meaning mother), was the ancient Phoenician word for water.
The Moon is the water planet. The ancient Egyptian word for water was “moo.” M was the most sacred of all the letters, for it symbolized water, where all life began. Moon is the root of the word “mother.” The Sun was usually the Father.
So, it can be said that Earth Mother and Heavenly Father are joined by El Nino.
Plus 1, Some people might call relying on that satellite data in one instance and not in another “cherry picking”. Whatever they do, they’ll bring up the El Nino at weather channels anytime there’s early season arctic cold front that plow thru Northeast. It just aint news.
All very interesting and very vague. Oceanic tides are a verifiable and scientifically proven cycle attributed to the gravitational affects of the moon and sun. This is a good example of science finding an accurate relationship between events/objects. Please show any supporting published papers or your own calculations that justify your belief that you can predict what this El Nino will do and how this is related to ENSO cycles and while you are at it show proven accuracy for your long range weather or earthquake predictions. I am sure there are plenty of people who would love to assess your data here.
pb weather: please get off my case. This is your second ad hominen attack. You ask for ..what? Proof in an inexact science? I suggest you try that approach with the NOAA and see how much they co-operate. You seem to be already familiar with my reputation, my website, my earthquake warnings for Christchurch 6 months prior to the big earthquakes in 2010/11, my work with Australian, Irish and New Zealand farmers, my involvement with Channels Seven and Nine and RTE, and my Australia seminars. I have already posted my own calculations a few times just in this thread over the past few days. For the past 9 years I have written a 500-page Australian Weather Almanac for each year ahead, for use by the agricultural community composed entirely of calculations and estimations. You can order one any time you like and I will gladly send it. The 2016 version is to be released in 3 weeks time. At the beginning of last year there was much discussion in WUWT about an El Nino in 2014. I posted here saying the discussion was a year premature because the event was a year away for which I received some scorn but I have been proven correct. Look, if you don’t like my opinion or alternative viewpoint to your own, simply don’t read it.
Abject nonsense. The 1997/98 El Nino was a super El Nino, not even part of the ENSO oscillation. This is a rare phenomenon that occurs on centenarian or longer scale. Your El Nino watchers have detected that a normal ENSO type El Nino ought to show up this winter by looking at oceanic phenomena like Nino3.4 and others associated with ENSO. The super El Nino we had did not make use of the ocean water whose periodic sloshing from side to side in the equatorial Pacific creates the ENSO phenomenon. Normally an El Nino wave crosses the Pacific along the equatorial counter-current, and runs ashore in South America. There it spreads north and south along the coast and warms the air above it. Warm air rises, joins the westerlies, and it is only at that point that we perceive the existence of the El Nino. But ever since the super Elm Nino stirred up the deep warm layers of the ocean to create the hiatus platform the El Ninos have been irregular. There were none that were noticeable before 2008 when a La Nina appeared. It was followed by an El Nino in 2010 and I thought that a regular ENSO oscillation was back, but I was wrong. , Since then we have had the same doldrums that we had at the beginning of the century. I have to attribute this to a change in the Pacific wind patterns. The warm air that creates the observable atmospheric El Nino must reach the westelies to be observable. The westerlies and the trade winds blow in opposite directions. Their dividing line is somewhere south of the Mexican border. If that dividing line for some reason moves north the warm air that should join the westerlies gets captured by the trade winds and carried in the opposite direction. Result: despite all oceanic indications, no observable El Nino. That is what will hapopen to the expected “super El Nino” this winter. These guys get billions of dollars to do “climate research” but there is no evidence that they have any idea what is going on with the El Nino.
If this is an unusually strong El Nino, one that exceeds 1997, they that may spell trouble for the global warming trend. Temperatures are well off the 97/98 peak.
http://www.drroyspencer.com/wp-content/uploads/UAH_LT_1979_thru_September_2015_v6.png
Has anyone noticed the huge cold blob in the eastern Pacific? Seems it will put an early end to the “huge el nino” worries. Am I wrong?