The Pause lengthens yet again

A new record Pause length: no warming for 18 years 8 months

By Christopher Monckton of Brenchley

One-third of Man’s entire influence on climate since the Industrial Revolution has occurred since January 1997. Yet for 224 months since then there has been no global warming at all (Fig. 1). With this month’s RSS temperature record, the Pause sets a new record at 18 years 8 months.

clip_image002

Figure 1. The least-squares linear-regression trend on the RSS satellite monthly global mean surface temperature anomaly dataset shows no global warming for 18 years 8 months since January 1997, though one-third of all anthropogenic forcings occurred during the period of the Pause.

As ever, a warning about the current el Niño. It is becoming ever more likely that the temperature increase that usually accompanies an el Niño will begin to shorten the Pause somewhat, just in time for the Paris climate summit, though a subsequent La Niña would be likely to bring about a resumption and perhaps even a lengthening of the Pause.

The spike in global temperatures caused by the thermohaline circulation carrying the warmer waters from the tropical Pacific all around the world usually occurs in the northern-hemisphere winter during an el Niño year.

However, the year or two after an el Niño usually – but not always – brings an offsetting la Niña, cooling first the ocean surface and then the air temperature and restoring global temperature to normal.

clip_image004

Figure 1a. The sea surface temperature index for the Nino 3.4 region of the tropical eastern Pacific, showing the climb towards a peak that generally occurs in the northern-hemisphere winter. For now, the Pause continues to lengthen, but before long the warmer sea surface temperatures in the Pacific will be carried around the world by the thermohaline circulation, causing a temporary warming spike in global temperatures.

The hiatus period of 18 years 8 months is the farthest back one can go in the RSS satellite temperature record and still show a sub-zero trend. The start date is not cherry-picked: it is calculated. And the graph does not mean there is no such thing as global warming. Going back further shows a small warming rate.

The UAH dataset shows a Pause almost as long as the RSS dataset. However, the much-altered surface tamperature datasets show a small warming rate (Fig. 1b).

clip_image006

Figure 1b. The least-squares linear-regression trend on the mean of the GISS, HadCRUT4 and NCDC terrestrial monthly global mean surface temperature anomaly datasets shows global warming at a rate equivalent to a little over 1 C° per century during the period of the Pause from January 1997 to July 2015.

Bearing in mind that one-third of the 2.4 W m–2 radiative forcing from all manmade sources since 1750 has occurred during the period of the Pause, a warming rate equivalent to little more than 1 C°/century is not exactly alarming. However, the paper that reported the supposed absence of the Pause was extremely careful not to report just how little warming the terrestrial datasets – even after all their many tamperings – actually show.

As always, a note of caution. Merely because there has been little or no warming in recent decades, one may not draw the conclusion that warming has ended forever. The trend lines measure what has occurred: they do not predict what will occur.

The Pause – politically useful though it may be to all who wish that the “official” scientific community would remember its duty of skepticism – is far less important than the growing discrepancy between the predictions of the general-circulation models and observed reality.

The divergence between the models’ predictions in 1990 (Fig. 2) and 2005 (Fig. 3), on the one hand, and the observed outturn, on the other, continues to widen. If the Pause lengthens just a little more, the rate of warming in the quarter-century since the IPCC’s First Assessment Report in 1990 will fall below 1 C°/century equivalent.

clip_image008

Figure 2. Near-term projections of warming at a rate equivalent to 2.8 [1.9, 4.2] K/century, made with “substantial confidence” in IPCC (1990), for the 307 months January 1990 to July 2015 (orange region and red trend line), vs. observed anomalies (dark blue) and trend (bright blue) at just 1 K/century equivalent, taken as the mean of the RSS and UAH v. 5.6 satellite monthly mean lower-troposphere temperature anomalies.

clip_image010

Figure 3. Predicted temperature change, January 2005 to July 2015, at a rate equivalent to 1.7 [1.0, 2.3] Cº/century (orange zone with thick red best-estimate trend line), compared with the near-zero observed anomalies (dark blue) and real-world trend (bright blue), taken as the mean of the RSS and UAH v. 5.6 satellite lower-troposphere temperature anomalies.

The page Key Facts about Global Temperature (below) should be shown to anyone who persists in believing that, in the words of Mr Obama’s Twitteratus, “global warming is real, manmade and dangerous”.

The Technical Note explains the sources of the IPCC’s predictions in 1990 and in 2005, and also demonstrates that that according to the ARGO bathythermograph data the oceans are warming at a rate equivalent to less than a quarter of a Celsius degree per century.

Key facts about global temperature

Ø The RSS satellite dataset shows no global warming at all for 224 months from January 1997 to August 2015 – more than half the 440-month satellite record.

Ø There has been no warming even though one-third of all anthropogenic forcings since 1750 have occurred since the Pause began in January 1997.

Ø The entire RSS dataset from January 1979 to date shows global warming at an unalarming rate equivalent to just 1.2 Cº per century.

Ø Since 1950, when a human influence on global temperature first became theoretically possible, the global warming trend has been equivalent to below 1.2 Cº per century.

Ø The global warming trend since 1900 is equivalent to 0.75 Cº per century. This is well within natural variability and may not have much to do with us.

Ø The fastest warming rate lasting 15 years or more since 1950 occurred over the 33 years from 1974 to 2006. It was equivalent to 2.0 Cº per century.

Ø Compare the warming on the Central England temperature dataset in the 40 years 1694-1733, well before the Industrial Revolution, equivalent to 4.33 C°/century.

Ø In 1990, the IPCC’s mid-range prediction of near-term warming was equivalent to 2.8 Cº per century, higher by two-thirds than its current prediction of 1.7 Cº/century.

Ø The warming trend since 1990, when the IPCC wrote its first report, is equivalent to 1 Cº per century. The IPCC had predicted close to thrice as much.

Ø To meet the IPCC’s central prediction of 1 C° warming from 1990-2025, in the next decade a warming of 0.75 C°, equivalent to 7.5 C°/century, would have to occur.

Ø Though the IPCC has cut its near-term warming prediction, it has not cut its high-end business as usual centennial warming prediction of 4.8 Cº warming to 2100.

Ø The IPCC’s predicted 4.8 Cº warming by 2100 is well over twice the greatest rate of warming lasting more than 15 years that has been measured since 1950.

Ø The IPCC’s 4.8 Cº-by-2100 prediction is four times the observed real-world warming trend since we might in theory have begun influencing it in 1950.

Ø The oceans, according to the 3600+ ARGO buoys, are warming at a rate of just 0.02 Cº per decade, equivalent to 0.23 Cº per century, or 1 C° in 430 years.

Ø Recent extreme-weather events cannot be blamed on global warming, because there has not been any global warming to speak of. It is as simple as that.


Technical note

Our latest topical graph shows the least-squares linear-regression trend on the RSS satellite monthly global mean lower-troposphere dataset for as far back as it is possible to go and still find a zero trend. The start-date is not “cherry-picked” so as to coincide with the temperature spike caused by the 1998 el Niño. Instead, it is calculated so as to find the longest period with a zero trend.

The fact of a long Pause is an indication of the widening discrepancy between prediction and reality in the temperature record.

The satellite datasets are arguably less unreliable than other datasets in that they show the 1998 Great El Niño more clearly than all other datasets. The Great el Niño, like its two predecessors in the past 300 years, caused widespread global coral bleaching, providing an independent verification that the satellite datasets are better able than the rest to capture such fluctuations without artificially filtering them out.

Terrestrial temperatures are measured by thermometers. Thermometers correctly sited in rural areas away from manmade heat sources show warming rates below those that are published. The satellite datasets are based on reference measurements made by the most accurate thermometers available – platinum resistance thermometers, which provide an independent verification of the temperature measurements by checking via spaceward mirrors the known temperature of the cosmic background radiation, which is 1% of the freezing point of water, or just 2.73 degrees above absolute zero. It was by measuring minuscule variations in the cosmic background radiation that the NASA anisotropy probe determined the age of the Universe: 13.82 billion years.

The RSS graph (Fig. 1) is accurate. The data are lifted monthly straight from the RSS website. A computer algorithm reads them down from the text file and plots them automatically using an advanced routine that automatically adjusts the aspect ratio of the data window at both axes so as to show the data at maximum scale, for clarity.

The latest monthly data point is visually inspected to ensure that it has been correctly positioned. The light blue trend line plotted across the dark blue spline-curve that shows the actual data is determined by the method of least-squares linear regression, which calculates the y-intercept and slope of the line.

The IPCC and most other agencies use linear regression to determine global temperature trends. Professor Phil Jones of the University of East Anglia recommends it in one of the Climategate emails. The method is appropriate because global temperature records exhibit little auto-regression, since summer temperatures in one hemisphere are compensated by winter in the other. Therefore, an AR(n) model would generate results little different from a least-squares trend.

Dr Stephen Farish, Professor of Epidemiological Statistics at the University of Melbourne, kindly verified the reliability of the algorithm that determines the trend on the graph and the correlation coefficient, which is very low because, though the data are highly variable, the trend is flat.

RSS itself is now taking a serious interest in the length of the Great Pause. Dr Carl Mears, the senior research scientist at RSS, discusses it at remss.com/blog/recent-slowing-rise-global-temperatures.

Dr Mears’ results are summarized in Fig. T1:

clip_image012

Figure T1. Output of 33 IPCC models (turquoise) compared with measured RSS global temperature change (black), 1979-2014. The transient coolings caused by the volcanic eruptions of Chichón (1983) and Pinatubo (1991) are shown, as is the spike in warming caused by the great el Niño of 1998.

Dr Mears writes:

“The denialists like to assume that the cause for the model/observation discrepancy is some kind of problem with the fundamental model physics, and they pooh-pooh any other sort of explanation.  This leads them to conclude, very likely erroneously, that the long-term sensitivity of the climate is much less than is currently thought.”

Dr Mears concedes the growing discrepancy between the RSS data and the models, but he alleges “cherry-picking” of the start-date for the global-temperature graph:

“Recently, a number of articles in the mainstream press have pointed out that there appears to have been little or no change in globally averaged temperature over the last two decades.  Because of this, we are getting a lot of questions along the lines of ‘I saw this plot on a denialist web site.  Is this really your data?’  While some of these reports have ‘cherry-picked’ their end points to make their evidence seem even stronger, there is not much doubt that the rate of warming since the late 1990s is less than that predicted by most of the IPCC AR5 simulations of historical climate.  … The denialists really like to fit trends starting in 1997, so that the huge 1997-98 ENSO event is at the start of their time series, resulting in a linear fit with the smallest possible slope.”

In fact, the spike in temperatures caused by the Great el Niño of 1998 is almost entirely offset in the linear-trend calculation by two factors: the not dissimilar spike of the 2010 el Niño, and the sheer length of the Great Pause itself. The headline graph in these monthly reports begins in 1997 because that is as far back as one can go in the data and still obtain a zero trend.

Curiously, Dr Mears prefers the terrestrial datasets to the satellite datasets. The UK Met Office, however, uses the satellite data to calibrate its own terrestrial record.

The length of the Great Pause in global warming, significant though it now is, is of less importance than the ever-growing discrepancy between the temperature trends predicted by models and the far less exciting real-world temperature change that has been observed.

Sources of the IPCC projections in Figs. 2 and 3

IPCC’s First Assessment Report predicted that global temperature would rise by 1.0 [0.7, 1.5] Cº to 2025, equivalent to 2.8 [1.9, 4.2] Cº per century. The executive summary asked, “How much confidence do we have in our predictions?” IPCC pointed out some uncertainties (clouds, oceans, etc.), but concluded:

“Nevertheless, … we have substantial confidence that models can predict at least the broad-scale features of climate change. … There are similarities between results from the coupled models using simple representations of the ocean and those using more sophisticated descriptions, and our understanding of such differences as do occur gives us some confidence in the results.”

That “substantial confidence” was substantial over-confidence. For the rate of global warming since 1990 – the most important of the “broad-scale features of climate change” that the models were supposed to predict – is now below half what the IPCC had then predicted.

In 1990, the IPCC said this:

“Based on current models we predict:

“under the IPCC Business-as-Usual (Scenario A) emissions of greenhouse gases, a rate of increase of global mean temperature during the next century of about 0.3 Cº per decade (with an uncertainty range of 0.2 Cº to 0.5 Cº per decade), this is greater than that seen over the past 10,000 years. This will result in a likely increase in global mean temperature of about 1 Cº above the present value by 2025 and 3 Cº before the end of the next century. The rise will not be steady because of the influence of other factors” (p. xii).

Later, the IPCC said:

“The numbers given below are based on high-resolution models, scaled to be consistent with our best estimate of global mean warming of 1.8 Cº by 2030. For values consistent with other estimates of global temperature rise, the numbers below should be reduced by 30% for the low estimate or increased by 50% for the high estimate” (p. xxiv).

The orange region in Fig. 2 represents the IPCC’s medium-term Scenario-A estimate of near-term warming, i.e. 1.0 [0.7, 1.5] K by 2025.

The IPCC’s predicted global warming over the 25 years from 1990 to the present differs little from a straight line (Fig. T2).

clip_image014

Figure T2. Historical warming from 1850-1990, and predicted warming from 1990-2100 on the IPCC’s “business-as-usual” Scenario A (IPCC, 1990, p. xxii).

Because this difference between a straight line and the slight uptick in the warming rate the IPCC predicted over the period 1990-2025 is so small, one can look at it another way. To reach the 1 K central estimate of warming since 1990 by 2025, there would have to be twice as much warming in the next ten years as there was in the last 25 years. That is not likely.

But is the Pause perhaps caused by the fact that CO2 emissions have not been rising anything like as fast as the IPCC’s “business-as-usual” Scenario A prediction in 1990? No: CO2 emissions have risen rather above the Scenario-A prediction (Fig. T3).

clip_image016

Figure T3. CO2 emissions from fossil fuels, etc., in 2012, from Le Quéré et al. (2014), plotted against the chart of “man-made carbon dioxide emissions”, in billions of tonnes of carbon per year, from IPCC (1990).

Plainly, therefore, CO2 emissions since 1990 have proven to be closer to Scenario A than to any other case, because for all the talk about CO2 emissions reduction the fact is that the rate of expansion of fossil-fuel burning in China, India, Indonesia, Brazil, etc., far outstrips the paltry reductions we have achieved in the West to date.

True, methane concentration has not risen as predicted in 1990 (Fig. T4), for methane emissions, though largely uncontrolled, are simply not rising as the models had predicted. Here, too, all of the predictions were extravagantly baseless.

The overall picture is clear. Scenario A is the emissions scenario from 1990 that is closest to the observed CO2 emissions outturn.

clip_image018

Figure T4. Methane concentration as predicted in four IPCC Assessment Reports, together with (in black) the observed outturn, which is running along the bottom of the least prediction. This graph appeared in the pre-final draft of IPCC (2013), but had mysteriously been deleted from the final, published version, inferentially because the IPCC did not want to display such a plain comparison between absurdly exaggerated predictions and unexciting reality.

To be precise, a quarter-century after 1990, the global-warming outturn to date – expressed as the least-squares linear-regression trend on the mean of the RSS and UAH monthly global mean surface temperature anomalies – is 0.27 Cº, equivalent to little more than 1 Cº/century. The IPCC’s central estimate of 0.71 Cº, equivalent to 2.8 Cº/century, that was predicted for Scenario A in IPCC (1990) with “substantial confidence” was approaching three times too big. In fact, the outturn is visibly well below even the least estimate.

In 1990, the IPCC’s central prediction of the near-term warming rate was higher by two-thirds than its prediction is today. Then it was 2.8 C/century equivalent. Now it is just 1.7 Cº equivalent – and, as Fig. T5 shows, even that is proving to be a substantial exaggeration.

Is the ocean warming?

One frequently-discussed explanation for the Great Pause is that the coupled ocean-atmosphere system has continued to accumulate heat at approximately the rate predicted by the models, but that in recent decades the heat has been removed from the atmosphere by the ocean and, since globally the near-surface strata show far less warming than the models had predicted, it is hypothesized that what is called the “missing heat” has traveled to the little-measured abyssal strata below 2000 m, whence it may emerge at some future date.

Actually, it is not known whether the ocean is warming: each of the 3600 automated ARGO bathythermograph buoys takes just three measurements a month in 200,000 cubic kilometres of ocean – roughly a 100,000-square-mile box more than 316 km square and 2 km deep. Plainly, the results on the basis of a resolution that sparse (which, as Willis Eschenbach puts it, is approximately the equivalent of trying to take a single temperature and salinity profile taken at a single point in Lake Superior less than once a year) are not going to be a lot better than guesswork.

Unfortunately ARGO seems not to have updated the ocean dataset since December 2014. However, what we have gives us 11 full years of data. Results are plotted in Fig. T5. The ocean warming, if ARGO is right, is equivalent to just 0.02 Cº decade–1, equivalent to 0.2 Cº century–1.

clip_image020

Figure T5. The entire near-global ARGO 2 km ocean temperature dataset from January 2004 to December 2014 (black spline-curve), with the least-squares linear-regression trend calculated from the data by the author (green arrow).

Finally, though the ARGO buoys measure ocean temperature change directly, before publication NOAA craftily converts the temperature change into zettajoules of ocean heat content change, which make the change seem a whole lot larger.

The terrifying-sounding heat content change of 260 ZJ from 1970 to 2014 (Fig. T6) is equivalent to just 0.2 K/century of global warming. All those “Hiroshima bombs of heat” of which the climate-extremist websites speak are a barely discernible pinprick. The ocean and its heat capacity are a lot bigger than some may realize.

clip_image022

Figure T6. Ocean heat content change, 1957-2013, in Zettajoules from NOAA’s NODC Ocean Climate Lab: http://www.nodc.noaa.gov/OC5/3M_HEAT_CONTENT, with the heat content values converted back to the ocean temperature changes in Kelvin that were originally measured. NOAA’s conversion of the minuscule warming data to Zettajoules, combined with the exaggerated vertical aspect of the graph, has the effect of making a very small change in ocean temperature seem considerably more significant than it is.

Converting the ocean heat content change back to temperature change reveals an interesting discrepancy between NOAA’s data and that of the ARGO system. Over the period of ARGO data, from 2004-2014, the NOAA data imply that the oceans are warming at 0.05 Cº decade–1, equivalent to 0.5 Cº century–1, or rather more than double the rate shown by ARGO.

ARGO has the better-resolved dataset, but since the resolutions of all ocean datasets are very low one should treat all these results with caution.

What one can say is that, on such evidence as these datasets are capable of providing, the difference between underlying warming rate of the ocean and that of the atmosphere is not statistically significant, suggesting that if the “missing heat” is hiding in the oceans it has magically found its way into the abyssal strata without managing to warm the upper strata on the way.

On these data, too, there is no evidence of rapid or catastrophic ocean warming.

Furthermore, to date no empirical, theoretical or numerical method, complex or simple, has yet successfully specified mechanistically either how the heat generated by anthropogenic greenhouse-gas enrichment of the atmosphere has reached the deep ocean without much altering the heat content of the intervening near-surface strata or how the heat from the bottom of the ocean may eventually re-emerge to perturb the near-surface climate conditions relevant to land-based life on Earth.

clip_image024

Figure T7. Near-global ocean temperatures by stratum, 0-1900 m, providing a visual reality check to show just how little the upper strata are affected by minor changes in global air surface temperature. Source: ARGO marine atlas.

Most ocean models used in performing coupled general-circulation model sensitivity runs simply cannot resolve most of the physical processes relevant for capturing heat uptake by the deep ocean.

Ultimately, the second law of thermodynamics requires that any heat which may have accumulated in the deep ocean will dissipate via various diffusive processes. It is not plausible that any heat taken up by the deep ocean will suddenly warm the upper ocean and, via the upper ocean, the atmosphere.

If the “deep heat” explanation for the Pause were correct (and it is merely one among dozens that have been offered), the complex models have failed to account for it correctly: otherwise, the growing discrepancy between the predicted and observed atmospheric warming rates would not have become as significant as it has.

Why were the models’ predictions exaggerated?

In 1990 the IPCC predicted – on its business-as-usual Scenario A – that from the Industrial Revolution till the present there would have been 4 Watts per square meter of radiative forcing caused by Man (Fig. T8):

clip_image026

Figure T8. Predicted manmade radiative forcings (IPCC, 1990).

However, from 1995 onward the IPCC decided to assume, on rather slender evidence, that anthropogenic particulate aerosols – mostly soot from combustion – were shading the Earth from the Sun to a large enough extent to cause a strong negative forcing. It has also now belatedly realized that its projected increases in methane concentration were wild exaggerations. As a result of these and other changes, it now estimates that the net anthropogenic forcing of the industrial era is just 2.3 Watts per square meter, or little more than half its prediction in 1990 (Fig. T9):

clip_image028

Figure T9: Net anthropogenic forcings, 1750 to 1950, 1980 and 2012 (IPCC, 2013).

Even this, however, may be a considerable exaggeration. For the best estimate of the actual current top-of-atmosphere radiative imbalance (total natural and anthropo-genic net forcing) is only 0.6 Watts per square meter (Fig. T10):

clip_image030

Figure T10. Energy budget diagram for the Earth from Stephens et al. (2012)

In short, most of the forcing predicted by the IPCC is either an exaggeration or has already resulted in whatever temperature change it was going to cause. There is little global warming in the pipeline as a result of our past and present sins of emission.

It is also possible that the IPCC and the models have relentlessly exaggerated climate sensitivity. One recent paper on this question is Monckton of Brenchley et al. (2015), which found climate sensitivity to be in the region of 1 Cº per CO2 doubling (go to scibull.com and click “Most Read Articles”). The paper identified errors in the models’ treatment of temperature feedbacks and their amplification, which account for two-thirds of the equilibrium warming predicted by the IPCC.

Professor Ray Bates gave a paper in Moscow in summer 2015 in which he concluded, based on the analysis by Lindzen & Choi (2009, 2011) (Fig. T10), that temperature feedbacks are net-negative. Accordingly, he supports the conclusion both by Lindzen & Choi (1990) (Fig. T11) and by Spencer & Braswell (2010, 2011) that climate sensitivity is below – and perhaps considerably below – 1 Cº per CO2 doubling.

clip_image032

Figure T11. Reality (center) vs. 11 models. From Lindzen & Choi (2009).

A growing body of reviewed papers find climate sensitivity considerably below the 3 [1.5, 4.5] Cº per CO2 doubling that was first put forward in the Charney Report of 1979 for the U.S. National Academy of Sciences, and is still the IPCC’s best estimate today.

On the evidence to date, therefore, there is no scientific basis for taking any action at all to mitigate CO2 emissions.

Finally, how long will it be before the Freedom Clock (Fig. T11) reaches 20 years without any global warming? If it does, the climate scare will become unsustainable.

clip_image034

Figure T12. The Freedom Clock edges ever closer to 20 years without global warming

0 0 votes
Article Rating
223 Comments
Oldest
Newest Most Voted
Inline Feedbacks
View all comments
Craig
September 4, 2015 2:18 pm

At the end of the day, the Royal Society (Eric Worrel bought this up) simply won’t care whether it’s 18 yrs and 8 months or 30 yrs and 8 months, if the trend doesn’t extend out to 50 years, then whatever the evidence may be, it simply won’t matter!
These warmies have their minds made up and to the hell with science and in 50 years time, it won’t matter to anybody writing on the topic today as most of us will be dead and pushing up daisies.

brians356
Reply to  Craig
September 4, 2015 2:27 pm

Many more us will be pushing up daisies than need be, owing to the degradation of billions of folks’ standards of living from the artificially-forced increases in the real cost of energy and food.

Reply to  brians356
September 5, 2015 5:46 pm

100%

Jeff
Reply to  Craig
September 4, 2015 3:23 pm

As if there would be daisies … :).

MarkW
Reply to  Craig
September 4, 2015 3:23 pm

When we get to 50 years, they will proclaim that we need to wait 100 years, just to be sure.

Reply to  Craig
September 4, 2015 9:53 pm

It would not take 50 years to get a pause of 50 years…just for the temp to go down to where it was 50 years ago. This could happen in a few years if we have the opposite of what occurred in 1998.

David A
Reply to  Menicholas
September 5, 2015 3:18 am

Yes, indeed!!

Reply to  Craig
September 5, 2015 3:21 am

It’s amazing how short the ‘duration’ has to be however, for a natural phenomenon to attract the moniker ‘affected by climate change’.

CodeTech
September 4, 2015 2:22 pm

“Tamperature”… my new favorite word…

Bryan
Reply to  CodeTech
September 4, 2015 5:41 pm

Excellent.

Reply to  CodeTech
September 4, 2015 8:49 pm

+1

kim
Reply to  CodeTech
September 5, 2015 3:05 am

Temperasure. Nope, kim, way inferior to tamperature.
===========

ozspeaksup
Reply to  CodeTech
September 5, 2015 4:11 am

yeah, Love it! sadly so true. +++ to Monckton;-)

Mick
September 4, 2015 2:25 pm

Now THAT is a scary prediction! Because it’s true.

Bruce Cobb
September 4, 2015 2:32 pm

It’s the Pause that refreshes.

September 4, 2015 2:36 pm

To me the Freedom Clock is reading 18 years and 7 months…

Reply to  Jimmy Haigh
September 4, 2015 2:43 pm

There are 12 months per year – so the half way mark is 6 months. That, plus the 2 does the trick.

September 4, 2015 2:39 pm

Do the surface records date back to the 18th century?
Or do they only date back to the incorporation of Karl et al 2015?
I’ll believe this year is a record if we date the record back only to the beginning of the new methodology.

Jeff Mitchell
September 4, 2015 2:47 pm

At the end of the post, the clock is noted to be graph T11, when it is actually T12. Also, predicting the scare will go away at 20 years may just be wishful thinking. As the old song says “Whatever will be will be”. So lets keep putting that plant food in the air, feed lots of people, and quit trying to energy starve the people in the under developed countries.

Reply to  Jeff Mitchell
September 4, 2015 4:26 pm

It is not just in underdeveloped countries. Energy starvation hits high-latitude regions in winter too.

September 4, 2015 2:54 pm

“… no warming for 18 years 8 months”
This is a meaningless small period of time compared to the wants and needs of the control freaks in the government. I wager that Monckton could get up to 50 years and the scam would keep on keeping on. Dogma is hard to slay.

Gloria Swansong
September 4, 2015 2:57 pm

Summarizing the post-war period of monotonous rise in CO2:
1. 1945-77: 32 years of extreme cooling, despite rapidly rising CO2;
2. 1978-96: 18 years of slight warming, under still rising CO2, and
3. 1997-2015: 18 years of flat temperature, but cooling slightly for 11 years, despite even more rapidly rising CO2.
Hence, for 50 of the past 70 years, the world has cooled or stayed the same despite rapidly rising CO2.
QED, AGW is falsified.

Editor
Reply to  Gloria Swansong
September 4, 2015 3:18 pm

Please stop quoting facts, Gloria.
My brain hurts!

Gloria Swansong
Reply to  Paul Homewood
September 4, 2015 3:30 pm

Facts do not compute!
1. Rising CO2, cooling earth.
2. Rising CO2, warming earth.
3. Rising CO2, cooling earth.
Mother Nature is trying to tell us the truth, if only climastrologists would listen.

geran
Reply to  Gloria Swansong
September 4, 2015 3:32 pm

“QED, AGW is falsified.”
_________
I’ll go one step further, Gloria. The “GHE” is also falsified. (But, with apologies to “Lukerwarmers”, science falsified that years ago!)

Bart
September 4, 2015 3:04 pm

I recently noticed that almost all of the recently claimed temperature increase in the surface data is in the Northern hemisphere. Southern hemispheric data look very much like the satellite data. This
A) kind of takes the “global” out of “global warming”
B) suggest monkeyshines with the NH data in particular

Hivemind
Reply to  Bart
September 4, 2015 3:21 pm

Not really. The Australian Bureau of Meteorology has been playing “monkeyshines” with the Australian temperature record too.
Warming in the north, while cooling in the south may be a natural effect. You can see it in the way ice packs grow in one hemisphere, while shrinking in the other. Then it reverses.

Bart
Reply to  Hivemind
September 4, 2015 4:27 pm

Look at the plot. It apparently wasn’t “natural” for at least 100 years where the hemispheres moved in lock step, but since 2000 they’ve diverged considerably.
I suspect it is the very dodgy extrapolation over the North Pole they started doing. But, that started failing to provide the representation of warmth needed after 2005, so they got Karl’s kluge to help them boost it back up again. How long that will last them is anyone’s guess. Who knows what flail they will come up with next?
It’s obviously past the point, thought, where the surface numbers are basically just made up.

September 4, 2015 3:13 pm

Maybe “the pause” would end if we burned a few more tree rings….?

Editor
September 4, 2015 3:17 pm

The claim of cherry picking 1998 as the start point is misdirection anyway. The double La Nina of 1999/2000 effectively cancelled it out, as the UK Met Office admit.
The start of the current pause is difficult to determine precisely. Although 1998 is often quoted as the start of the current pause, this was an exceptionally warm year because of the largest El Niño in the instrumental record. This was followed by a strong La Niña event and a fall in global surface temperature of around 0.2oC (Figure 1), equivalent in magnitude to the average decadal warming trend in recent decades. It is only really since 2000 that the rise in global surface temperatures has paused.
https://notalotofpeopleknowthat.wordpress.com/2015/04/10/the-global-temperature-standstill-simply-explained/
Since 2001 of course satellites actually show a cooling trend!
https://notalotofpeopleknowthat.wordpress.com/2015/04/10/the-global-temperature-standstill-simply-explained/

richard verney
Reply to  Paul Homewood
September 5, 2015 2:40 am

And for the period prior to the Super El Nino being mentioned by the UK Met Office, say 1979 to 1996, the satellite data shows no warming.
The satellite data shows no first order correlation between rising CO2 and rising temperatures. It spans a period of some 35 years, during which there is a one off and isolated warming event, in the run up to and the subsequent consequences of the 1998 Super El Nino which released approximately 0.25degC of heat into the atmosphere that has not yet dissipated.
The inconvenient fact to CAGW is that the satellite data shows no warming between 1979 and say 1996, and no warming post 1998 to date. It is entirely inconsistent with the conjecture of CO2 induced global warming.
A number of issues remain, First, how good is the data set, and is it fit for the purpose to which it is being sought?
Second, what are the error bounds? This is material since we cannot detect and eek out the signal of CO2 from the noise of natural variation. If the error bounds are small, any signal to CO2 must be similarly small. If the error bounds are wide, then possibly the signal to CO2 could be large, but has not been found due to the insensitivity and noise of our best measuring devices.
Third, why has the about 0.25degC of temperature that was released into the atmosphere as a consequence of the 1998 Super El Nino not yet been dissipated? When will it be dissipated and, if it is, what will be the cause of that dissipation?

Neville
September 4, 2015 3:44 pm

In July Ken Stewart calculated the pause for all the regions using UAH V 6 data. Even the nth polar region showed no warming for over 13 years, OZ over 17 years, USA over 18 years etc and the south polar region no warming for over 35 years. Here’s the link————–
https://kenskingdom.wordpress.com/2015/07/09/pause-update/

richard verney
Reply to  Neville
September 5, 2015 2:49 am

Also there has been little warming in the tropics.
Climate is regional, not global.
The global mantra is a sc*m, and does not reflect the reality that different parts of the globe are responding differently; some warming, some cooling, and some showing little if any change.
Further, for some warming will be a god send, and for others it will cause little if any problem. In practice, the biggest challenge presented would be sea level rise (assuming that this is more than the about 1 to 3mm annual rise which is currently our best estimate of sea level rise).
There will be winners and losers. Heck, even sea level rise does not impact upon all countries in the same manner since some countries have no coastal boarders, and others (such as Norway) have high rising cliffs and not shallow river estuaries deltas..
The ‘global’ part of the mantra is political and not scientific, and is put forward to support the argument that we a re all in it together, we need a global response with worldwide laws and restrictions, ie., global government. ,

milwaukeebob
September 4, 2015 3:55 pm

The Great Pause has pilloried The Great Duplicity. But what future generations will call this will be: The Great Waste. Not just the money. As a matter of fact the money is but a fragment of The Great Waste of human enterprise and capacity.
I understand the decadent minds of the environmental scalawags guzzling at the government/foundation money trough, but it astounds the intellect that principled minds of science continue to grovel at the feet of political chauvinists for a few “pieces of silver” to perpetuate their existence surely, but in the end do nothing more than WASTE their education and talent.
What a shame they cannot see “the man in the mirror” for what it is but also the vast forfeiture of what could have been accomplished.

Neville
September 4, 2015 4:02 pm

And just to add to their confusion about mitigating co2 impacts after Paris in December, the Royal Society and NAS report states there is zero we can change for thousands of years. BTW this states there is zero we can change even if we stopped all co2 our emissions today. So who to believe???? Here’s the link with graphs etc. ———–https://royalsociety.org/topics-policy/projects/climate-evidence-causes/question-20/
Here’s point 20 of the report————
20. If emissions of greenhouse gases were stopped, would the climate return to the conditions of 200 years ago?
Climate change: evidence and causes
No. Even if emissions of greenhouse gases were to suddenly stop, Earth’s surface temperature would not cool and return to the level in the pre-industrial era for thousands of years.
fig9-smallFigure 9. If global emissions were to suddenly stop, it would take a long time for surface air temperatures and the ocean to begin to cool, because the excess CO2 in the atmosphere would remain there for a long time and would continue to exert a warming effect. Model projections show how atmospheric CO2 concentration (a), surface air temperature (b), and ocean thermal expansion (c) would respond following a scenario of business-as-usual emissions ceasing in 2300 (red), a scenario of aggressive emission reductions, falling close to zero 50 years from now (orange), and two intermediate emissions scenarios (green and blue). The small downward tick in temperature at 2300 is caused by the elimination of emissions of short-lived greenhouse gases, including methane. Source: Zickfeld et al., 2013 (larger version)
If emissions of CO2 stopped altogether, it would take many thousands of years for atmospheric CO2 to return to ‘pre-industrial’ levels due to its very slow transfer to the deep ocean and ultimate burial in ocean sediments. Surface temperatures would stay elevated for at least a thousand years, implying extremely long-term commitment to a warmer planet due to past and current emissions, and sea level would likely continue to rise for many centuries even after temperature stopped increasing (see Figure 9). Significant cooling would be required to reverse melting of glaciers and the Greenland ice sheet, which formed during past cold climates. The current CO2-induced warming of Earth is therefore essentially irreversible on human timescales. The amount and rate of further warming will depend almost entirely on how much more CO2 humankind emits.

David A
Reply to  Neville
September 5, 2015 3:31 am

The only rational respond to such assertions is…
“Science is the belief in the ignorace of experts.”

Chris in Hervey Bay
September 4, 2015 4:24 pm

“One-third of Man’s entire influence on climate since the Industrial Revolution has occurred since January 1997.”
I would suggest that, Man has no influence on climate, at all !

Bartemis
Reply to  Chris in Hervey Bay
September 4, 2015 4:29 pm

In all fairness, 1/3 of nothing is nothing.

Gloria Swansong
Reply to  Chris in Hervey Bay
September 4, 2015 4:30 pm

Better to say one third of the estimated human contribution to atmospheric CO2.

BCBill
September 4, 2015 4:35 pm

It has been unseasonably cold where we should be experiencing El Nino warm. I predict an early demise to the current El Nino. Anybody want to place guesses?

jorgekafkazar
Reply to  BCBill
September 4, 2015 8:19 pm

That would be a truly scary thing.

noaaprogrammer
Reply to  BCBill
September 4, 2015 8:26 pm

Recently, small typhoons in the mid Pacific have been trying to cool it down a bit – but nothing major yet.

bit chilly
Reply to  BCBill
September 5, 2015 4:03 am

i have been saying this for over a year now bill. if you think the so called surface temperatures are overly optimistic start looking at sea surface temperatures in your local area if you live near the coast. north sea 3 degrees cooler than this time last year. amo heading cold big time.
noaa give positive anomalies for the sea of cortez,yet the cold water bait fish appearing there now, and the people that run the charter fishing boats will tell you the reality is somewhat different.
if you know any commercial fishermen that travel the oceans ask them what they are seeing and it is not a developing el nino. my family has a home in the philippines ,zero indication of el nino conditions there either.i cannot understand how there is so much criticism of land surface temperature series on many blogs, yet very little of ocean temps, where the issues in deriving an accurate temperature are an order of magnitude greater than over land.
i am beginning to think all the talk of a ” a large el nino” is purely to give vrious agencies the la nina get out when even the best mathematician can no longer come up with an algorithm to hide the cooling.

Chris
Reply to  bit chilly
September 5, 2015 9:34 pm

Well, the Philippines government has a different opinion: http://www.channelnewsasia.com/news/asiapacific/philippines-braces-for/2103586.html

john
Reply to  bit chilly
September 6, 2015 3:05 pm

perhaps you are unaware that for the first time ever there are 3 super typhoons present at once 2 cat 4 and 1 cat 5

Expat
Reply to  BCBill
September 6, 2015 9:51 am

It’s been hot as hell this past week here in the upper Mississippi valley. It’s obviously due to global warming. Plus, the meadow out front is growing too fast for the critters to keep down. That extra 100ppm of CO2 is to blame.
All you deniers are to blame and we’re all doomed.

September 4, 2015 4:45 pm

Thanks, Christopher, Lord Monckton. A very detailed and complete examination of the available data.
This “collective illusion”, this global warming mirage that supposedly produces accelerated climate change is based on sparely located thermometers around the globe, while dismissing the continuous lower troposphere coverage of satellites.

Werner Brozek
September 4, 2015 4:56 pm

UAH v. 5.6

I believe that should be UAH6 above and below Figure 3 to agree with the graph.

u.k.(us)
September 4, 2015 5:03 pm

“However, the year or two after an el Niño usually – but not always – brings an offsetting la Niña, cooling first the ocean surface and then the air temperature and restoring global temperature to normal.”
===============
Nice caveat, always best to not tempt the temptress.

Peter Sable
September 4, 2015 6:23 pm

No auto regression? I’ve only looked at GISS monthly but it’s got requires ar1 and ar2 to have residuals above 95% confidence.
Willis has also seen something like this. Willis?

Reply to  Peter Sable
September 5, 2015 5:11 am

Regional temperatures exhibit strong autocorrelation, global temperatures not.

Reply to  Monckton of Brenchley
September 5, 2015 8:40 am

Monckton of Brenchley September 5, 2015 at 5:11 am
Regional temperatures exhibit strong autocorrelation, global temperatures not.

Christopher Monckton,
I take it that you are not implying that global temperatures exhibit no autocorrelation.
John

Peter Sable
Reply to  Peter Sable
September 8, 2015 7:51 am

I have looked at HadCrut 4.4. global. It exhibits almost the same AR1 and AR2 auto regression as GISS release 2015-06. . Kind of makes sense, the current temperature is pretty dependent on the previous month/day/year’s temperature. (okay I didn’t check yearly yet… maybe that’s it?).
I follow this procedure here:
https://onlinecourses.science.psu.edu/stat510/node/33
and get the following result: AR1= 0.55, AR2 = 0.27, with confidence better than 95%.
Since that’s nearly the same result as with GISS, my assumption is the satellite monthly temperatures will yield the same result. Maybe it’s the yearly average that doesn’t exhibit autocorrelation?
Peter

pat
September 4, 2015 6:39 pm

extraordinary how the much-touted satellite data has been expunged from the CAGW narrative,
a brief PAUSE in the “climate talks”, after Bonn fails, and everyone is thrown under the bus…down the road!
original AFP headline: “UN climate talks kick can down the road” Bonn (AFP) 9 hours ago.
guess that was considered too negative?
5 Sept: AFP: New strategy to boost flagging climate talks
Bonn (AFP) – As a December deadline looms, diplomats wrangling over the text of a climate rescue pact kicked the can further down the road Friday, frustrated at their own lack of progress.
On the final day of a crucial negotiating round in Bonn, delegates turned to the joint chairmen of the UN forum for help in editing the unwieldy blueprint into a more manageable format.
The duo, Algeria’s Ahmed Djoghlaf and Daniel Reifsnyder of the United States, promised to have a streamlined version ready in time for the next round of Bonn talks from October 19-23…
“We have only ***1,800 minutes to agree on the draft package for Paris,” Djoghlaf said. “Every minute has value.”
The pair also announced that a dedicated “drafting committee” will be created to start work as soon as negotiators reassemble…
“Heads of state who care about their children should be angry with their negotiators,” Greenpeace climate policy director Martin Kaiser said of the Bonn outcome…
https://au.news.yahoo.com/world/a/29436695/un-climate-talks-kick-can-down-the-road/
***it’s down to “minutes” and “inches” now!
4 Sept: RTCC: UN climate talks ***inch forward as countries agree path to Paris
Co-chairs at Bonn conference to draft new negotiating text for global deal – set for release in first week of October By Ed King in BonnWork on building a global climate deal showed progress on the final day of a UN conference in Bonn, with officials chairing the process revealing they would release a new, slimmer draft text in early October.
Dan Reifsnyder, a State Department diplomat co-chairing the talks told reporters the proposed new text would be “coherent, concise, and comprehensive”…
Most observers RTCC spoke to said the document as it stood was not suitable but few countries at this week’s talks have offered a sense of how the text could be radically slashed in time for a December summit where a deal is set to be signed off.
Reifsnyder said progress had been made on clarifying the general objectives of the deal but admitted talks on who will provide climate finance and adaptation were complex…
WWF climate talks expert Tasneep Essop said news countries would allow the co-chairs to craft a text was a sign of the ***trust they had built with countries since taking control of talks in January…
http://www.rtcc.org/2015/09/04/un-talks-inch-forward-as-countries-agree-path-to-paris/

Matt G
September 4, 2015 6:55 pm

What is confusing about the ENSO for people is the inability to understand how El Nino’s give a short lower atmospheric boost increase (years), but lower the energy content of especially the planets tropical oceans in top 300-400 m. There is a theory that increasing the number of stronger El Nino’s actually cause cooling of the planet in longer term and this has been backed up with scientific evidence using how the ENSO behaved in the past.
http://www.nature.com/nature/journal/v424/n6946/abs/nature01779.html
“The most intense ENSO activity within the reconstruction occurred during the mid-seventeenth century.”
Therefore we have the most and strongest El Nino’s occurring during the Little Ice Age while the solar cycle was at it’s least active. That would make sense with all the energy lost from the oceans to the atmosphere and eventually being lost to space in the long term. While the sun’s activity has been declining over recent decades we have actually seen an increase in the number and strength of El Nino’s.
Further evidence?
Using the UK as an example the pattern in weather that relates there more common with strong El Nino’s, matches that of the last Little Ice age. A medium/strong El NIno affecting the UK normally leads to more zonal summer and less zonal winter. Where the jet stream is further north when more zonal and further south when less zonal. Even then the temperature divergence in the North Atlantic ocean still mainly dictates the outcome, with the ENSO either joining forces or counteracting this general trend.
Hence, a future decline in solar activity may well lead to further increase and intensity of El Nino’s still within the cycle of the PDO. Meaning the negative PDO phase becomes less negative and the positive PDO phase after this more positive.
What will happen to future global temperature?
Will depend on how much energy lost in the top ocean 300-400 m compared to how much the lower atmosphere warms by future El Nino’s on short term. Quieter sun with lower UV levels should help cause overall energy loss with intense ENSO period and pattern towards less zonal northern hemisphere especially during winter.

Khwarizmi
Reply to  Matt G
September 4, 2015 7:36 pm

Therefore we have the most and strongest El Nino’s [in a reconstruction] occurring during the Little Ice Age”
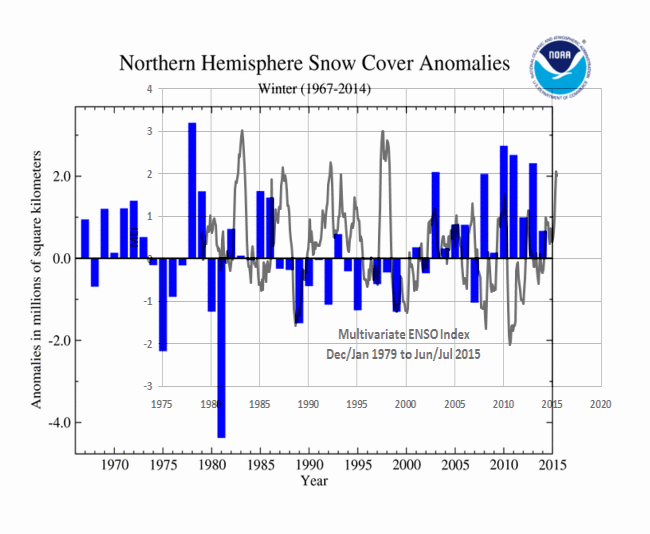
==========
The “global warming” years attributed to carbon dioxide by the modern cult occurred throughout the 80’s and 90’s, correlating with an increased magnitude and frequency of El Nino.
The increase in snow and ice starting around 2000 correlates with increased magnitude and frequency of La Nina.comment image
It therefore seems unlikely that El Nino was the dominant pattern during the little ice age.

Matt G
Reply to  Khwarizmi
September 5, 2015 6:51 pm

[The “global warming” years attributed to carbon dioxide by the modern cult occurred throughout the 80’s and 90’s, correlating with an increased magnitude and frequency of El Nino.
The increase in snow and ice starting around 2000 correlates with increased magnitude and frequency of La Nina.]
I agree with this except the snow and ice increase wasn’t caused by the frequency of La Nina. That is expected when the atmosphere warms first from losing energy from the ocean before it gets chance to show cooling once it has been removed. The pause has been an example of this energy lost from previous El Nino’s preventing further warming.
There were 3 La Nina’s in 1970’s, 2 La Nina’s in 1980’s, 2 La Nina’s in 1990’s and 3 La Nina’s in 2000’s. Compared to 4 El Nino’s in 1970’s, 2 El Nino’s in 1980’s, 3 El Nino’s in 1990’s and 4 El Nino’s in 2000’s. Notice the least global warming or cooling occurred during the 1970’s and 2000’s when the most El Nino’s had occurred.
Top 10 (only recent first order, most snow extent)
2013 – Neutral (previous winter La Nina)
2011 – La Nina (previous El Nino)
2010 – El Nino (previous neutral)
2008 – La Nina (previous El Nino, neutral end)
2003 – El Nino (previous neutral)
1986 – Neutral previous La Nina)
1985 – La Nina (previous neutral)
1979 – Neutral (previous El Nino, neutral end)
1978 – El Nino, neutral end (previous El Nino)
1972 – La Nina, neutral end (previous La Nina)
There is no one ENSO mode that is dominate during the most snow extent years. El Nino’s and La Nina’s are featured equally either during that winter or the year before.
“It therefore seems unlikely that El Nino was the dominant pattern during the little ice age.”
It also seems unlikely that maybe true, when past reconstructions have found them and no one ENSO mode dominates winter snow extent. Additionally the least warming or cooling occurred during the recent decades when there were the most El Nino’s.

Khwarizmi
Reply to  Khwarizmi
September 6, 2015 1:55 am

Notice the least global warming or cooling occurred during the 1970’s and 2000’s when the most El Nino’s had occurred.
============
http://www.esrl.noaa.gov/psd/enso/mei/ts.gif
La Nina (blue) was deep, enduring and dominant in the first half of the 70’s, corresponding with more ice and snow, and a global cooling scare:
= = = = = = = =
Time Magazine
Monday, Jun 24, 1974
Another Ice Age?
= = = = = = = =
El Nino (red) dominated during the 80’s and 90s corresponding with less ice and snow, and a global warming scare.
http://lh3.googleusercontent.com/-sIaHkRvwGYY/VI2HpoiU4mI/AAAAAAAAAkk/zWCaGu9MG1I/s800-Ic42/keep-winter-cool.jpg
Note the endurance and magnitude of events, not just the number.

Matt G
Reply to  Khwarizmi
September 6, 2015 12:35 pm

La Nina (blue) was deep, enduring and dominant in the first half of the 70’s, corresponding with more ice and snow, and a global cooling scare:
= = = = = = = =
Time Magazine
Monday, Jun 24, 1974
Another Ice Age?
= = = = = = = =
El Nino (red) dominated during the 80’s and 90s corresponding with less ice and snow, and a global warming scare.
Note the endurance and magnitude of events, not just the number.
—————————————————————————-
The magnitude of events do determine if there will be any noticeable short term responses to the lower atmosphere from the upper ocean. The ENSO lags the trend in the upper ocean 300 m in the same region confirming this.
The UK had mild winters during first half of the 1970’s being zonal with La Nina. What you are demonstrating are the short term affects of the ENSO, the longer term ones are what happened decades later.
There are three scenario’s to consider:-
1) If La Nina’s actually cool the planet (not just the lower atmosphere) then why did global temperatures soon warm up after a short period of stronger magnitude of longer endurance events?
2) If El Nino’s actually warm the planet long term (not just the lower atmosphere and ocean surface) then why did global temperatures soon cool down and hence the pause now?
3) The El Nino’s during the 1980’s and 1990’s only warmed the planet later due to the heat sink occurring during previous La Nin’a over the 1970’s and earlier. This was released by the El Nino’s warming the lower atmosphere and ocean surface until it’s eventually lost to space. This excess was mainly lost so during the 2000’s the El Nino’s had little effect. When this excess heat has been lost to El Nino’s, further El Nino’s without sufficient top up (La Nina) will cause the planet to cool.
Despite the initial influence they had on the lower atmosphere, there influence is generally nowhere to be seen later with the exception of super strong El Nino’s. Four El Nino’s after the super 1998/99 event had no influence in warming the planet after.
“In the late 13th and the early 17th century temperatures in the Northern Hemisphere were rather cool but El Niño activity was high.”
“In contrast to the maximum El Niño activity in the second (Figure 11e) and third (Figure 6c) millennium B.P., El Niños were persistently weak between 800 and 1250 A.D. (late medieval period).”
“At the beginning of the YD period, the strongly increased bioproductivity and reduced SST support a strongly enhanced nutrient flux and weak El Niños that are followed by stronger El Niño activity during the later YD” The YD was at it’s coldest later in the events, but of course there is a lot more than just ENSO to try and help explain the very significant changes in climate.
http://onlinelibrary.wiley.com/doi/10.1029/2004PA001099/full

Matt G
Reply to  Khwarizmi
September 6, 2015 12:48 pm

“Four El Nino’s after the super 1998/99 event…”
Sorry should be 1997/98 event.

warrenlb
September 4, 2015 7:13 pm

Another paper by a classics major who’s never published in a peer reviewed journal. Should we believe it, anymore than we should accept his Lordship claim?

warrenlb
Reply to  warrenlb
September 4, 2015 7:24 pm

Or his claim to have invented cures for Graves’ disease, Aids, and the common cold?

John Kernan
Reply to  warrenlb
September 4, 2015 7:38 pm

Monckton is the Marty Feldman of the climatolgy world.

Very funny but harmless
[perhaps you are making fun of the fact that both men have the same affliction, Graves Disease, if so, shame on you – Anthony]

sunsettommy
Reply to  warrenlb
September 4, 2015 9:08 pm

Still waiting for your counterpoint to the Viscounts blog post.

bit chilly
Reply to  warrenlb
September 5, 2015 4:09 am

look at global ocean temperatures ,lots of cold anomalies despite many areas being misrepresented on the noaa map with positive anomalies. there will be no hiding place for those of a cagw persuasion within the next few years, never mind the royal societies 50 years .

MarkW
Reply to  warrenlb
September 5, 2015 12:08 pm

sunsettomy: Be prepared to wait a long time.

Stephen Richards
Reply to  warrenlb
September 5, 2015 12:16 pm

Critique the paper. You just show us what a clown you are by not detailing your technical objections to the post. There is an expression that goes something like ‘we thin you are an idiot why open your mouth and confirm it’

jones
Reply to  warrenlb
September 4, 2015 7:39 pm

Hi Warren,
You never did get back to me with that citation concerning Steyn. Or have you moved on?
Andy.

Reply to  jones
September 4, 2015 8:00 pm

jones,
warrenlb doesn’t do facts and measurements. He only does his Appeal to Authority fallacy and his baseless assertions.
If he had measurements to support his argument, he’d post them, no?

warrenlb
Reply to  jones
September 5, 2015 8:09 am


Here you go: http://climate.nasa.gov/evidence/
Although I expect you ‘don’t do’ evidence because it doesn’t support your pre-conceived conclusions.

MarkW
Reply to  jones
September 5, 2015 12:09 pm

Not just appeal to authority, but he gets to declare who is who isn’t an authority. Based from I have been able to determine on nothing more how completely the sources agree with him.

Gloria Swansong
Reply to  jones
September 5, 2015 12:14 pm

warrenlb
September 5, 2015 at 8:09 am
Every single one of those supposed evidences for AGW is demonstrably false and/or not caused by man-made CO2.
Is that the best you have? Seriously?
Pathetic.

Reply to  jones
September 5, 2015 3:43 pm

warrenlb says: Here you go: … followed by a link to NASA — a link which does not say what warrenlb claims.
The NASA link quotes the IPCC: Scientific evidence for warming of the climate system is unequivocal.
That says nothing at all. It is a meaningless scare tactic, intended to distract from the fact that the IPCC still cannot quantify AGW. We all know the planet is emerging from the Little Ice Age, the second coldest episode of the entire 10,000+ year Holocene. Yes, scientific evidence for warming of the climate system is unequivocal. So what? It is a leap of faith to presume that warming is because of human CO2 emissions. Where are the measurements?
The link goes on to make assertions like this:
The current warming trend is of particular significance because most of it is very likely human-induced and proceeding at a rate that is unprecedented in the past 1,300 years.
“Likely”? That is merely an opinion; a conjecture. Again, neither NASA, the IPCC, nor anyone else has produced any measurements supporting that statement. It goes on to list the usual scare stories — every one of which has been either shown to be based on highly questionable cherry-picking, or completely debunked.
That’s all they’ve got, and none of it measures the putative fraction of man-made global warming (MMGW), out of all warming including the natural recovery from the LIA.
Thus, warrenlb has zero credibility, because his statements are invariably wrong and his links do not support what he believes. One more example, this time a personal attack against Lord Monckton with the usual dose of warrenlb’s appeal to authority fallacy:
Another paper by a classics major who’s never published in a peer reviewed journal.
That’s provably wrong, warrenlb. And since you’re so fixated on peer reviewed journals, and because Lord Monckton’s publication has never been refuted, then by your own peculiar logic you must accept his conclusions. Or, do you just cherry-pick the papers that support your confirmation bias?
warrenlb is no different from Dr. Leon Festinger’s ‘Seekers’, who waited eagerly for the flying saucer to come and save them. Or the Rev. Harold Camping’s religious true believers, when he predicted that the end of the world would arrive on a specific date. When those events failed to happen, did they admit they were simply wrong?
No. Instead, they doubled down, and became even more convinced that they were right — and that everyone else was wrong. warrenlb is exactly like those people. Readers here have proven beyond any doubt that warrenlb’s beliefs are flat wrong. There is no “dangerous” global warming happening, as he has repeatedly asserted. In fact, there is nothing either unprecedented or unusual happening.
It is amusing watching warrenlb trying to convince everyone he’s right and they are wrong, just as it was amusing watching the Rev. Camping’s followers accept his assurance that the end of the world had simply been delayed. Or reading about Festinger’s ‘Seekers’ selling all their worldly goods and waiting for the flying saucer to come on a new date.
There is no flying saucer, and there never was. Just like the ‘Seekers’, warrenlb will never admit it, but there is no “dangerous” global warming, either. And there never was.

Reply to  jones
September 5, 2015 3:57 pm

[Snip. David, please use your real name. ~mod.]

Gloria Swansong
Reply to  jones
September 6, 2015 4:43 pm

Here are the nine “evidences” of man-made “climate change” cited by NASA and linked by Warren:
1. Sea level rise. Not rising any faster than since the end of the LIA.
2. Global temperature rise. Hasn’t risen for going on 20 years or more.
3. Warming oceans. Not.
4. Shrinking ice sheets. Not.
5. Declining Arctic sea ice. Decline has ended. Antarctic sea ice setting records.
6. Glaciers retreating. If true (doubtful, as some are and some aren’t), not in any way connected with human activity, as they started retreating after the end of the LIA, during which they grew.
7. Extreme weather. Not more extreme now than during the cooling of the late ’40s to ’70s and warming of the late ‘teens to forties.
8. Ocean acidification. Not acidifying. More CO2 comes out of the oceans under warmer conditions.
9. Decreased snow cover. Not. Snow cover is growing.
I’ll repeat. This is all you have, Warren?
Pathetic.

sunsettommy
Reply to  warrenlb
September 4, 2015 9:07 pm

Another comment by a classless troll,who never published a cogent comment in any blog he visits.
Should skeptics believe it,anymore than skeptics believing Warren is a rational warmist?

richardscourtney
Reply to  warrenlb
September 4, 2015 9:45 pm

warrenlb
Nobody should believe assertions of His Lordship, of you or of anybody else.
Instead, people should consider comments and try to fault them irrespective of who provides them.
I cannot fault the above essay by Lord Monckton and you do not say you can find one either. But you make ad hom. denigrations of Lord Monckton, and those denigrations could deflect discussion from the essay. That is very strong evidence of you knowing the above essay by Lord Monckton is right and you not liking the fact that the essay is right.
Richard

Reply to  richardscourtney
September 5, 2015 3:20 am

Richard,
I agree with your assessment of Warren the Troll, but we do have to give him credit for one thing. He no longer tries to discredit Monckton over the “Lord” issue. So there is a tiny bit of evidence that Warren can learn. (very tiny indeed)
~ Mark S.

warrenlb
Reply to  richardscourtney
September 5, 2015 4:25 am

@richardscourtney
LMs analyses have been picked apart so many times by credentialed scientists that anyone who supports his funny business is either not a scientist, or is only interested in his conclusion, not whether or not it’s valid. What I object to is his ongoing pattern of misrepresentation, both on his resume and in his work. An earlier post referred to LM as harmless. I don’t consider such purposeful mischief harmless.

David Smith
Reply to  richardscourtney
September 5, 2015 4:30 am

Should we believe it, anymore than we should accept his Lordship claim?

Sorry Mark, the odious Warren has still tried to have a pop at Lord Monckton’s title.
Why are the warmunists so obsessed with his title? Are they jealous? I’ve never seen Chris try to use his title as some sort of appeal to authority.

David Smith
Reply to  richardscourtney
September 5, 2015 4:33 am

Come on then Warren, why don’t YOU pick it apart? Better yet, give us the empirical evidence that CO2 levels cause atmospheric warming (and no, CO2 in glass tubes in a lab do not represent the real world).

David Smith
Reply to  richardscourtney
September 5, 2015 4:37 am

Oh, one more thing Warren:
Where are the 50 million climate refugees? They don’t seem to be wandering the Earth right now. Just a lot of people fleeing the evil of radical Islamism.

warrenlb
Reply to  richardscourtney
September 5, 2015 7:48 am

Smith
You say, “..give us the empirical evidence that CO2 causes global warming…”
Here you go: http://www.skepticalscience.com/empirical-evidence-for-co2-enhanced-greenhouse-effect-advanced.htm

MarkW
Reply to  richardscourtney
September 5, 2015 12:11 pm

David: They focus on his Lordship’s title because it is a convenient way to derail the conversation.
If we are arguing over the legitimacy of his title, then we aren’t dealing with the science that was presented.

MarkW
Reply to  richardscourtney
September 5, 2015 12:13 pm

Now that’s funny, warren once again whines about his Lordship’s lack of a scientific degree, then as proof of his position he cites something from a site run by a cartoonist.

Gloria Swansong
Reply to  richardscourtney
September 5, 2015 12:18 pm

Chris’ title isn’t in doubt. He is indubitably a legitimate Viscount, as were his dad and granddad before him.
The issue is his membership in the House of Lords.

warrenlb
Reply to  richardscourtney
September 5, 2015 5:46 pm

@Gloria Swansong…
[Snip. Enough commentary on whether Lord Monckton is or isn’t a British Lord. ~mod.]

Reply to  richardscourtney
September 6, 2015 8:48 am

Well spoken, Richard Courtney!

Reply to  richardscourtney
September 6, 2015 9:43 pm

“What I object to is his ongoing pattern of misrepresentation, both on his resume and in his work.”
But what does your cat think, Warren?
As you have made us all aware, he is the real brains behind your collective operation.

Reply to  warrenlb
September 5, 2015 7:56 am

Chris is presenting data collected from the AMSU instrument. Please explain what is wrong with that data?
If you can’t do that, no one cares what you think about his background just as no one cares about yours or what you’ve done in your life. It seems from reading your posts that you can contribute nothing to the dialogue. Unless you can do better than fling child-like insults, please do the rest of us a favour and take it elsewhere. You contribute nothing and demonstrate yourself to be a worthless mind.

Reply to  warrenlb
September 5, 2015 10:04 am

warrenlb: I looked at the Skeptical science arguments, but they all appear to be theoretical analyses regarding what could occur if all the underlying assumptions are correct. Where is the actual rebuttal to Lord Moncton’s case which is not based on theory, but actual measurements of real world conditions? As a lay person I would have to conclude that the various published papers Skeptical Science cites fail to reflect actual conditions, but are merely stringing together various scientific principles which sound impressive when looked at separately, but when woven together, present an ultimately false conclusion. To a lawyer like me this sounds a lot like the classic: “…baffle them with bull s**t”.
If Moncton is so obviously incompetent as you say, why is it so hard to rebut his very straight forward analysis? Please take the time to point out which specific statements in the above blog are false and the specific reason why.

warrenlb
Reply to  Thomas Port
September 5, 2015 11:05 am

Or more accurately, claiming ‘no evidence’ showing such a correlation.

David Smith
Reply to  Thomas Port
September 6, 2015 4:31 am

Exactly Thomas. I also looked at the SkS post. There is no empirical evidence. It is just a lot of waffle basically saying, “This is what our models say should happen, and something similar has happened so our theory is correct”.
I could say that I have constructed a model that predicts that if you paint a car red it will crash. Oh look, a red car that has crashed! My model is correct!

David Smith
Reply to  Thomas Port
September 6, 2015 4:45 am

Here’s something lifted from the SkS post:

It is thus extremely likely (>95% probability) that the greenhouse gas induced warming since the mid-twentieth century was larger than the observed rise in global average temperatures, and extremely likely that anthropogenic forcings were by far the dominant cause of warming. The natural forcing contribution since 1950 is near zero

Notice the use of ‘extremely likely’. This is not empirical proof, just hedging your bets.
Oh, and wretched ‘models’ are used as proof. Warren, try and remember: models aren’t data!

rw
Reply to  warrenlb
September 5, 2015 11:22 am

From my reading, the main point of this article was to present certain facts. If you want to take issue with these facts, perhaps you should contact the RSS people as well as the other groups cited.
BTW, how’s your peer-reviewed record? (Are you up there with John Cook?)

warrenlb
Reply to  rw
September 5, 2015 12:28 pm

Many real scientists have picked apart LMs nonsense — perhaps you haven’t noticed? You might read Mr Husky’s post, above, for example. So apparently you, presumably a non-scientist, would trust the Science of a Classics major who misrepresents his own resume multiple times over?
I contend you trust too much.

MarkW
Reply to  warrenlb
September 5, 2015 12:07 pm

Once again our favorite troll attacks the man rather than the science.
BTW, most of the so called scientists who are pushing the global warming sc*m don’t have degrees in related fields either.
Why is it that hypocrites fixate on sins that their own side is rife with?

Gloria Swansong
Reply to  warrenlb
September 5, 2015 12:21 pm

Warren,
Chris has indeed published in peer-reviewed journals, not that that should matter.

warrenlb
Reply to  Gloria Swansong
September 5, 2015 12:28 pm

No he has not.

Roy
Reply to  warrenlb
September 5, 2015 3:08 pm

In theory the idea of “peer review” is a good one. In practice it encourages group think. Lots of rubbish gets published and interesting but unorthodox ideas don’t. There is absolutely nothing to stop you or anyone else from reviewing Lord Monckton’s article on this website. If he has made factual errors or there are logical errors in his arguments then point them out instead of making snide comments.

September 4, 2015 8:46 pm

Regarding “The least-squares linear-regression trend on the RSS satellite monthly global mean surface temperature anomaly dataset shows no global warming for 18 years 8 months since January 1997”: This is not a surface temperature dataset, but one of the lower troposphere. About half the air whose temperature is being measured here is more than 2 km above the surface.

richardscourtney
Reply to  Donald L. Klipstein
September 4, 2015 9:53 pm

Donald L. Klipstein:
You say

Regarding “The least-squares linear-regression trend on the RSS satellite monthly global mean surface temperature anomaly dataset shows no global warming for 18 years 8 months since January 1997”: This is not a surface temperature dataset, but one of the lower troposphere. About half the air whose temperature is being measured here is more than 2 km above the surface.

Yes. And the hypothesis of anthropogenic (i.e. man-made)global warming (AGW) says increased GHGs in the atmosphere (notably CO2) will cause more warming of the troposphere than of the surface and will warm before the surface.
Clearly, it is preferable to assess the lower troposphere and not the surface when assessing the effect on temperature of increased GHGs in the atmosphere.
However, the above essay does report the so-called ‘surface measurements’ saying

Figure 1b. The least-squares linear-regression trend on the mean of the GISS, HadCRUT4 and NCDC terrestrial monthly global mean surface temperature anomaly datasets shows global warming at a rate equivalent to a little over 1 C° per century during the period of the Pause from January 1997 to July 2015.
Bearing in mind that one-third of the 2.4 W m–2 radiative forcing from all manmade sources since 1750 has occurred during the period of the Pause, a warming rate equivalent to little more than 1 C°/century is not exactly alarming. However, the paper that reported the supposed absence of the Pause was extremely careful not to report just how little warming the terrestrial datasets – even after all their many tamperings – actually show.

Richard

MarkW
Reply to  Donald L. Klipstein
September 5, 2015 12:18 pm

If the surface were warming faster than the lower troposphere, then the atmosphere would become unstable, resulting in an over turning of the atmosphere which would enable that excess heat to escape to space more easily.

Reply to  MarkW
September 6, 2015 5:44 am

That is the lapse rate negative feedback, which is mentioned in IPCC assessment reports.

Reply to  MarkW
September 6, 2015 8:48 am

The IPCC has now greatly reduced its central estimate of the temperature feedback sum from 2 to 1.5 Watts per square meter per Kelvin. It should, accordingly, have reduced its central estimate of climate sensitivity from 3.2 to 2.1 Kelvin per CO2 doubling, but it somehow decided that it would not, after all, do the one thing that the IPCC’s reports are supposed to do above all else: provide a central estimate of climate sensitivity.

Reply to  Donald L. Klipstein
September 6, 2015 9:51 pm

Donald, where you under the impression that CO2 is confined to the layer of air near the surface?

E.M.Smith
Editor
September 4, 2015 10:35 pm

It looks to me like graph 1B has present temp about equal with 2010 peak while the others have it about 1/2 that. Different end months or what?

E.M.Smith
Editor
Reply to  E.M.Smith
September 4, 2015 10:38 pm

never mind… just noticed fine print RSS vs HadCrut…. land temps have warm trend….

Phillip Bratby
September 4, 2015 10:58 pm

I wish you wouldn’t keep showing those fraudulent energy budget figures.

SAMURAI
September 4, 2015 11:24 pm

The brief 20-yr warming spike between 1978~1998 was primarily caused by the following factors:
1) The 30-yr PDO warm cycle (from 1978)
2) The 2nd & 3rd strongest solar cycles since 1645
3) The tail end of the strongest 63-yr string (1933~1996) of solar cycles in 11,400 years.
4) the AMO 30-yr warm cycle (from 1994)
5) The Six El Niños between 1983~1998
6) The Super El Niño of 1997/98.
CO2 may have contributed 0.1C of warming warming during this 20-yr spike, but who cares? That’s just 0.5C of CO2 induced warming per century…
Now the complete opposite is in effect:
1) The 30-yr PDO cool cycle started in 2008
2) The 30-yr AMO warm cycle is winding down and will switch to a 30-yr AMO cool cycle from 2022.
3) Solar cycles have crashed since 1996 and we’re currently in the weakest solar cycle since 1906.
4) The next solar cycle starting around 2022 could be the weakest since the Maunder Minimum started in 1645.
5) We’ve only had 3 El Ninos over the past 17 years.
There are currently no valid scientific reasons to explain away the HUGE discrepancies between RSS/ Radiosonde/UAH 6 datasets and GISTEMP/ HADCRUT4 datasets; other than huge adjustments to the raw data, which the alarmists openly and freely admit to doing.
RSS/UAH datasets now exceed CAGW hypothetical model predictions by 2 standard deviations and within 5~7 years, it’ll likely be 3 SDs, which is sufficient duration and disparity to disconfirm the CAGW hypothesis.
Alarmists will likely continue making adjustments to the raw data to keep HADRCUT4 and GISTEMP datasets within 2 standard deviations of model projections, but they’ve likely already exceeded the bounds criminality (malfeasance of public funds/fraud) and many alarmist realize any further tampering could get them in serious legal trouble in the future.
Virtually EVERY prediction the alarmists have made has been wrong:Arctic ice-free by Septmeber, 2015, ocean pH, sea rise, Antarctica ice extents shrinking, severe weather worsening, methane projections, etc.
In any other branch of science, had hypothetical projections been this far off from reality, the hypothesis would be in the wood chipper by now… But, alas..

Reply to  SAMURAI
September 6, 2015 10:06 am

There is no such thing as a 1978 to 1998 warming spike. The warming was confined to two years which were followed by an eighteen year standstill of warming from 1979 to 1997. That was actually a hiatus that lasted as long as the present hiatus has lasted. The reason you don’t know about it is that our temperature guardians, more specifically HadCRUT3, GISS, and NCDC, made ot disappear by over-writing it with a phony “late twentieth century warming” that does not exist. I discovered this in 2008 while doing research for my book “What Warming?” and the hiaqtus appears as figure 16 in the book. I also discovered the role of HadCRUT3 in suppressing it and even put a warning about into the preface of the book. Nothing happened. Later I found that GISS and NCDC were co-conspirators in the disappearing act from computer footprints present on all three temperature curves. Fortunately these guys still do not control the satellites and that is how I was able to get the records proving the existence of that hiatus. It is interesting to note that the numerous articles trying to disprove the existence of the hiatus ave ignored this hiatus because it has been kept hidden from them as well. I regard this as a scientific crime that should be subject to criminal investigation, not suppression by buddies who keep there eyes firmly closed. Using the correct temperature record would put an 18 year horizontal slice into the smoothly rising temperature curve they show in the eighties and nineties.

September 4, 2015 11:30 pm

Reblogged this on Climatism and commented:
For the alarmists and hardened global warming believers out there, some pre-information on the atmospheric measurement systems used to measure the presence of ‘man-made’ CO2-induced global warming:
– RSS and UAH satellites measure the lower troposphere – the precise area of the atmosphere where “Global Warming” theory is measured. Alarmists now point to the oceans as the main component of the “Global Warming” system. They do this precisely because the atmosphere has indeed stopped warming, despite the fact that 35% of all human CO2 emissions, since 1750, have been emitted over the past 18 years, with NO atmospheric ‘Global Warming’, at all. A terrible stat for the global warming cult.
Atmospheric Scientist Dr Roy Spencer on RSS and UAH satellite temperature measurements systems:
“thermometers [GISS GHCN – NASA, NOAA, BoM] cannot measure global averages — only satellites can. The satellite instruments measure nearly every cubic kilometer – hell, every cubic inch — of the lower atmosphere on a daily basis. You can travel hundreds if not thousands of kilometers without finding a thermometer nearby.
– The name ‘Global Warming’ was changed to ‘Climate Change’ when it became obvious the atmosphere had stopped warming. This suits the agenda nicely, as the name ‘Climate Change’ cannot be falsified. The ‘climate’ always changes. Hence, any metric can be used to prove their theory: hot, cold, wet, dry, drought, flood. Therefore as a ‘science’, the theory of “climate change” is a null-hypothesis. It is pure pseudo-science.
– Lower tropospheric Satellite temperature data (UAH and RSS) was all the rage in the 1990’s when it ‘was’ warming. Now it is scoffed at by the global warming clique.
– Any adult entering university this year, or next, would have never ever experienced any ‘Global Warming’ in their entire lives.

Mike
September 4, 2015 11:42 pm

The spike in global temperatures caused by the thermohaline circulation carrying the warmer waters from the tropical Pacific all around the world

but before long the warmer sea surface temperatures in the Pacific will be carried around the world by the thermohaline circulation

I don’t know where our resident peer of the realm got this new buzz word from but this repeated assertion is incorrect.
The primary effect causing large scale surface circulation currents is the Coriolis force which causes the major ocean gyres. That, plus atmospheric circulation is what spreads the heat released in the tropical Pacific ocean during and El Nino event.
Thermohaline circulation is much slower surface to deep ocean circulation that operates on very long time scales.

– brings an offsetting la Niña, cooling first the ocean surface and then the air temperature and restoring global temperature to normal.

What is “NORMAL” is an ever changing, chaotic system. There is no “normal”.
This site has spent years arguing against the alarmists claiming everything we can measure are in a state of abnormal “anomalies” and the spurious notion that climate of 1850 was “normal” and that we must get back to “normal”.
His Lordship now seems to want to join them in advancing the idea that there is such a thing as “normal”. Rather confused, it would seem.

Reply to  Mike
September 6, 2015 11:08 am

Mike, you are correct about thermohaline circulation not being involved. I said so in another comment here. What carries the warmth around the world is rising air currents that join the global circulation. They are generated when an El Nino wave hits the South American coast and is diverted north and south parallel to the coast. The warm water will spread out on the surface along the coast. This warms the air above it which will then rise and join the westerlies. The connection with La Nina comes from the original El Nino wave running ashore in South America. It is not hard to see that any wave that runs ashore must also retreat. When the El Nino wave starts to retreat the water level behind it may drop as much as a meter. Cold water from below will then well up to fill the vacuum and a La Nina has started. As much as the El Nino before warmed the air a La Nina will now cool it and global mean temperature will remain the same. This is normal but things can go wrong. If something blocks the equatorial counter-current when an El Nino is crossing the ocean it will be stopped in its tracks. Its mass of warm water will simply spread out in mid-ocean and an El Nino Modoki is formed. Another source of irregularity is the variable border between the trades and the westerlies. As it moves north and south it can change the relative amount of warm air picked up by the westerlies and hence the perceived strength of the El Nino. It is likely that the irregularities of the first seven years of this century had something to do with this.

September 5, 2015 12:21 am

“surface tamperature”
Ooh! You are naughty! But I like it!

John Peter
September 5, 2015 12:37 am

I submit that, as far as the near future is concerned, there is only one way this alarmist trend can be halted and that is through Senator Inhofe initiating his Senate hearings into the “adjustments” to the surface temperature records carried out by NOAA and GISS followed by the election of a Republican President who is prepared to look at the realities rather than alarmist agitation. Nothing will happen as long as President Obama is unrestrained and in office. No amount of presenting realities will have an effect until people in power will listen. No chance with Obama and the current power brokers in EU calling the shots. If USA changes tack then Australia, Canada, Japan and maybe others may follow. Cameron in UK may even feel emboldened to start talking about “the crap” and be backed up by the East Europeans such as Poland. Only USA can change the game as outlined above.

warrenlb
Reply to  John Peter
September 5, 2015 5:02 am

Peter
There are reasons that nearly all countries of the world agree that Earth is warming, dangerously so: the evidence confirms it, in spite of a tiny faction that ignores the evidence or sees conspiracy under every rock. And their scientists confirm it.
Unfortunately for you, world leaders aren’t paying much attention to what amateur non-scientists say. Unless you consider ‘snowball Inhofe’ a scientist or a leader. It appears the US administration does not.

skeohane
Reply to  warrenlb
September 5, 2015 8:08 am

Yeah, they can collect taxes for non-existent problems and expand governmental overreach.

Reply to  warrenlb
September 5, 2015 10:56 am

warrenlb sys:
There are reasons that nearly all countries of the world agree that Earth is warming, dangerously so: the evidence confirms it…&etc.
@warrenlb:
You really can’t help yourself, can you? This is your same tedious, boring logical fallacy of appealing to your corrupted authorities, and you never provide any empirical, testable “evidence”.
That is because you don’t have any measurements of AGW. Like most folks, I think AGW exists. Where you’re completely off base is in your assertion that the planet is warming “dangerously”. You have no credible evidence whatever for that baseless assertion. In fact, the planet has not been warming at all.
As usual your confirmation bias is in high gear: you cherry-pick the ‘authorities’ you like, but you ridicule those like Sen. Inhofe, who doesn’t buy your climate alarmism, calling him “snowball Inhofe”.
You can’t lose any more credibility, because you have none at all at this point. The very best that can be said about you is that you are a pseudo-scientist. No honest scientist would say the things you do. You are a prime example of a closed-minded religious true believer. You wouldn’t last five minutes in any fair, moderated debate, and all you do here is clutter up the threads with your eco-religious beliefs.

rw
Reply to  warrenlb
September 5, 2015 11:27 am

warrenlb,
In fact, it’s the amateur non-scientist in the White House that world leaders don’t seem to be paying much attention to. (You’re obviously not keeping up with current events.)

MarkW
Reply to  warrenlb
September 5, 2015 12:21 pm

Poor little warren. First he whines that his Lordship has no right to disagree with him because he doesn’t have a degree. Then he proclaims that world wide, politicians (who also have no science degrees) do agree with him.
If warren had the slightest bit of personal integrity he would slink back into whatever hole he crawled out of in shame. But he won’t.

warrenlb
Reply to  warrenlb
September 5, 2015 12:32 pm


POTUS and other world leaders listen to what real scientists have to say instead of conspiracy theorists and glib con artists. Which is more than can be said about you, apparently..

richardscourtney
Reply to  warrenlb
September 6, 2015 2:58 pm

warrenlb:
You claim

POTUS and other world leaders listen to what real scientists have to say instead of conspiracy theorists and glib con artists.

Well, that explains why you keep making your silly posts: you resent that “POTUS and other world leaders” ignore your attempts to con people with your ludicrous logical fallacies and conspiracy theories.
Richard

Harry Passfield
September 5, 2015 2:57 am

The page Key Facts about Global Temperature (below) should be shown to anyone who persists in believing that, in the words of Mr Obama’s Twitteratus, “global warming is real, manmade and dangerous”.

Do you think you could get a copy to Emma Thompson, Chris?

Reply to  Harry Passfield
September 6, 2015 10:11 pm

Why is it that mentioning Emma in the same comment as the word “Twitteratus”, makes me highly aroused?

September 5, 2015 3:14 am

It has been mentioned several times up-thread that CO2 is not correlated with temperature rise and fall on this planet and that should put to rest the false theory that CO2 drives climate. One would think so, but then we fight dogma and not real science. (that has happened in many fields in the modern age)
I read an interesting theory once. it was that insolation from our star, plus the mass of the atmosphere (and gravity obviously) were the two main factors that determine our planet’s temperature (total energy really). Then after that there are a host of other factors that cause localized differences. I can not name them all but a few were: oceans and currents, the sun’s activity, H20 in the atmosphere and in the ground, hits by asteroids, volcanic activity, continental drift, and on and on and on. The idea was that the local climate was changing all the time for a host of reasons but the overall temperature did not vary much at all unless there was a major event to perturb the status quo. (really big asteroid hit?)
Regardless of your own pet theory, our observations and historical reconstructions tell us that CO2 levels do nothing to speak of. We could triple CO2 in the atmosphere tomorrow (magic wand anyone?) and nothing would come of it other than the plant life would cry out a big Thank You.
~Mark S.

warrenlb
Reply to  markstoval
September 5, 2015 6:14 am

@Markstoval
‘It’s been ‘mentioned’ on this forum that CO2 is not correlated with global temperature rise and fall…’ . Whereas, all the evidence, and the Physics, say it is. Try this: http://climate.nasa.gov

warrenlb
Reply to  warrenlb
September 5, 2015 6:48 am
Reply to  warrenlb
September 5, 2015 9:48 am

Hi Warren,
Does it hurt to be as stupid as you are?
Sincerely, Mark

warrenlb
Reply to  warrenlb
September 5, 2015 10:10 am

since your only reply is personal attack, we can safely assume you either don’t understand the analysis, or can’t offer any critique.
[your initial comment about Monckton was a personal attack, so we can safely assume you either don’t understand the analysis, or can’t offer any critique. -mod]

Reply to  warrenlb
September 5, 2015 11:06 am

warrenlb doesn’t understand the analysis, that’s why he always reverts back to his beliefs.
I read the SkS link, and there is no direct evidence anywhere showing any “empirical evidence” of AGW. As usual, they torture their ‘reasoning’ in order to come up with the answer they want.
But as alawys, SkS has no empirical, testabel, verifiable measurements quantifying AGW. The reason is simple: at current concentrations AGW is just too small to measure. That doesn’t mean AGW does not exist, it just means that its effect at ≈400 ppm is so insignificant and minuscule that we can’t measure it with current instruments.
With no measurements, you’ve got nothing except your baseless assertions. SkS has the same problem. After almost 20 years with no global warming, your CO2=AGW conjecture has been repeatedly falsified. Honest folks would admit it. But you keep giving your wrong-headed assertions as if they were facts. They aren’t.
Both you and SkS need to work on your honesty problem.

MarkW
Reply to  warrenlb
September 5, 2015 12:24 pm

The historical record shows that CO2 trails temperature changes by 900 to 1000 years.
As to the most recent century, temperatures have risen, fallen, and stayed the same, all while CO2 was increasing.
So your claim of correlation fails.

Richard Barraclough
September 5, 2015 3:47 am

How frustrating!
I thought I had detected a tiny error in the algorithm provided by the Professor from Epidemiological studies in Melbourne (huh?). My own least squares regression, performed on the RSS dataset which I first downloaded in July 2013, showed a start date for the “Pause” one month later than that described here.
Before firing off a gloating reply, I decided to double check that he and I were using exactly the same data. Imagine my surprise when I discovered that since that first download, pretty well every month in the last 10 years has had a very small “correction”, and several before that, all the way back to 1999.
Most of the corrections were for an increase of only one thousandth of a degree upwards, and the largest for only 3 thousandths. Can the temperature of the lower troposphere really be inferred to such accuracy from those satellite measurements? And what on earth is the point of changing records more than a decade old in such a way? Perhaps if you are the owner of a global temperature dataset, you have to be constantly fiddling with your algorithm and applying it retrospectively. It does make you wonder whether there will be another bit of tinkering in the future, and what effect it might have.
Anyway, the net result is that my dataset is bang up to date, and my trend-line agrees with that provided by Christopher Monckton of Brenchley, and verified by Professor Farish of Melbourne
If the anomaly were to remain at this level between now and the Paris conference in 3 months’ time, the start month of the Pause would advance only 2 months, therefore making it one month longer in total

Richard Barraclough
Reply to  Richard Barraclough
September 5, 2015 4:05 am

The UAH V6 Beta3 (which is the University of Alabama’s name for its latest version of troposphere temperatures) has a similar Pause going back to May 1997.
However, unless there’s a bit of cooling soon, this one will vanish early next year.

Werner Brozek
Reply to  Richard Barraclough
September 5, 2015 8:19 am

However, unless there’s a bit of cooling soon, this one will vanish early next year.

Should that happen, it would be interesting what the average of RSS and UAH6beta3 shows then.

Richard Barraclough
Reply to  Richard Barraclough
September 6, 2015 3:23 pm

Hello Werner,
I must have too much time on my hands. I always have a look to see how long the Pause will last if the current month’s anomaly lasts at that level (of oourse, it never does!)
A couple of slightly warmer months and those 2 datasets will be showing no pause at all by early 2016. Even a tenth of a degree drop will enable us to keep writing about it for the whole of 2016 at least!
Regards

Werner Brozek
Reply to  Richard Barraclough
September 6, 2015 5:44 pm

A couple of slightly warmer months and those 2 datasets will be showing no pause at all by early 2016.

That may be true, but even if both jump by 0.2 and stay that way for the rest of the year, the 1998 record is still safe for both.

Siberian Husky
September 5, 2015 4:20 am

Yes, but what sort of idiot would perform an OLS regression on an autocorrelated time series *and* throw away half their time series? Oh, that would be someone without a Science degree or the foggiest idea how to do statistics…

Richard Barraclough
Reply to  Siberian Husky
September 5, 2015 4:44 am

Yes – we all have different academic and professional backgrounds – but common decency should transcend those

Reply to  Siberian Husky
September 5, 2015 6:58 am

The climate is autocorrelated. That is one of its features. It is already adjusted for the seasonal autocorrelation and It makes no sense to adjust for even more autocorrelation unless one wants to lose all of the information.

warrenlb
Reply to  Bill Illis
September 7, 2015 6:54 pm

It seems Siberian Husky has already fully destroyed LM’s post.

warrenlb
Reply to  Siberian Husky
September 5, 2015 8:26 am

@Siberian Husky
Yes, read and repeated as gospel by those without Science degrees or the foggiest idea how to do statistics.

Stephen Richards
Reply to  warrenlb
September 5, 2015 12:19 pm

Stephen K Richards BSc MSc physics and solid state physics. Critique the paper a$$hole.

MarkW
Reply to  warrenlb
September 5, 2015 12:27 pm

This from the guy who defends Mann’s use of “non-standard” statistics when he created the Hockey Stick.

warrenlb
Reply to  warrenlb
September 5, 2015 3:26 pm

@Steven K Richards
Did you learn anything other than street language at University? If so, explain how LM’s proposition is consistent with the evidence and the underlying physics?

Reply to  warrenlb
September 6, 2015 10:24 pm

Warren sez:
“…explain how LM’s proposition is consistent with the evidence and the underlying physics?”
Warren, since no one here is taking orders from rude comment bombers, how about if you just do your own homework, and tell us how it is not?

Reply to  warrenlb
September 7, 2015 7:32 pm

Menicholas,
You don’t understand warrenlb’s imaginary rules: he always asks questions. He never answers questions.
But if he ever changes his M.O., I have a question for him…

Ron Clutz
September 5, 2015 4:21 am
ren
September 5, 2015 5:02 am

The tendency to meridional course of the Jetstream reduce the effect of El Niño.
http://www.intellicast.com/Storm/Hurricane/PacificSatellite.aspx?animate=true

Siberian Husky
September 5, 2015 5:06 am

So this is your go to guy for the stats:
http://www.findanexpert.unimelb.edu.au/display/person14693#tab-publications
“Prof Farish” is actually Associate Professor and has an honorary position in “medical education” at Melbourne Uni- sounds a little less impressive than a “Professor of Epidemiology and Biostatistics”.
Also his highest qualification is a D. Ed- not a PhD (that’s like being an over qualified secondary school teacher for all the scientific illiterates on this blog)- and not a statistician. Not a ringing endorsement is it?
No wonder your stats are meaningless.
Why is it all of your claims evaporate with even the slightest amount of digging?
[Marked for review by request. .mod]

David Smith
Reply to  Siberian Husky
September 5, 2015 5:58 am

Right, you talk about evaporating claims. The following are ridiculous and science-free claims we’ve had to put up with from the multi-trillion dollar green blob that have had politicians salivating over:
– ice free poles
– ‘extreme’ storms raging across the planet
– millions of ‘climate refugees’ roaming the surface of the Earth
– the extinction of polar bears
– the Maldives under water
– children never knowing what snow is
– massive desertification (instead of the reality of a greening world)
– mass famine
– eternal drought (ask Flannery about that ridiculous claim)
– unimaginable floods
– methane armaggedon
– etc, etc, etc
Mr Husky, I hope you would agree with me that all of the above are ridiculous hyperbole, but that is what Govts have been told will happen by scientists and NGOs who are all riding the global warming gravy train. Politicians never pass up a good oportunity when they see one and now we are all being hit in the pocket either by ‘green’ taxes or ‘green’ subsidies.
Personally, I’m fed up with this nonsense. If it was just a couple of misguided youth waving placards on the street I wouldn’t care less. However, I’ve said above, it’s hitting me in the pocket and alarmists like yourself wetting your pants about our tiny contribution towards a gas that occupies just 0.04% of the atmosphere isn’t helping one bit.
If you’re so worried about our use of fossil fuels you need to stop using that plastic computer you’re hunched over right now. Or maybe you have a laptop made out of bamboo?

jones
Reply to  David Smith
September 5, 2015 12:57 pm

I’m also sure I read somewhere that a case was made that the expansion of bio-fuels fueled the rise of social unrest in the middle east leading to the shop of horrors we are witnessing there and now coming to a town near you…..?

jones
Reply to  David Smith
September 5, 2015 1:12 pm

Apologies. Terrible sentence structure.

David Smith
Reply to  David Smith
September 6, 2015 4:10 am

Jones,
You’re right. I would argue that bio-fuels have achieved nothing apart from use up land that could have been used for growing food.

Reply to  Siberian Husky
September 5, 2015 6:26 am

The malice of the furtively anonymous, paid climate-Communist trolls becomes ever more desperate as the discrepancy between the exaggerated predictions that are the Party Line and the real-world measurements that are what has actually happened in reality.
“Siberian Husky”, whoever it is, seeks – from behind a cloak of cringing, cowardly anonymity – to discredit the reality of the near two decades of little or no global temperature change by suggesting that Professor Stephen Farish of the University of Melbourne, who kindly verified the algorithm by which the least-squares trends used here are calculated, has no more than an “honorary position” in “medical education” at the University.
“Siberian Husky” then adds, malevolently but revealingly, that the calculatedly and dishonestly pejorative description he has given of Professor Farish’s status “sounds a little less impressive than a “Professor of Epidemiology and Biostatistics”.
But I had not described the Professor in as “Professor of Epidemiology and Biostatistics”. I had described him as “professor of epidemiological statistics”. The description “Professor of Epidemiology and Biostatistics” is how he is formally described when he speaks at international conferences or summer schools.
So “Siberian Husky”, having discovered on the Web (or having known perfectly well from the outset) that Professor Farish is indeed Professor of Epidemiology and Biostatistics, deliberately misdescribes him in dishonest and far less complimentary terms.
The truth is as follows. Professor Farish is indeed an honorary Professor specializing in epidemiological statistics, and he is not merely in “medical education” but in the “medical education department” – i.e., the teaching and research faculty of the medical school – at the University of Melbourne. That medical school is the largest and most prestigious in the Southern Hemisphere. To be granted an honorary professorship there, and to teach there, is an honor indeed. Only the smartest of smart cookies get that honor, and Professor Farish is one of the smartest cookies in the jar.
For good measure, Professor Farish runs an expert statistical consultancy business so successful that he lives in an enormous house in substantial grounds in the countryside outside Melbourne, far beyond the means of a university professor. He is entirely familiar with the uncomplicated statistical technique that is used here in the determination of least-squares linear-regression trends. He and I discussed the matter carefully before I began this series of monthly reports, for I have no piece of paper to say I am a statistician, and he kindly confirmed that my method is correct.
What, then, to do about “Siberian Husky”? First, the rules at WattsUpWithThat are that denigrating people by name is not permitted if the libeller is anonymous. So I am going to ask the moderators to leave his repellent and deliberately dishonest comment about Professor Farish and this reply on the Web for 24 hours to correct the libel of Professor Farish in his calling, and then to remove both postings to prevent further circulation of the libel.
I am also going to ask for the contact details of “Siberian Husky”. I suspect that so elaborate and obviously deliberate deception, where “Siberian Husky” can be proven to have known perfectly well what Professor Farish’s status is but nevertheless chose to lie about it, is part of a paid campaign by some global-warming profiteering advocacy group attempting to deter anyone from questioning the Party Line. If so, since the deception I have here revealed can be proven to have been deliberate, “Siberian Husky” has committed a fraud and will be reported to the public authorities for consideration of prosecution. If the perpetrator also holds any public position in any British or Commonwealth jurisdiction, or in the United States (i.e. on a university faculty), he will also be reported for wilful misfeasance in a public office, an ancient Plea of the Crown tailor-made to bring to book rogue public servants who lie and cheat for their own profit at the expense of the body politic.
It is time to restore some honesty to the climate discussion. The likes of “Siberian Husky” are repellent in their willingness to frighten nearly everyone away from this debate by the vicious dishonesty by which they attack anyone in any way associated with asking questions about the climate-Communist Party Line. Time to draw a line in the sand, in my submission. Moderators, please act.

[24 hours noted, but the multiple time zones from your location will affect our host’s response to your request. .mod, EDT]

warrenlb
Reply to  Monckton of Brenchley
September 5, 2015 7:09 am

Monckton says:
“It is time to restore some honesty to the climate discussion”
Agreed. And it should start with screening wuwt authors for integrity:
https://bbickmore.wordpress.com/lord-moncktons-rap-sheet/
[sure thing Mr. Beeton, let’s see yours too -mod]

warrenlb
Reply to  Monckton of Brenchley
September 5, 2015 8:30 am

So Mr Mod, wuwt has no policy on the credentials or integrity of authors whose articles it posts?
[Well, do the authors whom you cite have any integrity or credentials – other than being very highly government-paid by very expensive government labs and bureaucracies to produce government-desired, government-serving results? .mod]

warrenlb
Reply to  Monckton of Brenchley
September 5, 2015 9:42 am

Well, Mod. You admit integrity of wuwt’s authors is not your concern. Amazing.
[mods don’t select articles or authors… not their job. do try to keep up -mod]

rw
Reply to  Monckton of Brenchley
September 5, 2015 11:44 am

For those of us interested in the ‘techniques’ and stratagems of sophistry, as well as those who will want to review the Great Debate at some future time, I would urge that postings like those of Siberian Husky and warrenlb be preserved in all their pristine glory. (As it is, I think the moderators here do a good job of separating the truly distasteful or off-color comments from those that are merely dubious and somewhat snide.)

ren
September 5, 2015 5:08 am

The temperature of the North Atlantic decreases.
http://woodfortrees.org/graph/esrl-amo/from:2012

warrenlb
Reply to  ren
September 5, 2015 1:43 pm

@bobl
You said the earth can lose or gain heat energy by means other than thermal radiation. What might these be?
You also said there are energy losses so that energy in to the earth does not necessarily equal energy out. What might some of these losses be, and how is your idea compatible with the 1st Law of Thermodynamics?

ren
Reply to  ren
September 5, 2015 11:51 pm
ren
Reply to  ren
September 6, 2015 1:08 pm

“In essence, the radiative theory of the greenhouse effect confuses cause and effect. As we have shown, temperature is a function of pressure, and absorption/emission of IR from greenhouse gases is a function of temperature. The radiative theory tries to turn that around to claim IR emission from greenhouse gases controls the temperature, the heights of the ERL and tropopause, and thus the lapse rate, pressure, gravity, and heat capacity of the atmosphere, which is absurd and clearly disproven by basic thermodynamics and observations. The radiative greenhouse theory also makes the absurd assumption a cold body can make a hot body hotter,disproven by Pictet’s experiment 214 years ago, the 1st and 2nd laws of thermodynamics, the principle of maximum entropy production, Planck’s law, the Pauli exclusion principle, and quantum mechanics.”
http://hockeyschtick.blogspot.com/2015/09/why-effective-radiating-level-erl-is.html

bobl
September 5, 2015 5:16 am

Lord Monckton.
The radiative balance argument is likely wrong. As any engineer will tell you, if someone comes along and says their machine emits in its desired output, exactly the power input to the device then they are selling snakeoil. This is a perpetual motion machine. The idea that the earth must radiate the same as it receives WITHOUT LOSS is without merit there ARE LOSSES, many. This idea emanates from the idea that the earth can only cool or heat by radiation which is ALSO wrong.
Any system has losses, it is often assumed that the losses end up as heat but this is not true. For example tires pushing on the road do cause heat but they also push on the earth altering its rotational parameters, directly converting the energy from the fuel into momentum of the earth. The same thing occurs for wind and rain striking the earth. Energy is sequestered into photosynthesis and the synthesis of vitamin D from cholesterol. Every cracked rock, bang from an expanding roof, every ice cube melted (or polar cap), every molecule of water, alcohol or hydrocarbon (such as Eucalyptus oil) evaporated, every lightning bolt from static electricity. They all extract energy sometimes temporarily, sometimes permanently.
Not only this, the gravitation of the moon sun (and planets) cause fluids to slosh around the planet creating tides and waves in the molten core of the planet, the oceans and atmosphere, The constant motion causes friction which introduces non solar heat into the atmosphere, There is 36 times more energy per square meter in the ocean waves than insolation received from the sun – Why? Where did that energy come from, where does it go, how much ends up in the atmosphere as heat caused by friction.
It is highly unlikely that the outgoing radiation will be equal to the incoming energy the best way to look at is that we have
Outgoing IR – Incoming Insolation +Unknown – Unknown. To the point that the value of Outgoing IR is Unknown (+/- Unknown) because we have no idea what the magnitude of the non-radiation energy gains and losses are.
I’d suggest some caveats in your articles when you talk about radiative balance, the virtual perpetual motion machine of the climateer’s radiative balance assumption is an unstable house of cards the assumption of no loss is WRONG.

MarkW
Reply to  bobl
September 5, 2015 12:34 pm

Machines have multiple means by which input energy can be discarded.
The only mechanism the earth has is by radiation. Either light (reflected) or heat.
It’s true that some of the energy can be used to do things like evaporate water, but water vapor is essentially in balance throughout the climate system. So there is no long term storage of energy there.
Please name this place where you believe all the heat is hiding.

Reply to  MarkW
September 5, 2015 1:43 pm

There is certainly some reason to doubt the usual presentations of “radiative balance”, in that notwithstanding what is presented as a considerable net gain in radiation the Earth has not warmed.
My difficulty with the “radiation balance” argument is in the fact that CO2 concentration has been much higher than the present (hundreds of times higher) over the past 750 million years, and the correlation with global temperature has been poor. I suspect, therefore, that CO2 is not the only influence moderating the influxes and effluxes of energy, and that one cannot simply assume that the whole complex climate object was in perfect radiative balance at 278 ppmv concentration in the pre-industrial era and is now out of balance.
The problem is that the climate modelers use math from electronic circuitry without realizing that changes in voltage play no part in equilibrating the circuit after a forcing, while temperature change, the output of the climate “circuit”, is the very instrument by which the circuit self-equilibrates, a “radiative imbalance” being resolved, and quite quickly, by an increase in temperature.
The math behind this process is complex. What one can say is that the IPCC’s modelers have substantially reduced the value of the temperature-feedback sum between the CMIP3 and CMIP5 ensembles, so that the central estimate of climate sensitivity, calculated on the same basis as in the Fourth Assessment Report, should now be 2.1 Celsius per CO2 doubling, not 3.2 Celsius.
And only two-thirds of that equilibrium sensitivity occurs in the first 85 years after a forcing. And the forcing arises not in one lump at the outset but by little and little over the century. On that basis, one would not expect much more than 0.5 Celsius degrees of new global warming by 2100, and that is too little to be worth worrying about. A slow rate of warming, even if it were eventually to reach 2 degrees above today, is harmless because everyone and everything has plenty of time to adapt.
However, in the monthly temperature series I merely present the facts showing two things: that there has been no global warming at all for almost two decades, and that the rate of warming since 1990 is about a third of what the UN’s climate panel then predicted on the basis of what it called “substantial confidence” that the models on which it relied had captured all the essential features of the climate system. For present purposes, best to stick to these self-evident facts, I think.

M Simon
Reply to  MarkW
September 7, 2015 12:02 am

Monckton of Brenchley September 5, 2015 at 1:43 pm
“Everybody” uses electrical analogs for analysis. It is convenient and well understood. As are the transformations from mechanical to electrical.
Voltage difference changes are equilibrated by changes in current flow. Changes in current flow are equilibrated by voltage changes. Voltage X Current = Power. Power X Time = Energy.
I don’t see anything wrong with the method if EVERYTHING is included. The trouble is we don’t know everything. And some things we don’t know could be important well beyond their obvious magnitude. So how do you model a cloud as an LCRVI? There is no one with a clue. Well you do what we electronics guys do when the model is not a mathematical function. Paramaterize. And a 1% error in the cloud function throws the whole exercise into a cocked hat. Rubbish in, rubbish out. Heh.
The take away? If there is “missing” heat the models are wrong. Doesn’t matter where it went.

bobl
Reply to  MarkW
September 7, 2015 6:53 am

MarkW, hopefully you subscribed to replies. You make a bold assertion with no evidence. Here, I will simplify it for you by considering just ONE mechanism. The rotation of the earth and moon causes 600 km per hour winds to circle the planet we call the jet stream. That wind causes friction, causing atmospheric heating…. how much? Where is that energy conversion in the radiative balance model. Do the models take into account the contribution from changes in friction in the jet stream as the climate warms. Is that additive or subtractive, and what is it’s magnitude? The energy comes in as momentum and gravity and exists as heat, it is a totally non solar form of heating.
Another example,
Wave energy in the ocean is about 36 kW per square meter, how much of that is caused by thermals. What amount of energy is extracted from the climate and put into waves, lets say its 10% thats 3.6 kW, hmm nope can’t be that, maybe its 0.1% 36W per square meter, where does that end up… ok you say it ends up as heat again through friction just to keep your radiative theory alive…. so where did the other 35.97kW go?
The potential energy of the earths position above the sun is a BILLION times annual solar insolation. How much of that is lost to atmospheric kinetics as the position of the earth changes relative to the sun?
Kinetic energy of earth rotation is 100,000 times ANNUAL solar insolation of the whole earth. How much of that leaks into the climate.
Kinetic energy of the earths orbit is 500 million times the annual insolation from the sun.
These energies are stupendous, it doesn’t take much conversion of these energies to heat to produce a mere 0.6W per square metre.

herkimer
September 5, 2015 5:27 am

It is clear that “GLOBAL” as in ‘ GLOBAL WARMING ” is a meaningless term. According to NOAA CLIMATE AT A GLANCE data. North America land has been steadily cooling whether you go back to 1998,2000 or 2005 . Northern Hemisphere land has been slightly cooling or flat since 2005 at -0.05 C./decade and Southern Hemisphere land has been slightly warming or really flat at + 0.06C /decade .. Africa land since 2005 is also slightly warming or really flat at -0.07C/decade. Most of the land warming the last 10 years or since 2005 is due to warming Europe, Asia and South America. For a long time I have been urging that we start reporting CONTINENTAL figures not GLOBAL only

herkimer
Reply to  herkimer
September 5, 2015 9:35 am

My point in the above post is that how can the climate pause be still not present when according to NOAA’S own records ,the temperature anomalies for the last 10 years for both the Northern Hemisphere land areas which have been slightly cooling or really flat and Sothern Hemisphere land areas which have been slightly warming or really flat show no warming trend .

herkimer
Reply to  herkimer
September 5, 2015 12:19 pm

According to NOAA data Annual temperature anomalies since 2005 or last10 years for combined GLOBAL LAND areas ( 149 million sq km) have slight decline or flat trend at 0.02C/decade. The pause is real for global land even with land based measurements .

Steve from Rockwood
September 5, 2015 5:28 am

I thought this was interesting from NASA…
“El Niño is only one of the climate anomalies that scientists have observed, others include the North Atlantic Oscillation, the Atlantic Intertropical Convergence Zone oscillation, the Pacific Decadal Oscillation. Together with El Niño these systems are believed to be responsible for well over fifty percent of the climate variability on Earth. As models are created to simulate the individual patterns they will be combined to create a global model of climate change. If scientists get to the point to where they understand all of these climate cycles they may be able to predict major weather patters months in advance.”
It seems as though NASA believes climate change models cannot yet account for 50% of all climate variability.
http://science.nasa.gov/earth-science/oceanography/ocean-earth-system/el-nino/

September 5, 2015 7:35 am

[snip – d-word insults from a person with a fake name, policy violation -mod]

September 5, 2015 7:40 am

Reblogged this on Bob's Opinion and commented:
Save this blog along with all the others, it will help when writing against some of the global warming campaign…

Bruce Cobb
September 5, 2015 11:03 am

Someone must have tripped a silent alarm somewhere in troll Believer land.

warrenlb
September 5, 2015 1:25 pm

@Abe
That would include all the world’s scientists and most engineers. Perhaps the reason you hold such a universally mistaken belief is that the GHE doesn’t contain anything..it absorbs and reradiates IR thermal radiation 360 degrees.

SkepticGoneWild
Reply to  warrenlb
September 5, 2015 10:19 pm

@Warrenlb
360 degrees?? 360 degrees is a two dimensional planar field, Einstein.

John
September 5, 2015 3:21 pm

Fascinating. In which science journal do you plan to publish this?

Reply to  John
September 5, 2015 3:38 pm

John,
By the time the discredited and corrupt climate peer review system got around to publishing this, it would be well over twenty years with no global warming.
So instead of your little ad-hom dig, why don’t you explain how the climate alarmist crowd could have been so utterly wrong for the past 18+ years?
In science, when a conjecture like ‘dangerous man-made global warming’ has been falsified by the real world, honest scientists go back and try to figure out why they were wrong.
But none of these alarmists will even admit that they were wrong, even when everyone knows it. Instead, they double down on their hoax. How do you explain that?

warrenlb
Reply to  dbstealey
September 5, 2015 5:49 pm


Still defending (and producing) bad Science I see.

Reply to  dbstealey
September 5, 2015 6:02 pm

warrenlb,
Still avoiding the topic, I see: eighteen years, eight months of no global warming!
You have no measurements of AGW. Not a single one. All you have are the baseless assertions that alarmist pseudo-scientists fall back on. Thus, it is you who is guilty of bad science.
Since you’ve decided to respond for ‘John’ above, maybe you will take a shot at answering the question I asked him.
Your side has been flat wrong for more than 18 years. But you have never even tried to understand WHY you have been 100.0% wrong. How do you explain that deficiency?
And if you won’t answer, I will provide the answer for you. Because whether you know the answer or not, I know the answer.
Your flying saucer has just been delayed, that’s all… ☺

Chris
Reply to  dbstealey
September 6, 2015 5:27 am

dbstealey, as always, you continue to use only one temperature dataset, which you contend is the least modified, even though you have yet to provide any proof whatsoever that that is the case.

Reply to  dbstealey
September 6, 2015 4:27 pm

Chris,
What’s wrong with satellite data?
FYI, both RSS and UAH have converged. They show the same temperatures. So a better question for you is:
What dataset do you want to use? Please don’t recommend any that rely only on averaging individual thermometers, or that disregard the oceans, or that assume ocean temperatures. Actually, that eliminates all but satellite data.
Satellites take a snapshot of the whole planet (or at least, almost the whole planet). Other datasets don’t that. So what you’re saying is that we should use ‘adjusted’ temperatures, and call it “data”?
No, thanks, That’s bogus. Even the IPCC admits to the “pause”. You’re just looking for confirmation bias to support your belief. Sorry, that’s not science. That’s just promoting a narrative that you believe in.

Chris
Reply to  dbstealey
September 8, 2015 10:07 am

DB Stealey says: “What’s wrong with satellite data?
FYI, both RSS and UAH have converged. They show the same temperatures. So a better question for you is:
What dataset do you want to use? Please don’t recommend any that rely only on averaging individual thermometers, or that disregard the oceans, or that assume ocean temperatures. Actually, that eliminates all but satellite data.
Satellites take a snapshot of the whole planet (or at least, almost the whole planet). Other datasets don’t that. So what you’re saying is that we should use ‘adjusted’ temperatures, and call it “data”?”
First, as you well know, satellites do not measure temperature, they measure the thermal emission of oxygen in the troposphere. So it’s a proxy of a proxy for surface temperatures – yeah, that sounds better than surface measurements. Second, you imply that satellite data is not heavily adjusted in comparison to surface temperature data, which is a completely misleading statement. How do I know that? Because Dr. Roy Spenser says so: http://www.drroyspencer.com/2015/04/version-6-0-of-the-uah-temperature-dataset-released-new-lt-trend-0-11-cdecade/ Even for UAH, his trend is .114C/decade.

RD
Reply to  John
September 5, 2015 7:43 pm

Here’s a good summation of the current state of peer reviewed literature regarding global warming as presented to congress by climatologist Dr. Pat Michaels.
http://wattsupwiththat.com/2015/07/22/patrick-j-michaels-testifies-before-the-committee-of-natural-resources-at-the-hearing-an-analysis-of-the-obama-administrations-social-cost-of-carbon/

Reply to  John
September 6, 2015 8:44 am

John raises the important question which science journal should publish this analysis of the growing discrepancy between prediction and observation. I’m afraid the answer is that none of the Western journals would entertain it, for it does not fit the Party Line.
However, in a recent paper for the Chinese Science Bulletin I was able to include some of the key graphs. They had been tossed out by the reviewers of our earlier paper, not because they were wrong but because they were right. However, our second paper was in response to a more than usually erroneous attack on us by a group of climate campaigners. Their attack on our earlier work should never have passed peer review; but, because it did, we were given rather more freedom to reply than we’d normally have gotten, so the graph showing no global warming for 18.5 years has now passed peer review and has appeared in the journal of the Chinese Academy of Sciences, the largest such academy in the world.

Svante Callendar
September 5, 2015 3:27 pm

Using just one data set (RSS), and searching for the trend you want is cherry-picking. Carl Mears is correct.
Have you tried the same analysis with the UAT data set? The data sets are similar, both contain a synthesised lower troposphere temperature estimate.
I suspect it is academic anyway, I doubt if the results are statistically significant..

Werner Brozek
Reply to  Svante Callendar
September 5, 2015 5:21 pm

Have you tried the same analysis with the UAT data set?

Did you mean UAH6.0beta3? If so, it shows a slope of essentially zero for about 18 years and 4 months.

Reply to  Werner Brozek
September 6, 2015 8:39 am

Thank you, Werner. My six-monthly analyses consider all the five longest-established temperature datasets, but I have long used the RSS dataset for the monthly headline graph because RSS reports first.
Dr Mears indeed says he prefers the terrestrial tamperature datasets to his own dataset. He is of course entitled to his opinion. What is clear, however, is that on all datasets the rate of warming is considerably below what the IPCC and its models had predicted.

richard verney
Reply to  Werner Brozek
September 6, 2015 9:22 am

Why does Dr Mears prefer the terrestrial data set? What is the rational justification for such preference?
Given the issues arising from the constant adjustments/homogenisation, station dropouts, UHI etc, any rational person would be extremely concerned as to the quality of the terrestrial data sets. If these are better than the satellite data sets, heaven help us, the science is in a mess.

Werner Brozek
Reply to  Werner Brozek
September 6, 2015 5:59 pm

Dr Mears indeed says he prefers the terrestrial tamperature datasets to his own dataset.

I wonder if the latest work by Karl has changed his mind. Professor Brown has this to say here:
http://wattsupwiththat.com/2015/08/14/problematic-adjustments-and-divergences-now-includes-june-data/#comment-2007402

Up until the latest SST correction I was managing to convince myself of the general good faith of the keepers of the major anomalies. This correction, right before the November meeting, right when The Pause was becoming a major political embarrassment, was the straw that broke the p-value’s back. I no longer consider it remotely possible to accept the null hypothesis that the climate record has not been tampered with to increase the warming of the present and cooling of the past and thereby exaggerate warming into a deliberate better fit with the theory instead of letting the data speak for itself and hence be of some use to check the theory.

David A
Reply to  Werner Brozek
September 6, 2015 6:05 pm

NASA formerly published a formal belief touting the satellite data set as the most accurate. Sorry, no current link, but Tony Heller copied it. For many reasons this is likely true. Also the satellite data sets are certainly the most consistent or percise as well.

Svante Callendar
Reply to  Werner Brozek
September 6, 2015 10:53 pm

Werner Brozek.
I don’t think so, but go ahead and post the start point. It would be interesting to see if it matches the same month start point that was cherry-picked from RSS.
“essentially zero” – weasel word?
Anyway my point is the result will not be statistically significant.

Werner Brozek
Reply to  Werner Brozek
September 7, 2015 8:52 am

“essentially zero” – weasel word?

Here are the numbers from Nick’s site:
Temperature Anomaly trend
Apr 1997 to Jul 2015 
Rate: -0.016°C/Century;
CI from -1.117 to 1.085;
t-statistic -0.029;
Temp range 0.134°C to 0.131°C
While Dr. Spencer has posted the August numbers, they are not yet here:
http://vortex.nsstc.uah.edu/data/msu/v6.0beta/tlt/tltglhmam_6.0beta3.txt
As a result, they are not on Nick’s site yet. However the slope was very slightly negative at “Rate: -0.016°C/Century from April 1997 to July 2015”. With the higher August anomaly, the time may change from May 1997 to August 2015 where the slope is very slightly negative. This is still 18 years and 4 months. Because I did not want to make a big deal out of the small negative number, I said “essentially zero”.

Svante Callendar
Reply to  Werner Brozek
September 7, 2015 9:33 am

Werner Brozek.
I get a positive trend for that timeframe. The confidence interval is around +/- 0.17C per decade which is much larger than the slope of the trend so the result is not statistically significant.

Werner Brozek
Reply to  Werner Brozek
September 7, 2015 6:52 pm

I get a positive trend for that timeframe.

Just to be clear, you get positive for UAH6.0beta3 from April 1997 to July 2015? And you are not using WFT which uses UAH5.6? If that is indeed the case, you may want to take it up with Nick.

Svante Callendar
Reply to  Svante Callendar
September 6, 2015 10:49 pm

“Dr Mears indeed says he prefers the terrestrial tamperature datasets to his own dataset. He is of course entitled to his opinion.”
Yes, what would Dr Mears know as Vice President/Senior Research Scientist of RSS, the big dummy 🙂

richardscourtney
Reply to  Svante Callendar
September 7, 2015 10:00 pm

Svante Callendar:
It seems you have been learning to use the Appeal To Authority fallacy from warrenlb. I write to explain your error.
Whether or not Dr Mears is a “big dummy”, his unjustified opinion is of no more value than an unjustified opinion from anybody else; i.e. it is worthless.
If you have a link to a justification of Mears’s opinion then that justification can be evaluated. But until you provide such a link then your comments are meaningless bloviation which only serve to waste space in the thread.
Richard

Svante Callendar
Reply to  Svante Callendar
September 8, 2015 2:49 am

richardscourtney.
I can’t believe you said that. So an “appeal to authority” to Lord Monckton is OK, but an “appeal to authority” to the Vice President/Senior Research Scientist of RSS is not.
So I can see what your job in this forum is, to derail threads by posting a lot of obvious nonsense and distract from genuine and honest discussion. This forum really does have quality issues.
PS you obviously did not read Dr Mears blog did you, he explains why he feels the surface data sets are more reliable than the satellite data sets.

September 5, 2015 4:46 pm

Dear Christopher Monckton of Brenchley,
Strength in numbers adds up.
Make a call to Donald Trump and gather together with Mr. Trump when he does his Dallas Texas visit at the American Air Lines Center and you and he do the Climate Change fact check list live and on TV.
Soon in Sept. he says.
The media just can not turn away from the numbers of eyes he brings to the add revenue.
Might be a nice little moment in time for both of you.
Yes, I am a bit of a trouble stir person.
Thanks,
fob

September 5, 2015 6:13 pm

“the Pause that lengthens, yet again” represents a huge amount of work, as much as a full length article in Science would involve. In looking it over I nevertheless found reasons for improving or changing some parts of it and am adding appropriate comments. If this were a peer review I would probably say similar things. I touch on six selected subjects, not all of equal weight, that the author should find useful in his further work.
[1] Figure 1a – Nino 3.4 index etc… You state that “…warmer sea surface temperatures in the Pacific will be carried around the world by the thermohaline circulsation…” This is untrue. Nino 3.4 sts directly in the middle of the equatorial countercurrent, the route an El Nino wave normally takes in crossing the Pacific. Once it has crossed the Pacific it runs ashore in South America, spreads out north and south along the coast, and warms the air above it. Warm air rises, joins the westerlies, gets carried aroind the world by them and we notice the arrival of an El Nino. A beautifuk example of it is a wave train of five El Ninos in rhe eighties and nineties. Some things can go wrong with this, however. One of them is the variable border between the westerlies and the trades which may influence the fate of the rising warm air. Muddying the waters that way probably accounts for El Nino irregularities during the first seven years of this century as well as currently. Another problem may be a mechanical obstruction of the equatorial countercurrent that can stop an El Nino wave in its tracks. When this happens the warm water of the El Nino wave simply spreads out in the Central Pacific and creates an El Nino on the spot instead of along the coast. It is called an El Nino Modoki or CP El Nino and the La Nina that follows could also be abnormal. The natural frquency of a complete El Nino cycle is about four-five years. That of the thermo-haline oscillation could be fifty years judging by a damped oscillastion recorded by the Berkeley Earth people they have not evennoticed yet.
[2] Figure 1b, the mean of GiSS, HadCRUT4 AND NCDC. I consider these three data-sets worthless. First, they are involved in covering up the hiatus of the eighties and the nineties. I discovered the existence of this hiatus in 2008 while doing research for my book “What Warming?” and it is shown as figure 15 in the book. Fortunately these peoplle still don’t control the satellites or we would never even have known about it. The fact that the three groups cooperated comes from the observation that they used the same computer to adjust their outputs. It left identical traces of its work on their temperature curves. These consit of sharp upward spikes and tTwo of them are visible right on top of their 1998 El Nino in this figure. Find more by comparing it with satellites back to 1997. Their upward slope is totally phony too, just a continuation of the fakery that started with the coverup of the hiatus of the eighties and nineties.
[3] Figure 2 is dead wrong because you are comparing apples and oranges with your fitted curves. It contains two El Nino peaks on the left, followed by the super El Nino of 1998. Those two are part of an ENSO wave train of four whose beginning you don’t see. To display these data correctly you should have two horizontal fitted lines on both sides of the super El Nino that do not make contact, one for each hiatus there. And show everything back to 1979, the beginning of the satellite era. FThe wave train on the left is part of an ENSO oscillation that is cut short by the appearance of the super El Nino of 1998. That one does not belong to ENSO and is a rare one you might get once in a century. It must not be included in any curve fit involving parts of ENSO. It follows that the temperature curve fitted to the left side should stop at the beginning of 1997 and not be connected to the right side at all. In satellite data it forms a hiatus shown as figure 15 in my book. The current hiatus is also part of Figure 2 and comprises a straight horizontal line starting in 2002, the end point of the step warming. Thanks to that step warming of 1999 the twenty-first century temperature is a third of a degree higher than the twentieth century is. It raises global temperature by a third of a degree Celsius in only three years.Year 2002 is therefore the correct year to begin the present day hiatus , not 1997 as is commonly used. The hiatus itslf is flat as satellite data show, not sloping up as HadCRUT, GISS and NCDC tell us. These ground-based data sets show falsified warming but you can get the real data for the hiatus of the eighties and nineties by using the satellite database. Hansen noticed the warmth at the beginning of the twenty-first century and quickly claimed it for the greenhouse effect. He was wrong. It is quite impossible to create a three year warming by means of the greenhouse effect. To start it, you need to inject carbon dioxide into the air, and we know this did not happen in 1999. To stop it you would have to pluck out all carbon dioxide molecules from the air and this sure did not happen. Hansen got away with his greenhouse fantasy for the twenty-first century because apparently no one in his camp knew any physics.
[4] Figure 3 is actually redundant if fig. 2 is done right.
[5] Figure T1 – Global mean etc. There are several problems. First, resolution could be better. You could also have drawn in the lines defining the two hiatuses, the current one on the right and the one in the eighties and nineties on the left. And why waste time with models? Not only are they worthless but they also perpetrate the myth of volcanic cooling. They show an imaginary El Chichon cooling that does not exist here simply because it is written into their code. There is no cooling after El Chichon in real life. As to Pinatubo, the cooling you assign to it is an ordinary La Nina valley, not any volcanic cooling. Sad to say, that applies to all volcanic coolings entered in global temperature graphs. Read pp. 17-21 in my book and get it straight.
[6] Figure T3 — CO2 emissions etc. This is actually irrelevant because CO2 is not the cause of global warming but this fact itself needs to be made clear. Not because I say so but because observations of nature say so. As the current paper states, we observe that “THE PAUSE LENGTHENS YET AGAIN.” The Arrhenius greenhouse theory used by the IPCC requires that if you add carbon dioxide to the air it will get warm. Let me explain. Right now, today, there is no such thing as global warming. And there has been none whatsoever for the last 18 years, not because I say so but because scientific measurements of global temperature say so. This lack of warming now has a name, the hiatus. What happens during this hiatus is that atmospheric carbon dioxide keeps increasing but global temperature does not. This increase of atmospheric carbon dioxide is caused by all the fossil fuels we burn and according to their doctrine it should cause global warming. But there is a problem. According to the greenhouse theory of Arrhenius, the one used by IPCC that keeps official records, addition of this anthropogenic carbon dioxide to air should warm the air by its greenhouse effect. Supposedly it does that by absorbing the infrared radiation that leaves the atmosphere for outer space and converts it into heat before it can slip away. This outward bound radiation is part of the heat balance of the earth as a whole. It is how the earth gets rid of the warmth it absorbed when the sun was shining. Clearly, if you do not get rid of it global temperature will keep rising and this is what global warming is all about. According to the Arrhenius greenhouse theory this temperature rise should be happening right now. Except that it doesn’t. So what is wrong? Is Arrhenius theory wrong? It does give wrong predictions about warming. If a scientific theory gives wrong predictions it is considered invalid and belongs in the waste basket of history. Especially so if it has been wrong eighteen years in a row. Fortunately for us there is an alternative reenhouse theory that does not suffer from the problem that Arrhenius has. It is called the MGT (Miskolczi greenhouse theory). It was summarily rejected by IPCC in 2007 when it first came out. MGT differs from Arrhenius in being able to handle absorption by more than one greenhouse gas at the same time. Our atmosphere contains several such gases but Arrhenius can handle only one – carbon dioxide – and is incomplete. According to MGT, carbon dioxide and water vapor, both greenhouse gases, form a joint optimal absorption window in the infrared whose optical thickness is 1.87. This value was measured by using radiosonde observations. If you now add carbon dioxide to the atmosphere it will start to absorb, just as Arrhenius says. But this will increase the optical thickness. And as soon as this happens, water vapor will start to diminish, rain out, and the original optical thickness gets restored. The added carbon dioxide will of course keep absorbing but the reduction of water vapor has reduced the absorptivity of the atmosphere and prevents any warming from taking place. As a result, what we see is that carbon dioxide keeps increasing but there is no simultaneous warming that the Arrhenius theory requires. And this is exactly why there is is no warming during the hiatus. You will of course immediately realize that thus makes greenhouse warming in the earth atmosphere impossible.. There are large numbers of climate scientists who apparently have cme to the same conclusion. More than two dozen of them have written scholarly, peer-reviewed articles in an effort to prove that the hiatus does not exist. They are desperate to find that “lost heat” somewhere, even if it means looking at the ocean bottom. They have not succeeded, for the simple reason that the missing heat left for outer space before they even got started.

ren
Reply to  Arno Arrak (@ArnoArrak)
September 6, 2015 12:14 am

Low solar activity and meanders jetstream affect the decrease in wind speed over the oceans and the decline of water vapor.

Mervyn
September 6, 2015 5:11 am

It makes one wonder what the “hockey stick” lovers, like Sir John Houghton, would have to say over this flat global average temperature anomaly trend of18 years and 8 months?
Can someone visit the ‘state pen’ … oops, sorry… I meant Penn State university and seek out Mann’s opinion?

September 6, 2015 7:35 am

It becomes more and more likely that earth has just passed a peak in both its 1000 year+/- and 60 year +/-natural temperature cycles.
http://3.bp.blogspot.com/-gH99A8_0c6k/VexLL1zC7AI/AAAAAAAAAaQ/T50D6jG3sdw/s1600/trendrss815.png
The graph above better illustrates where we are with regard to the natural cycles and where we are headed with regard to climate. The inflexion point at about 2003 correlates with the peak in solar activity at about 1991 as seen in the neutron count. The delay reflects the thermal inertia of the oceans
http://3.bp.blogspot.com/-QoRTLG14Siw/VdOUiiFaI5I/AAAAAAAAAYM/NxQVb2LMefk/s1600/oulu20158.gif
For forecasts of the timing and amplitude of the coming cooling see
http://climatesense-norpag.blogspot.com/2014/07/climate-forecasting-methods-and-cooling.html

richard verney
Reply to  Dr Norman Page
September 6, 2015 9:10 am

But your green line should be flat (at around the zero deg C, or just a bit below, say at – 0.05degC) between 1980 and 1996,
When one eyeballs the satellite data, temperatures were flat (apart from seasonal variations) between about 1980 and 1996. This is the first ‘pause’ (approximately 17 years in length) seen in the satellite data.
The second ‘pause’ seen in the satellite data is the present ‘pause’ which is the subject of this present article by Lord Monckton. Why he does not mention the first ‘pause’ (as from the satellite launch in 1979 through to about 1996) is a mystery to me. It is extremely relevant when one is discussing climate sensitivity (if any) to CO2..
What will happen to future temperatures will probably be dictated by the oceans, and the amount of solar energy that they are absorbing and/or releasing to the atmosphere.

Reply to  richard verney
September 6, 2015 10:01 am

Note I said “The graph above better illustrates where we are with regard to the natural cycles ”
Every one has to cherry- pick the data to illustrate the idea they are trying to put across. In my case I want to stress that the rise is part of the rising trend of the 1000 year cycle. Of course there are shorter term highs lows and pauses within that rise. But that is a subject for a different discussion better illustrated by a longer data set.

ren
Reply to  Dr Norman Page
September 6, 2015 9:13 am
September 6, 2015 8:37 am

Not sure how much reliance can be placed on analyses based on cyclical trends. The mathematical objection to applying too much cyclical analysis to the climate is that the object behaves as a mathematically-chaotic object and the timing of the cycles is accordingly aperiodic or, at best, quasi-periodic.
There are many voices now saying that we are heading for a cooling. And, like all the voices, they should be fairly heard. But they should be heard with caution.

richard verney
Reply to  Monckton of Brenchley
September 6, 2015 9:18 am

No one knows what the future has in store, and nature will do its thing and let us know.
Any prediction as to the future is a guess. But if we carefully observe and monitor what happens during the course of the next 10 to 15 years, it is likely that we will thereby gain a far better understanding of the workings of the atmosphere and what influences change.
If temperatures do not begin to rise then we will be fairly certain that CO2 is at best a bit player. In this regard a release of heat from the oceans pursuant to this years El Nino, will not be CO2 induced warming, so if there is another step change in the satellite data (as seen in the response to the 1998 Super El Nino), this will not further the AGW meme. Indeed, it will do the opposite, namely suggesting that all temperature rises during the satellite data are natural of origin, being driven by oceanic events (not CO2).

M Simon
Reply to  Monckton of Brenchley
September 6, 2015 10:20 am

The quasi-periodicy seems to hold for the interglacials. As you might expect for a chaotic system. They are post predictable and so give some predictive confidence if the signal pattern does not change and the system is also relatively (well what ever that means in our state of ignorance) unchanged.
The graphs below (or is it above?) do show no abrupt change in the signal pattern of temperature. So far.
But even if we know the local pattern drivers we still know nothing about GCR strength variations. Not to mention solar modulations.
None the less I line up with the coolers.

Reply to  M Simon
September 6, 2015 12:23 pm

Simon. Not so – the general relationship between GCRs and Temperature is reasonably clear in the 10 Be data .See below the 1700+/- peak ( Maunder solar activity low), and the Dalton temperature minimum, 10Be peak ,(activity low) at 1815 or so. The 20th century warming trend shows up well in the declining 10Be trend in the Dye 3 data.
http://4.bp.blogspot.com/-cmUdPuT0jhc/U9ACp-RIuSI/AAAAAAAAAT8/kBTHWwpf6Bg/s1600/Berggren2009.png
For links to the original data sources see
.httpp://climatesense-norpag.blogspot.com/2014/07/climate-forecasting-methods-and-cooling.
The system in general is simply not chaotic in any meaningful sense. The patterns in the temperature data are clearly meaningful and useful . This doesn’t mean that they are computable ,however, because we don’t know enough details about the various component systems.

September 6, 2015 9:38 am

The timing of the cycles depends on the beats between the phases of a large number of, what you call “quasi “- periodic processes. However the principal astronomical cycles have been stable for hundreds of millions of years and we can calculate the ephemerides back for about 55 million years before the rounding algorithms on different computers cause the outcomes to diverge. I am sure that numerical models ie the IPCC GCMs provide no useful outcomes for climate forecasting because we cannot parameterize the inputs an a fine enough special or temporal grid.
However the outcomes in the real world ( think of it as a virtual computer if you are mathematically and numerically inclined) are clearly sufficiently coherent as to provide obvious quasi- periodicities.
http://3.bp.blogspot.com/-fbW69d6Nf-c/VdN7jJy-kII/AAAAAAAAAXk/hCNcOZTsvWU/s1600/GISP2%252520TemperatureSince10700%252520BP%252520with%252520CO2%252520from%252520EPICA%252520DomeC.JPG
See the peaks at about [10000],9000.8000,7000 …. 2000,1000 and current ( the Fig cuts off about 1850- imagine the recent warming tacked on)
Moving to the last millennium we are obviously now approaching, just at or just past a millennial peak .
http://1.bp.blogspot.com/-Mj4eZioh8C8/VdOHYKQnKrI/AAAAAAAAAX4/JU-PJhgqKEg/s1600/fig5.jpg
To decide where we are see
http://climatesense-norpag.blogspot.com/2015/08/the-epistemology-of-climate-forecasting.html

ren
Reply to  Dr Norman Page
September 6, 2015 11:58 am

It is worth noting the temperature drop over the southern polar circle, leading to an increase range of ice in Antarctica.
http://www.cpc.ncep.noaa.gov/products/stratosphere/temperature/70mb6590.png

M Simon
September 6, 2015 10:02 am

dbstealey September 5, 2015 at 6:02 pm
Flying saucer delayed? It is my contention that it has attained light speed and is no longer observable. That also explains the missing heat.

September 6, 2015 8:11 pm

I keep wondering why an El Nino will make any difference. Isn’t there a huge blob of warm water already hugging the entire Pacific coast of North America? Wasn’t rainfall in Oregon and California suppressed anyway? If there’s another mechanism at play, how will the warm water from an El Nino make any difference except to possibly make the West Coast drought even worse?

sturgishooper
Reply to  gloccamorra
September 6, 2015 8:14 pm

The Pacific NW drought has been decisively broken this week.
Rain, rain, go away. Come again some other day.

ren
Reply to  gloccamorra
September 6, 2015 10:09 pm
September 6, 2015 11:27 pm

To claim there is been a “pause” in the global warming is to define the “global warming” such that the global warming in a given interval is multivalued, negating the law of non-contradiction. Thus, though true that there has been no global warming in a recent interval of time it is also true that there has been global warming in this interval. As I’ve posted proofs on several occasions I won’t repeat them unless asked.

Reply to  Terry Oldberg
September 7, 2015 11:29 pm

Void for uncertainty of meaning.

fretslider
September 7, 2015 1:37 am

18 years and 8 months is in the new SI unit
1.098 Santers
Where one Santer = 17 years or 204 months

Reply to  fretslider
September 7, 2015 10:57 pm

Yes, and let’s not forget the Madoff Unit of theft from humanity. $17 Billion if I’m remembering correctly. Maybe Lord Stern could weigh in here.

September 13, 2015 8:28 am

Reblogged this on Climate Collections and commented:
18 years, 8 months