Guest Post by Bob Tisdale
This post provides background information and a quick update on the naturally occurring warming event in the eastern North Pacific known as The Blob. Not just any blob, The Blob.

Figure 1
INTRODUCTION
We first discussed an unusual hotspot in the sea surface temperature anomalies of the eastern extratropical North Pacific two years ago in the August 2013 post appropriately titled About the Unusual Warming Event in the Extratropical North Pacific Sea Surface Temperature Anomalies. That large pocket of elevated sea surface temperatures has been given the nickname The Blob. Since that first post, we’ve discussed it numerous times, along with its impacts on global surface temperatures:
- The Hotspot in the North Pacific (February 2014)
- On The Recent Record-High Global Sea Surface Temperatures – The Wheres and Whys (August 2014)
- Axel Timmermann and Kevin Trenberth Highlight the Importance of Natural Variability in Global Warming… (November 2014)
- Researchers Find Northeast Pacific Surface Warming (1900-2012) Caused By Changes in Atmospheric Circulation, NOT Manmade Forcings (December 2014)
- Did ENSO and the “Monster” Kelvin Wave Contribute to the Record High Global Sea Surface Temperatures in 2014? (December 2014)
- Alarmists Bizarrely Claim “Just what AGW predicts” about the Record High Global Sea Surface Temperatures in 2014 (January 2015)
- North Pacific Update: The Blob’s Strengthening Suggests It’s Not Ready to Depart (April 2015)
WHAT CAUSED THE BLOB?
Answer: According to Bond et al (2015), a persistent ridge of high pressure in the mid-to-high latitudes of the eastern North Pacific prevented the sea surfaces there from cooling normally. The Ridiculously Resilient Ridge is also responsible for the high temperatures and drought conditions along the west coast of the U.S. See Anthony Watts’s April 2015 post “Warm blob” in Pacific Ocean not caused by climate change, affects U.S. weather at WattsUpWithThat. It includes the press release for two papers: Bond et al. (2015) Causes and Impacts of the 2014 Warm Anomaly in the NE Pacific and Hartmann (2015) Pacific sea surface temperature and the winter of 2014.
WHAT’S NEW WITH THE BLOB?
Figure 2 presents the satellite-enhanced sea surface temperature anomalies (Reynolds OI.v2 data, not the pause-buster data) for The Blob, using the coordinates of 35N-55N, 150W-125W. The sea surfaces of The Blob continue to show warming, after a multidecadal period of no warming through 2012.

Figure 2
Based on the monthly data, Figure 3 shows the annual evolutions of The Blob’s sea surface temperature anomalies for the years 2012, 2013, 2014 and year-to-date 2015. Our base year with no warming is 2012. The majority of the warming took place in 2013. Then, in 2014, sea surface temperature anomalies ended a tick lower than they started in January. The sea surfaces of The Blob are once again warming in 2015, likely in response to the strengthening El Niño.

Figure 3
CLOSING
I closed the April 2015 Blob post with the following questions. They’re still valid:
- How long will The Blob and the Ridiculously Resilient Ridge last?
- Assuming a La Niña follows this El Niño, will the La Niña be strong enough to overcome The Blob and the Ridiculously Resilient Ridge?
- What will be the combined effects of the strengthening El Niño, The Blob and the Ridiculously Resilient Ridge on weather worldwide over the next 12 months?
- Will the El Niño be strong enough to overcome the other two and bring rain to California, or will The Blob and the Ridiculously Resilient Ridge continue their influences there?
- Will The Blob have a long-term impact on the sea surface temperatures of the Eastern Pacific Ocean as a whole? That is, will The Blob be responsible for another upward shift in the sea surface temperatures of the East Pacific Ocean like that in 1976/77?
SOURCE
The data and maps presented in the post are available through the KNMI Climate Explorer.
>>A persistent ridge of high pressure in the mid to high latitudes of the eastern North Pacific prevented the ocean surfaces there from cooling normally.<<
Really? Is this a fact or is it someone's theory? If it is a well-established fact then please explain to this novice the dynamics of how the atmosphere has kept the northern ocean warm. I've seen so many cockamamie theories presented as fact in recent years, I am unable to separate out what is real from what is only a theory. Anyone care to comment?
No response in nearly 24 hours. So this is a theory that apparently doesn’t have much of a basis. My theory is that submarine volcanism has caused this hot spot.
The Blob seams to be part of a STATIONARY WEATHER PATTERN along the same latitude:
—– Blob Warm — Hudson Bay Cold — Central Europe Warm —- Siberia Cold ( see Sea Ice Page:
Ice Remnants on Siberian Coast). This stationary feature reveals a CALMING of the atmosphere
with less pressure gradients…..(thus also less tropical cyclones)….a few things are connected with a common cause……
I have to wonder if it is related to the Juan de Fuca subduction zone – an area of submarine tectonic activity (and occasional INTENSE earthquakes!) associated with the Juan de Fuca tectonic plate.
I have not yet seen any acknowledgement among the ‘climatologists’ that submarine volcanic and/or tectonic activity (which releases tremendous amounts of heat!) can contribute to local ocean warming which gravity (through the process called convection) can transport to the sea surface directly.
Hi Bob,
Forgive me for asking if you’ve already explained it in the past, but what makes this SST configuration so unusual. Is the SST pattern not merely a manifestation of the positive phase of the PDO over the past couple of years ?
“How long will The Blob and the Ridiculously Resilient Ridge last?”
Well, and I don’t want to give the wrong impression that I am “predicting” anything here, but the “Ridiculously Resilient Ridge” is a condition thought to have triggered the formation of the Cordilleran ice sheet in Western North America. The notion being that a more meridional jet off the west coast pushed more moisture to the north depositing more snow in the Columbia Icefield. This resulted in glaciers like the Athabasca advancing across Alberta and eventually down into Montana. Also, more recent data indicate periods of several hundred years of drought have occurred in the central Sierra Nevada in the past 1000 years. One period was at least 200 years long and resulted in the levels of some Sierra Lakes to be over 100 feet below today’s levels.
So the answer to the question is … anywhere from a week to a few centuries.
http://climexp.knmi.nl/data/ihadisst1_210-235E_35-55N_n.png
http://climexp.knmi.nl/data/ihadisst1_210-235E_35-55N_na.png
I’m going with the SST for this region will be back to 0 anomaly with 1 year.
In the past extreme excursions have been short lived. This is either samo-samo or new behavior. If it isn’t back to nearly average in 1-2 years this region is doing something new.
If it does last more than 2 years and we start going into ice age mode drastic steps will be needed. Subsidizing unfiltered coal use and a radical increase in CO2 emissions may be necessary. Both soot and CO2 warm the arctic. In the US significant portions of the EPA would have to be RIF’d (Reduction in Force) and the savings, together with the $20+ billion in repurposed climate change funding, used to subsidize more fossil fuel consumption.
PA. It took 5 years to form, expect it to take 5 years to dissipate. IMHO See Bob Tisdale’s animation and previous posts where a bunch of folks made their predictions – I said 5 years then, I still think 5 years. But I have been wrong before. 😉
Historically extreme deviations are short lived. The Blob appears to be part of the 2 year old El Nino pattern. When the La Nina starts next year we will see how the Blob holds up. I expect it to disappear.
On the other hand we are on the edge (within a couple of Watts) of an ice age tipping point.
The global warmers are right about tipping points – but we are near all the cool ones and have been losing 0.25°C per millenia for 8000 years according to this:
http://wattsupwiththat.com/2012/09/16/onset-of-the-next-glaciation/
http://www.msn.com/en-us/weather/topstories/think-the-next-ice-age-is-1000-years-from-now-try-15/ar-AAcUrwE
Given that we are at a Milankovitch and solar minimum it could get interesting. If we start entering the ice age that is pretty much it,
Has this type of condition never happened before ?
Not in the satellite era. Before that, records are sparse.
Does that not also imply that we don’t have a full understanding of all the factors in play during the Dust Bowl?
Last really significant one was likely about the time of the Little Ice Age
https://www.hcn.org/issues/44.22/underwater-forest-reveals-the-story-of-a-historic-megadrought
So the high pressure keeps the heat from escaping and then the normal southerly current move sthe warm water down along the coast, right? Then doesn’t the heat escape along the way?
I wouldn’t say it “keeps heat from escaping” so much as the southerly flow offshore prevents colder water from the gulf of Alaska being blown down the coast. Note this is an anomaly graphic which means the water is 2 degrees warmer than normal. It’s still pretty cold. The wind blows from south to north instead of from west to east when we have this condition. The ocean surface gets more sunshine than normal, too. The last few years have seen tremendous amounts of rain but it has all been 500 miles out to sea from the California coast and pushed north into Alaska and British Columbia instead of into Washington, Oregon, and California.
Bob:
You just don’t get it. The approximately 3 – 5 ppm increase in CO2 from 2012 – 15 has forced an 2 – 4 deg C increase in the North East Pacific surface temps EXACTLY like the models predicted. 🙂
A more serious thought/question
“According to Bond et al (2015), a persistent ridge of high pressure in the mid-to-high latitudes of the eastern North Pacific prevented the sea surfaces there from cooling normally.
This layman’s gut feel says agrees with Don’t Get Out Much’s sentiments. Bond’s assessment has it backwards. The warmer sea surface temps helps create persistent ridge of high pressure and the associated effects that come with it.
Why do I tend to think in that direction?
If I recall correctly from a past post on WUWT, atmospheric temps has a 0.83 correlation to changes in sea surface temps. I do believe that correlation/causation link here. i.e. sea surface temps do cause atmospheric temps increases.
Looking at the Thermohaline circulation. As the poles freeze and the denser water sinks, it initiates a chain effect and eventually push water up somewhere. Depending the freezing rate the amount of displacement will vary accordingly. I would be asking the question does the up-welling water in the NE Pacific has more heat energy contained in it than previous years, ergo higher temps, creating a high pressure dominant ridge. If so, where is that higher heat content water coming from? At what rate? What is the heat content further up the supply chain? Then you can start to determine when it will end.
One question I have is the energy content. While volume may vary with the freezing rate at the poles, given the ice will freeze at a constant temp, I would think the energy content on a per volume basis would be constant. So, if we look at the supply chain system, where does that extra heat content in the up-welling water come from? I just can’t see the sun being so area specific it would create the blob.
Is anybody studying the ocean temps in the X, Y and Z direction to any degree beyond the broad scoped ocean current temp diagrams we see all the time? i.e. are they breaking areas down to the same degree climate models break the atmosphere into? Your thoughts?
Cheers
Mike
One thing I do know, as a Vancouver, BC area resident, I’m not buying a local area ski pass this winter. Waste of money last year and given the warm/warming NE Pacific ocean temps, I see another crappy season coming. We’ll find out soon enough.
Mike H. I agree with you. Have seen this pattern before (I’m old). I wouldn’t buy a pass for Grouse, Seymour or Whistler. But I bought my pass for Sunshine. Snow wasn’t great last year but enough came early that I skied Lake Louise and Sunshine in November in great Pow for the first time in years; lasted into January then not so good till spring but the back country in the Rockies was excellent. Get out of the Lower Mainland and come to ski country. 🙂
l think The Blob is a sign of climate cooling across the northern Atlantic side of the NH.
lce ages are caused by static weather patterns over many years. The real threat from the Blob is that it sets up the ‘Arctic Blast’ weather pattern across North America. This weather pattern starts to become a real threat when it starts to turn up every winter and then extends itself into the spring. Because should this happen for long enough, then along with other factors it takes the whole Northern Atlantic side of the NH into climate cooling.
http://www.woodfortrees.org/plot/esrl-amo/from:1950/plot/hadcrut4gl/from:1950
A other thing to watch is low pressure over northern Russia. Should this weather pattern become static during the summer and then linger into the winter. Then it risks moving the high pressure that would otherwise sit over this area during the winter. To move westwards and sit over northern europe instead. So there will be cold air pushing down across the northern Atlantic area on two fronts. Risking a pincer movement that takes the whole area into major climate cooling.
Look at the changes in the magnetic field and solar activity. The lower activity, the more impact of the magnetic field.
http://www.esa.int/Our_Activities/Observing_the_Earth/Swarm/Swarm_reveals_Earth_s_changing_magnetism
What causes the weather patterns to become static l don’t know.
But the ice ages suggest that they can stay that way for at least 100’s of years. Because the ice age shows that its not just the ‘Arctic Blast’ pattern that can become stuck. But also blocking high pressure between Greenland and NW Russia during the winter months. With what’s been happening over Russia for the last month or so. l now feel that l understand what could be the cause of this.
Likely we now have the instrumentation to identify the causation of long drought conditions characteristic of the region.
Several have talked about Hudson bay here and how the ice is lasting longer.
This from the NorthwestPassage2015
In 2014, the Bellot strait was still clogged with ice as late as Sept 9. It cleared enough to let 4 ships pick their way through and stayed open a week or two. The M/V Silver Explorer made a westward passage throught the Franklin/Victoria strait with the help of an icebreaker. http://wattsupwiththat.com/2014/09/03/has-arctic-sea-ice-made-the-end-of-melt-season-turn-prematurely-this-year/#comment-1739735
Northwest Passage Ice Concentrations – Queen Maud 12-Aug-2015
The Bellot Strait is that narrow break in the isthmus at 72 N 95 W.
http://ice-glaces.ec.gc.ca/prods/WIS38CT/20150812180000_WIS38CT_0008414805.gif
I don’t know about the rest of California, but here in the Eastern Sierra, El Nino has already been working for us…some areas are 250%, some 800% of normal precipitation for the new water year.
Now if El Nino sticks around and keeps working for us through the winter, that will be some real precipitation.
From Arsoles and Aha-has to Vini vidivicis
to Agathidium vaderi and the Big Bang,
the scientific world does not want for silly names. Just search for –
funny science names
Re: ‘Blob’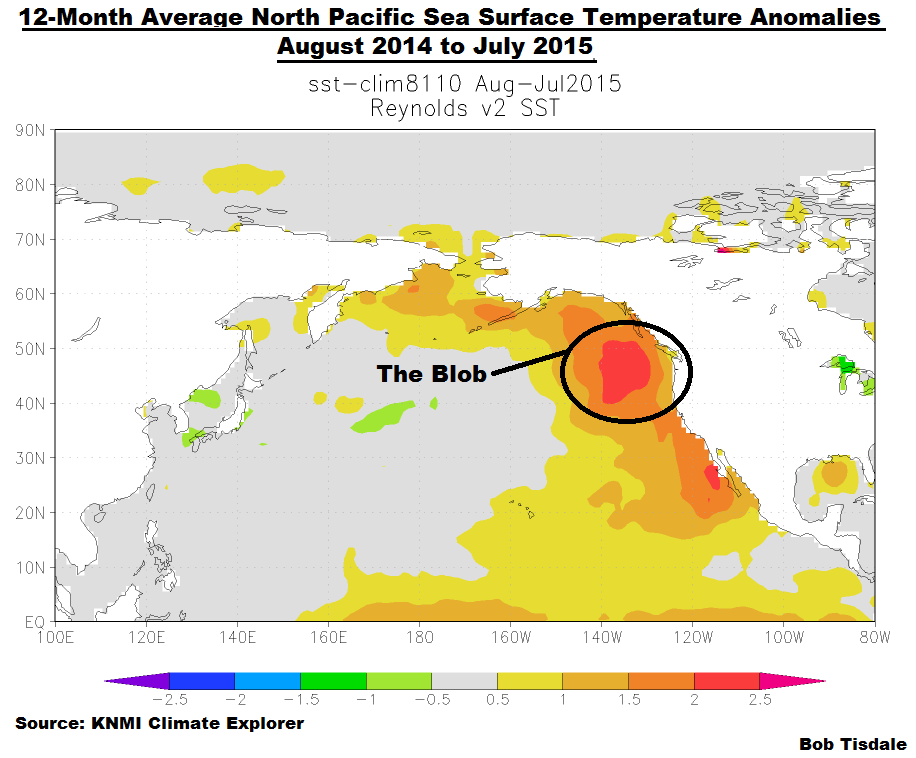 ?w=720
On number of past occasions I have commented that the significant temperature trend changes are caused by ocean currents in the area of confluence of the warm and cold currents.
One of those areas is just east of Japan
http://www.pmel.noaa.gov/np/images/maps/KuroshioOyashio.jpg
The Kuroshio Current (in red arrow) runs off the coast of Japan. It is a strong and very large warm surface oceanic current travelling 40 to 121 km/day at 1.6 to 4.8 km/h. At about lat. 35°N it divides to form an eastern branch flowing nearly to the Hawaiian Islands and a northern branch that skirts the coast of Asia and merges with the waters of the cold Oyashio Current to form the North Pacific Current.
The Oyashio Current (in green arrow) is a cold subarctic current that flows south and circulates counter-clockwise along the western North Pacific Ocean. The two currents collide near eastern shores of Japan forming the North Pacific Current.
North Pacific current that splits into the Alaska Current and the California Current The Alaska Current curves to the north into the Gulf of Alaska creating the Alaskan Gyre, while
the California Current veers south and flows around the East Pacific Gyre.
http://www.physicalgeography.net/fundamentals/images/oceancurrents.gif
Location of the Blob
In 2011 ocean floor topography at the confluence of Kuroshio (warm) and Oyashio (cold) currents to east of Honshu island was disturbed by magnitude 9 earthquake, having an effect on the surface currents circulation.
http://www.mediotech.co.jp/item/20110404_3.png
Enter your comment here…
vukcevic:
Let’s just say you are correct.
How long do you think it will be until someone claims that what you’ve described was caused by increased atmospheric CO2 levels?
Hmm…., good point.
Earthquakes are known to be releasing large quantities of CO2.
The area where I come from has the highest concentration of CO2 to be found anywhere in Europe; it is due to the local tectonic plate’s subduction
http://www.vukcevic.talktalk.net/SEE-CO2.jpg
(white circles a recorded earthquakes)
Honestly, the blob is still quite cold water (12-15C), but the interesting part is that it is warm to 500 m depth (see WUWT ocean reference page). How can this be a surface coverage effect? To me, it looks like a stream instability where the current coming down the coast has been diverted to the central pacific (where there is a cold spot). I was looking for ocean current data to show that the blob can’t disperse because of reduced current. Any idea where to find that?
Or due to a large deep sea volcanic eruption such as the none posted earlier:
http://www.csmonitor.com/Science/2015/0503/Underwater-volcano-spewing-lava-off-Oregon-coast-video
Hi JDN
Richard G posted this link
http://www.opc.ncep.noaa.gov/Loops/GRTOFS/currents/GRtofs_Curr_Wcst_03_Day_flash.shtml
Here is another one showing the north central Pacific.
http://www.opc.ncep.noaa.gov/Loops/GRTOFS/currents/GRtofs_Curr_Pac_03_Day_flash.shtml
“..a quick update on the naturally occurring warming event in the eastern North Pacific known as The Blob”
Hmm…”naturally occuring”. Nice touch
“We first discussed an unusual hotspot in the sea surface temperature anomalies of the eastern extratropical North Pacific…”
Ok….so…an “unusual ..[but]…naturally occuring hotspot”
Seems the Paper highlighted in your post: https://bobtisdale.wordpress.com/2014/12/17/researchers-find-northeast-pacific-surface-warming-1900-2012-caused-by-changes-in-atmospheric-circulation-not-manmade-forcings/ managed to just miss the Blob! Wonder what the authors would make of it now!
Possibly what Dan Cayan of the Scripps Institution of Oceanography says holds true “there’s no doubt that this anomaly in sea surface temperature is very meaningful”.
The paper you so freely quote ( http://www.pnas.org/content/111/40/14360.full ) concludes:
“Further study may clarify the mechanisms behind the low-frequency circulation-temperature variability of the NE Pacific, so that a fuller understanding of natural and anthropogenic changes can be attained.”
The jury’s still out, watch this space
If i remember correctly, didn’t Steve McQueen freeze The Blob using CO2? 😎
That was that “other CO2”, Gunga Din – you know, the CO2 that cools.
I’m sorry. Every time someone reference to the Blob, my mind goes right to the movie “The Blob”.. Get out the fire extinguishers
Can’t remember if they froze it, electrocuted it, or burned it.
They airlifted it to Antarctica.
Bob, I have wondered for quite a long time if the warm Kuroshio current can carry at times over to/influences North America, a process similar to the Gulf Stream which keeps Britain and Europe warmer than if it had not.
Keep up the great work.
The Blob was around in 1917-1918
https://mobile.twitter.com/BigJoeBastardi/status/431519673541066752
Hah! I did not see this before posting below that it was very possibly a multidecadal oscillation itself. I can believe that they could resolve it by 1917-1918, because by then WW I had forced an increase in the size of all of the world’s navies, and navy ships actually patrol and follow protocols for measuring temperatures and logging them. Weather forecasting as a numerical discipline didn’t formally start until 1922, but the world’s navies (especially the British) had been forecasting weather since the mid 1800s and forecasts had been widely disseminated since the invention of the telegraph, so one imagines that by WW I the navy’s methodology was already pretty advanced and that the discipline of making accurate measurements and communicating them by means of the new wireless technologies that were emerging by the beginning of the 20th century was starting to fill in at least strategically important parts of the vast terra incognita of ocean temperatures as a field.
rgb
The blob could be linked to the repeated abortive el Ninos. Poleward heat transport is slowing. Thus the Pacific gyre has slowed. In the Atlantic similarly the Gulf Stream is slackening. This could represent AMO/PDO conditions preceding a period of cooling climate
I wonder if this is a multi-decadal pattern of the North Pacific Gyre Oscillation? This oscillation combines sea surface temperature, sea surface pressure and fluid dynamics related to the complex systems of gyres in the northern Pacific. I do know this. The drought we have experienced in NE Oregon has a familiar ring to it, with a 20 to 30 year period in-between occurrences in my memory.
As an aside, see the link below for information on the rapid pace of discoveries related to global and regional scale oceanic/atmospheric systems. I wonder which group of scientists are beginning to question global warming being anthropogenic instead of driven by natural intrinsic systems.
http://earthobservatory.nasa.gov/Features/WarmPool/warm_pool.php
The Blob might be named Prigogene’s Ghost. It very likely is caused by global warming, because one of the responses of a turbulent, chaotic system driven by heat transport to an increase in driving is to self-organize its dynamic dissipative mechanisms — e.g. turbulent rolls — to increase dissipative efficiency. This is clearly evident in lab experiments on heat transport through fluid systems from the simplest to the most complex. Just as thunderstorms are comparatively small and local manifestations of this process that spontaneously form and transport surface heat in the form of latent heat and convected heat straight up through the greenhouse layer to locally warm the upper troposphere where the heat can be lost to space via radiation at many times the rate it can be lost to space down at the surface, just as the multidecadal oscillations themselves are very large scale (spatially and temporally) versions of the same thing, the emergence of The Blob as a (comparatively) “hot” spot (the water there is probably still very cold, it is just a lot warmer than it usually is) is likely the fluid system self-organizing a mode that will cool the overall Pacific much more efficiently than the same amount of heat raising the temperature a much smaller amount uniformly distributed across the ocean. Like ENSO, it could emerge, produce an anomalous cooling rate that overshoots “equilibrium” as it is maintained by the momentum of the convection fields even after the driving forces that created them drop below the critical value at which it emerged, and become the The Cold Blob in a year or two, or it could be comparatively stable.
However, although it raises surface temperatures in a local patch of ocean, note that this simply increases the overall cooling rate of the ocean compared to uniform distribution of heat-linked temperature change, just as does ENSO.
There are lots of interesting questions one could ask about this on the side, BTW — if TB is truly a previously unobserved multidecadal oscillation (which I wouldn’t find at all surprising) but one with a period of a century or so, one wonders if there was a similar warming that occurred in the 1930s, or if this was a stationary pattern and not even an oscillation that might have persisted before that, perhaps back when California was all mostly stable desert as was the case back in the 18th century and earlier. We have almost no way of answering questions like this — ENSO itself wasn’t discovered and named until just about the beginning of the 20th century. Back in the mid-19th century and earlier, there simply were no observers armed with thermometers anywhere near the Pacific Northwest on the land side, and fewer still on the ocean side. Portland, Oregon (for example) wasn’t founded until 1851. There would have been so very little ship traffic through that part of the ocean prior to that, and even after that it probably hugged the coast and would not have observed an offshore warming of 4-5 F or notably resolved an onshore warming of 1-2 F as an anomaly as they had no basis for measuring anomalies and had nothing like a standard laboratory grade procedure for measuring sea temperature from a ship in the first place.
There would have been almost no actual shipping through The Blob before the 20th century. Japan was closed, China was nearly closed, and sailing ships hugged the coast for transport up and down the western coastline of the US. I have no idea what sort of basis there is for any temperature measurements or assignments of “anomaly” temperatures to this part of the ocean in the 19th century, but I’m pretty sure they are sparse, inaccurate, and nearly useless as far as determining whether or not this is a regular phenomenon or one that is truly in response to global warming. I have no trouble believing that it is the latter, but without data the former can hardly be excluded.
Note well that if it did occur in the 19th century, it would have been invisible. All of the computations of “anomaly” temperatures for the 1800s would be too low, as they doubtless krige land and near shore temperatures across the vast empty unmeasured space, and hence are subject to enormous errors when in fact the temperature maxima exist and persist in the middle of that unmeasured space. Oops. The Blob strikes, and the place it hits the hardest is the error estimates and excessive cooling adjustments made to the earliest part of the anomaly, where the error estimates are absurdly small and the cooling adjustments indefensible.
rgb
Nonsense. You ascribe a source that does not have the energy necessary, nor evidence of its migration there, to create the Blob. Anthropogenic sourced downwelling longwave infrared, given its weak W/ms strength, does not have the energy to create that blob. Rgb, do the math for that volume of water and you will have to come to the same conclusion.
i my be wrong pamela, but i did not see the phrase “man made” ascribed to the global warming part of the post by rgb.
As noted below, I wasn’t ascribing a cause to the warming, only describing a predicted effect of warming whatever the cause.
However, please note that I also don’t subscribe (lots of scribing, here:-) to toy cartoon pictures of the total greenhouse effect, some reasonable fraction of which can be attributed to human generated CO2. The greenhouse effect can IMO best be understood in terms of TOA spectrographs that allow one to — within reason — identify the temperature/height of the emissions from the planet which cool it to balance the mostly SW incoming sunlight that warms it and produce a dynamic equilibrium temperature that is distinct from what one would expect if the planet had no atmosphere and emitted all outgoing radiation from a solid heterogenous surface as approximately blackbody radiation at a local surface temperature. In this view, the ALR plays a key role, as does mere blocking/absorption of LWIR in the active greenhouse bands until the atmospheric density is low enough to permit LWIR photons to escape to space at the temperature of the emission height and consequently at an emission “temperature” in the band that is much lower, usually, than the surface temperature beneath.
So I’m not really concerned with the intensity of the “downwelling IR” at the surface, as this is just part of one of four local mechanisms that couple the surface temperature to the temperature of the atmosphere right above the surface — conduction, convection, latent heat and radiation all four contribute to bidirectional energy transport at the surface. Over the ocean this is almost never in “thermal equilibrium” — something is always heating or cooling, and the ocean and atmosphere just above (meters above) the ocean are almost never in good agreement in temperature — one or the other is warmer or cooler by multiple degrees C much of the year or much of the time, partly because the specific heat and specific gravity of the ocean are both much larger than that of air and so it takes a lot of heat exchange to heat it or cool it and because it takes a lot of force to make it change its pattern of movement (relative to air).
So what warms the ocean? Mostly sunlight. Sunlight is partially reflected and partially transmitted at the surface, and the transmitted fraction is almost all eventually turned into internal energy misnamed “heat”. A warm breeze over a cold ocean might warm the surface a tiny, tiny bit. Extra LWIR from the warm breeze might warm the cold ocean a tiny, tiny bit. But only sunlight is going to warm the ocean to any depth.
What, then, cools the ocean, how does it lose the heat added by sunlight? This is the big question, the one that I think Bob has been focusing on with almost all of his posts. The only means of energy transport from the surface of the sea to infinity (outer space at 3 K) are the usual ones — conduction (to sea bottom, to shore, to the atmosphere — to the physical boundaries of the ocean bulk volume), convection (technically heat transport rather than loss, but conduction plus convection allows a continuous exchange of heat at a boundary via conduction that is then moved away, and of course in the bulk ocean general thermohaline circulation redistributes internal energy/heat so that it forms a major component of the path followed from entry as (probably) sunlight and eventual exit to space, radiation — almost entirely LWIR if one follows custom and subtracts out the initially reflected fraction of SW via “albedo” as a non-blackbody, non-thermal process, and latent heat. Latent heat is a huge one — the ocean surface is nearly always evaporating water (cooling it relative to the air above) or receiving downfalling rainwater (or snow, or sleet) that is water that gave up its latent heat very high up in the atmosphere and is now returning, cooled.
If you look at TOA spectrographs looking down taken over (mostly) ocean water, you still see outgoing LWIR in bands associated with surface temperatures. That is, some of the radiation emitted by the ocean’s surface makes it straight out through comparatively transparent bands in the atmosphere. The air over seawater, however, is usually very humid, and water vapor is a greenhouse gas, so quite a lot of the outgoing LWIR is blocked by water, transferred to the atmosphere, and plays the usual role of moving the temperature of air and water closer together against whatever imbalance they might have. If the ocean is warmer, it warms the air. If the air is warmer, it warms the ocean, in this channel which is not the only channel active and hence may not actually warm or cool as in actually change the temperature in the indicated direction at all. Evaporation cools the water in a pot sitting on the stove, but that doesn’t stop the water from heating when the stove is turned on, it only means that it takes longer to bring it to boil than it might if you put on a lid. In any event, one sees LWIR emission in these bands from much higher, much cooler levels of the atmosphere where it becomes roughly transparent to the emitted radiation, and at these lower temperatures the rate of energy loss is much reduced compared to the rate of energy loss that would have occurred as LWIR directly from the surface at surface temperatures.
That means that independent of the details of energy transport underneath the particular patch of surface you are taking the spectrograph from, there is a greenhouse effect. One that if anything is enhanced by the presence of water vapor per se, although as has been observed and commented on repeatedly, water vapor that cools turns eventually into clouds, and clouds are enormously nonlinear factors in overall heating and cooling as they albedo modulate both incoming and outgoing shortwave (visible light) radiation and longwave radiation, and are large LWIR emitters up high and down low, and eventually they generate snow/rain that falls and cools the entire air column to the ocean or ground surface along the way, acting as “delayed” reservoirs of bulk cooling in between that are often moved long distances laterally (so we get rain in the middle of continents that is the result of latent heat loss from the middle of the ocean).
To summarize, the greenhouse effect at the surface of the ocean exists independent of attribution of warming to “downwelling LWIR. It is implicit in observed TOA spectrographs. It doesn’t “heat the ocean”, any more than the lid I put on a pot on the stove heats the pot, but it can easily alter a dynamical equilibrium temperature of the water heated some other way. Anything that slows net energy transport in a spectral band to eventual loss to space will raise the dynamical equilibrium temperature of a sun heated, open planetary system.
Appearance of the ‘blob’ would indicate reduction in the rate of the deep currents cold waters up-welling. One of possible (speculative) reasons is described in this comment.
Natural changes are not accidental; there is a reason to everything.
I’m not sure how long the Blob will persist, but Obama is headed there for photo ops in Alaska before it subsides and before the ice season starts.
http://www.wsj.com/articles/obama-to-visit-arctic-later-this-month-1439478165?mod=rss_US_News
I want to place Bob’s anomaly chart in the reference frame of actual Sea Surface Temp.
Bob’s Blob is 2 deg. above normal (not very large). The SST’s for the region range from 14 to 22 C (still pretty cold).
http://www.ospo.noaa.gov/data/sst/contour/uspacifi.fc.gif
Now compare the wind circulation patterns with the modeled ocean current speeds.
https://www.windyty.com/?38.100,-103.228,4
http://www.opc.ncep.noaa.gov/Loops/GRTOFS/currents/GRtofs_Curr_Wcst_03_Day_flash.shtml
A question for Bob T. Are the wind and current patterns and speeds also anomalous?
The wind patterns seem pretty organized yet the resulting ocean currents seem very chaotic.
(Always look forward to Bob’s updates.)