Guest Post by Bob Tisdale
NOAA recently published their State of the Climate Report for May 2015. Under the heading of Global Summary Information, they note:
Note: With this report and data release, the National Centers for Environmental Information is transitioning to improved versions of its global land (GHCN-M version 3.3.0) and ocean (ERSST version 4.0.0) datasets. Please note that anomalies and ranks reflect the historical record according to these updated versions. Historical months and years may differ from what was reported in previous reports. For more, please visit the associated FAQ and supplemental information.
But of course we know the adjustments that led to the new NOAA ERSST.v4 sea surface temperature data (the biggest changes to the NOAA data took place in the ocean portion) are not supported during the global warming slowdown period by the night marine air temperature dataset (HadNMAT2 from the UKMO) that NOAA used for bias corrections. (See post here.) In other words, it appears NOAA overcooked their “improvements”. Oops!
On the NOAA Global Analysis – May 2015 webpage they state under the heading of Temperatures:
The combined average temperature over global land and ocean surfaces for May 2015 was the highest for May in the 136-year period of record, at 0.87°C (1.57°F) above the 20th century average of 14.8°C (58.6°F), surpassing the previous record set just one year ago by 0.08°C (0.14°F). This ties with February 1998 as the fourth highest monthly departure from average for any month on record. The two highest monthly departures from average occurred earlier this year in February and March, both at 0.89°C (1.60°F) above the 20th century average for their respective months.
Somehow I don’t think that will surprise anyone.
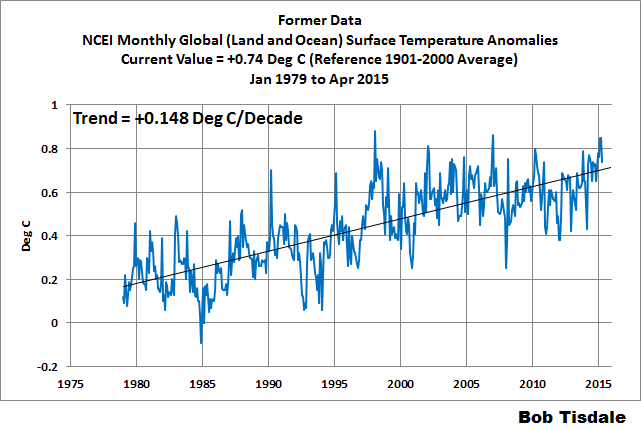
Figure 1 is a graph of the new NOAA Pause-Busting global surface temperature data from January 1979 to May 2015.

Figure 1
HOW DOES THE PAUSE-BUSTER DATA COMPARE TO THEIR EARLIER DATA FROM NOAA?
Animation 1 compares the new and old NOAA global land+ocean surface temperature data from January 1979 to April 2015, the last month of the old data. The data tweaking had little impact on the multidecadal warming rate.
Animation 1
Animation 2 covers the period of January 2001 to April 2015. It shows that NOAA’s tweaking had a noticeable impact during the 21st Century, almost doubling the warming rate. Again, NOAA can’t justify those higher trends with the night marine air temperature data they used as a reference for the bias adjustments in their sea surface temperature data.
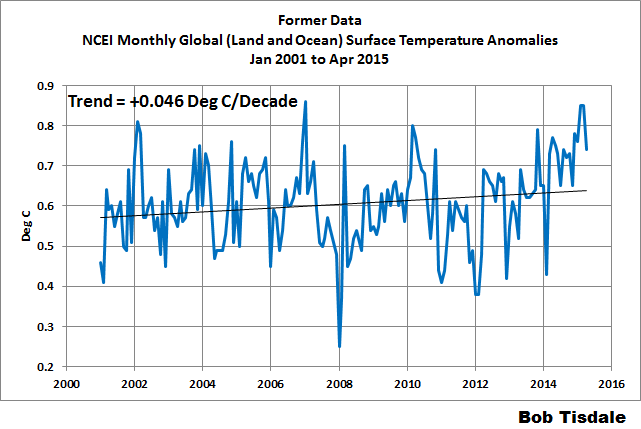
Animation 2
HOW DOES THE PAUSE-BUSTER DATA COMPARE TO THE OTHER GLOBAL DATASETS?
Figure 2 compares the new pause-buster data from NOAA to the global surface temperature products from GISS and UKMO and to the lower troposphere temperature data from RSS and UAH. I’ve used the new Release 6.0 data from UAH in the comparison. The anomalies of all datasets have been referenced to the WMO-preferred base years of 1981-2010.

Figure 2
There are of course differences in how each of the data suppliers handle the polar oceans. As soon as the new NOAA data are available at the KNMI Climate Explorer, I’ll present the comparison using the latitudes of 60S-60N. The new NOAA data should stand out like a sore thumb.
CLOSING
I’ll be using the new NOAA pause-buster data in the future monthly updates, starting next month. In each update from this day forward, I’ll remind everyone that the adjustments that led to the new NOAA sea surface temperature data, where the biggest changes took place, are not supported during the global warming slowdown period by the night marine air temperature dataset (HadNMAT2 from the UKMO) that NOAA used for bias corrections. And as I noted earlier, in other words, it appears NOAA overcooked their “improvements”. Hopefully, others will remind NOAA of that as well.
The skeptics own this one.
Let me explain.
Last year, NOOA claimed the “HOTTEST year ever!”
Everybody went on about 0.03 degrees or 0.08 degrees, and its a 38% probability or a 31% probability, with error bars. And that became the story, except it did not. Popular opinion was that that it was what we call “inside baseball” all the way. The press reports was that “hotter is hotter” and that is what was reported. Nobody wanted to hear about some people talking about a 38% Probability.
They were never called out on adjusting the data.
They were never called out on fixing the data.
They were never called out on tampering the data.
They were allowed to get away with it last time, and they are doing it again. It is way too late to say that the data was tampered from 2013 to 2014 to 2015. They have been progressively tampering the data since the 1980’s.
It is way past time to call a halt to the surface record, and call it what it is.
Thanks Bob
So….NOAA is saying we won’t know what the temperature is right now….for at least another decade
Latitude, excellent point… and exactly what I said next week in my lecture on time travel.
OK, that made me laugh out loud. Today has been a long week.
That’s right; look at it from their point of view, if it gets cooler or remains the same in the next few years all previous temperatures will have been found to be over-estimated and will need to be adjusted down to reflect what every simpleton knows. The world is getting warmer.
Historical months and years may differ from what was reported in previous reports.
NSS. You don’t say. Well, at least they admit they are modifying the data.
Get your data, get your new data here! Now with added warming!
NOAA has now rationalized their re-write of history, all nice and open and legal….and utterly ignoring reality at the cost of their integrity.
What I find interesting is that the National Climate Data Center (NCDC) changed its name to the National Centers for Environmental Information (NCEI). Notice that they got rid of the word “Climate” from their name. It seems that climate in now a bad word, esp. for Republican Congressmen working on the budget. In the proposed FY2016 markup coming out of Congress, *climate* research funding has been cut in favor of increased funding for *weather* research. You don’t have to be a weatherman to know which way the wind blows.
Mumbles McGuirck on June 19,
2015 at 5:21 am
What I find interesting is that the National Climate Data Center (NCDC) changed its name to the National Centers
for Environmental Information
(NCEI).
_____
interesting, yes – downscaled from NCDC to NCEI:
from providing the nation with Climate Data
to, first glance, an mere in/outlet of the EPA.
Thanks – Hans
At what point does this kind of data adjusting/fudging/tampering rise to the level of scientific misconduct? Can any reasonable person conclude that there was no bias, no predetermined result? Climate science: measure it with a micrometer, mark it with a piece of chalk and split it with an axe… then, “Oh, look!”
Or, more accurately, mark it with chalk, split it with an axe and THEN measure with a micrometer. As for the pause-that-wasn’t, it was always worse than we thought… We just didn’t know it till now.
And don’t forget to ” beat to fit , paint to match”….(8>))
BTF PTM – for those in the know. Avoids scaring the uninitiated.
Taken together with the Popes Encyclical itys official – CAGW is a religion. It is entirely self evident becasue iot is self referenced. There is man made global warming therefore all man made data must reflect that it is entirely logical to the Mobius Mind.
BTW 400 years since Galileo was hounded and imprisoned. You might think they would use their God given intelligence to read and understand history’s memo.
I have been highly skeptical for the past 10 or 20 years, I don’t know recall when I actually started paying much attention but I think I am a fully fledged denier now. Actually I will pull back a bit, 100% is a bit much. I am 97% confident that CAGW is 97% a crock.
You can just look also at Hadsst3 temps for may : warmest on record by far.
NASA are the Pope’s accompanists or vice versa. Ellen Stofan is quoted in both pieces below, which i find amusing, even if her second appearance involves an April quote:
16 June: UK Daily Mail: Richard Gray: Our scorched Earth in 2100: Nasa maps reveal how climate change will cause temperatures to soar
Nasa has released 11 terabytes of data predicting temperature and rainfall
A map released by Nasa shows large areas in July 2100 will exceed 45°C
Scroll down for an interactive map
***Ellen Stofan, chief scientist at Nasa, said: ‘Nasa is in the business of taking what we’ve learned about our planet from space and creating new products that help us all safeguard our future.
‘With this new global dataset, people around the world have a valuable new tool to use in planning how to cope with a warming planet…
EVEREST’S GLACIERS TO VANISH …
For those with the computing power and hard drive space, the data can be downloaded here (LINK)
http://www.dailymail.co.uk/sciencetech/article-3125113/Earth-2100-Nasa-maps-reveal-world-need-adapt-rising-temperatures-caused-climate-change.html
don’t believe for a second that the following is not being ramped up of late, especially by NASA, as part of the CAGW scare-them-out-of-their-wits tactics. yesterday, it was just Grunsfeld and Stofan in a HuffPo piece by Nitya Rajan – “Former NASA Astronaut Say ‘Aliens Probably Know We Exist’” – today it’s an even bigger NASA cast! MSM are such CAGW tools:
19 June: UK Daily Mail: Mark Prigg: There IS alien life out there: Nasa administrator says he believes we are not alone in the universe
Charles Frank Bolden Jr., the Administrator of Nasa confirmed he believes there is life outside of Earth.
Facing readers from First News for the newspaper’s Hotseat show on Sky News, he was asked if he believed in aliens by 10-year-old Carmen Dearing.
‘I do believe that we will someday find other forms of life or a form of life, if not in our solar system then in some of the other solar systems – the billions of solar systems in the universe, he said…
It comes just days after former astronaut, John Grunsfeld, said that aliens may spot humans from afar from the changes we’ve made to Earth’s environment.
‘We put atmospheric signatures that guarantee someone with a large telescope 20 light years away could detect us,’ said Grunsfeld at the Astrobiology Science Conference in Chicago.
‘If there is life out there, intelligent life, they’ll know we’re here…
Grunsfeld who is now associate administrator for Nasa’s Science Mission Directorate, added: ‘Are we alone?’ is the biggest driving question.’
***In April, Nasa’s chief scientist Ellen Stofan we could find evidence of extraterrestrial life in 20 to 30 years.
‘We know where to look, we know how to look, and in most cases we have the technology.’
Jeffery Newmark, interim director of heliophysics at the agency, added: ‘It’s definitely not an if, it’s a when.’…
http://www.dailymail.co.uk/sciencetech/article-3130345/There-alien-life-Nasa-administrator-says-believes-not-universe.html
most people would know the alien life being talked about is microbial, but there are plenty who are seeing little green men in all this talk.
as Ronald Reagan said in a 1987 speech at the United Nations, in part:
“In our obsession with antagonisms of the moment, we often forget how much unites all the members of humanity. Perhaps we need some outside, universal threat to make us recognize this common bond. I occasionally think how quickly our differences worldwide would vanish if we were facing an alien threat from outside this world.”
A map released by Nasa shows large areas in July 2100 will exceed 45°C.
____
Guess – NASA plans model scaled Venus explorer simulation grounds with ever expandable heating adaption.
Halfreality scalable CAGW scenarios – for education and family sightseeing.
Great of NASA. Hans
John Grunsfeld,
said that aliens may spot humans from afar from the changes we’ve made to Earth’s environment.
‘We put atmospheric signatures that guarantee someone with a large telescope 20 light years away could detect us,’
____
can’ believe a NASA astronaut argumenting that stupid – neither the 20 lys nor the environmemtal signs:
since 100 ys we do radio communications.
Wer’e detecteble up a 100 lightyears radius Sphere.
No environmental signatures needed – contrary: never ever again can we shelter under a whatsoever ‘natural’ enviroment.
Hans
our sole / technical / existence expands year after year: lightyear to lightyear.
to whomever that concerns.
And no coming ‘icons forbidders’ able to erade our remnants.
____
That blog ever gets, say, remarkable. Hans
Even with the most recent raising of global ocean surface temperatures in the period of 1998-2014 by NOAA in a failed attempt to hide the global climate hiatus , there is little global land warming happening since 2005. Global and Northern Hemisphere, land area temperature anomalies during the last 10 years show a flat or slightly negative or cooling trend of -0.02 C /decade and -0.05/ C/decade respectively according to NOAA own Climate at A Glance data. In North America, Contiguous US annual temperature anomalies show a negative or cooling trend since 2005 at 0.69 F/decade. A similar pattern appears to be in Canada where 7 out of 11 climate regions show declining annual temperature departures since 1998; one is flat and 3 show warming from the. In other words 70 % of North American climate regions are not experiencing global warming but cooling. So how could global warming be generating all these extreme weather events on land when there is no global warming happening on land globally.
The whole IPCC charade is based on:
CO2 forcing increasing the GHE
Supposedly this will cause more moisture and amplify the effect of water vapor leading to a warmer atmosphere
Yet, they cannot find any warming in the atmosphere
The only thing that can heat the ocean is sunlight due to the physical properties of water.
Ergo, NOAA pointing to increased SST just proves it is the sun, not CO2 and there is no AGW.
Bob
Did you notice that they have eliminated the ONI version of the 2014/2015 El Nino with their ERSSTv4 and modified all the ONI data going back to 1950. This is the fourth time they have made changes to the El Nino status or projections . . Early 2014 they said there would be a strong El Nino in 2014. For the 2014 YEAR Report they claimed there was no El Nino effect on their 2014 temperatures and no EL Nino existed in 2014 , but there was an El Nino during the latter part of the year and there was a major effect on 2014 temperatures . Then early in 2015 they declared an El Nino from Oct /2014 to April 2015. .Now with ERSSTv4 , they again eliminate the El Nino. One gets the impression that they just play with the figures to suit the political needs of the day and no one calls them to task for the bad science they project to the public.
Wow. Thanks, Herkimer. I hadn’t come across that yet. How funny. Now you see it, now you don’t.
Has anyone independently – and by that I mean someone not of the alarmist cult – audited what NOAA does to its temperature statistics?
Very simply, is the methodology they use to manipulate/torture data scientifically and statistically logical, and perhaps most important of all, is it replicable?
The UK Global Warming Policy Foundation recently began such a study. http://www.tempdatareview.org/
A well known fact:
If you torture numbers long enough, they’ll tell you anything you want them to.
“overcooked” ?
That’s like saying a bank robber committed an overdraft.
Regarding Bob’s Figure 2 above, In May of 2009 all the trends for GISS, HADCRUT3, GISS, NOAA all fell on top of one another. UAH with just a little less of a trend was the odd one at the time. I have the old file if anyone wants it.
It has been the past climate record that generally ocean surface temperatures drive or lead the land temperatures . But , starting with 2005-2015 period where ocean temperatures were adjusted up by a factor of 2, via the latest fudging of Ocean temperatures via ERSST.v4 , the ocean SST’s are rising but global land temperatures are slightly dropping or flat . NOAA may fool the public with all their number gyrations , but you cant fool Mother Nature. As this decades evolves further, it does not matter what the temperatures are altered to , people are going to feel the colder weather and clearly know that global warming is not happening . All the signs point to a cold winter again like the last one and this translates to a colder year , particularly the first 6 months . The YEAR TO DATE FIGURE (JAN-MAY) for CONTIGUOUS US is dropping at -0.73F/ decade since 1998
This kind of nonsense is only going to get worse and more frequent as the Paris Climate Conference in December fast approaches … such is the determination by these alarmists to do anything to ensure an agreement is signed in Paris restricting fossil fuel energy use and with the aim of eliminating it altogether by the rune of the century.
For the sceptics to combat this government funded propaganda, it is a David versus Goliath battle. And I just pray David wins again.
NOAA claims, that:-
(A) The annual global surface temperature of 1997 is 62.45°F (16.92°C).
http://www.ncdc.noaa.gov/sotc/global/1997/13
(B) The annual global surface temperature of 2014 is 0.74°C above the 20th century average global surface temperature.
http://www.ncdc.noaa.gov/sotc/global/2015/5/supplemental/page-3
(C) The 20th century average global surface temperature is 13.9°C.
http://www.ncdc.noaa.gov/sotc/global/2014/13
By any normal reckoning, the annual global surface temperature which NOAA reports for 1997 is at least 2.28°C higher than the annual global surface temperature which NOAA reports for 2014. The trouble is, it is impossible to verify any of claims (A), (B), and (C), should any of them happen to be true, and it is impossible to falsify any of claims (A), (B), and (C), should any of them happen to be false. How many angels are dancing on top of the Empire State Building at this very moment? As many as you like, because however many angels you claim are dancing on top of the Empire State Building at this very moment, nobody can actually prove your claim is false.
The sublime beauty of Karl et al. is that it puts obvious lie to the worn canard that “the science is settled.”
Well of course the science is settled. It is the data that is unsettled.
I think the satellite data which is much more objective and supported by the state of the art temperature system put into the U.S.A in 2008, along with radiosonde data and independent weather companies such as Wx. Bell Inc. is the data one has to go with.
I say this because the government has an agenda to keep AGW theory alive and of course in order to promote that agenda they are in turn going to have to have the data support AGW as much as is possible and that is what seems to be happening with all of their adjustments. I might also add THE adjustments always magnify the rate of warming as we proceed forward and never in reverse.
In addition ,it does not make sense that all adjustments they make to the data always lend support to the idea that AGW is real and still going on when all of the other data shows no such occurrence is taking place.
Bottom line is that if there really was any warming to speak of, the satellites would pick it up and be used since it covers the earth more completely than land based measurements and is less prone to errors or requiring adjustments based on a hundred different things.
That is actually the complete opposite of reality.
http://www.remss.com/measurements/upper-air-temperature
Bob, thanks for your usual thorough analysis and documentation.
I was surprised to see in your graph comparing global surface temperature products that UAH v6 appears to show 2010 eclipsing 1998 as the warmest year on record. When I look at the numbers I see 1998 anomaly is 0.48C and 2010 is 0.35C. Even at the level of the first several months of the year, 2010 doesn’t show higher anomalies except for a slightly higher March.
As far as I can see, 1998 is still the peak in the UAH global record. Of course, if you use US48 or US49 1998 is surpassed.
NOAA/NCEI: “Historical months and years may differ from what was reported in previous reports”
This methodological statement should be NCEI’s proud motto.
And since CO2CAGW aka “[CO2-]Climate Change” has been so recently elevated by the Pope to full Religious status, it would seem appropriate at this time to ask, “Can I get me a witness…..Can I get a witness?” / Marvin Gaye
There is no question in my mind that with Paris coming up 2015 will be the ‘warmest year on record’ no matter what the real situation is and there are plenty of people willing to do ‘what ever it takes’ to make it so.
It is just a shame I cannot find any bookies who would take this bet , has even they know it is a ‘done deal’
The only real question is by how much will it be the ‘ ‘warmest year on record’ are they going to get greedy and come up with a big number or come up with a number that may give them headlines but in reality is meaningless given the error margins involved?
Pick a card and place your bets folks.
From your animation it looks like they stuck the thumbtack into the record at 1995 and rotated counterclockwise, cooling the past a bit more and warming the present. Keep your eye on 1995 and watch the peaks move above and below that.
Didn’t we just have the wettest May on record in the U.S.? Rain comes from clouds. Cloudy days are cooler than sunny days. How can anybody in their right mind think that May was record hot? At least regarding the United States. These announcements of record heat remind me of all the propaganda that the economy is roaring back. Same lie.
Bob:
Haven’t you ever noticed that clouds also make nights warmer?
Ave temps are …. well …. the min + max dived by two.
You can have warm ave temps from the min side of the equation.
I am quite worried about the coming winter already, I have been keeping a fire to stay warm at night for say 7 nights in May and now 2 nights thus far in June. 100 miles north of NYC. Another oddity is we had a very late end to winter and spring was dry in April, not particularly warm for April either, now, I am reading of reports of snow and ice all over NH, Greenland stuck in ice, Norway snow covered, SH winter raging in FALL down under…. Hottest MAY evah ! Really? Where? Where is all the heat? Both hemispheres have winter conditions happening! Yes the general public IS rejecting CAGW alarmism faster and faster as the Earth refuses to obey models. Another clue to coming winter is the Mountain Laurel bloom, which has traditionally blossom peaked by the 22nd of June (like clockwork on our mountain) this year it has already peaked and was in full bloom by the 9th of June. I do not know if this means anything but I must say it is most notable for the locals here who observe these things.
It appears the monsoonal flows are also starting early this year. Its going to be an interestingly short summer for most of the US. The wet flows are even engaging over Europe. All things are pointing to a very snowy and clod winter for us in the Northern Hemisphere.