Guest essay by Mike Jonas
In January 2012, my article “Peak Oil – the R/P Ratio re-visited” was posted on WUWT. 3 years on, maybe this ever-controversial subject is worth (re-)re-visiting.
In 2012, I said that it was getting ever more difficult to increase production, and that I suspected that we were already at or close to Peak Oil, but that it was still mathematically possible that Peak Oil was many years away. Do I still think that? In a way, yes, but … well, read on …
In this article, I look at the major factors affecting oil supply, look at past oil market behaviour and how the future may develop, see what lessons can be learned from Hubbert’s Peak, and speculate on when Peak Oil will occur and what it may feel like.
Some of the controversy generated by the 2012 article came from different interpretations of “Peak Oil”, so this time, I will start with the definition and a bit more background.
Definition of “Peak Oil”
The definition I am using is simply :When the rate of oil production reaches its maximum.
Please note:
· In this definition:
Peak Oil is not : “when we run out of oil“.
This is not a useful definition, because we’re not going to wake up one morning and find that yesterday’s oil has all gone.
Peak Oil is not : “when we can’t increase the rate of oil production“.
This isn’t very useful either, because “can’t” is always open to argument.
· The period over which the maximum is determined is not specified, so this still isn’t a precise definition. Certainly, any period less than a year is irrelevant. We very likely won’t know when it was until several years afterwards.
· The reason for oil production reaching its maximum is not specified, and possible reasons will be discussed below.
· I am not talking about fossil fuels generally, and I am not talking about oil and gas. I am talking specifically about oil. That does include gas liquids and “unconventional” oil, but not biofuel. (“Unconventional” oil is described later.) s` qA
· Peak Oil is not necessarily a disaster, it could even be a positive. This also will be discussed below.
One idea which surely is not open to argument is the fact that oil production will peak. Here is a long term graph of past and predicted future fossil fuel production – peak production rate is defined as 1, and the red star represents where we are now (or were recently):

Figure 1. World Total Fossil Fuel Consumption, past and predicted – the long view. [1]
Even if those future estimates are very inaccurate, it is inconceivable that fossil fuel production can keep increasing for thousands of years. The graph for oil must fit inside the graph for fossil fuel.
But predicting Peak Oil has always been an unrewarding exercise. As critics love to point out, various people have predicted Peak Oil for over a century and have been wrong every time.
Factors affecting oil supply
The principal factors affecting oil supply are:
- Geology
- Politics
- Demand
- Price “The solution to high prices is… high prices.” – T. Boone Pickens (h/t John Garrett)
- Technology
Geology is obviously a factor – geology dictates much of where the oilfields are, how much oil is present, its quality, and how difficult it is to extract.
The other factors are all interdependent, so it is arguable how much impact each factor has.
· Many if not most oilfields now belong to nation states, not to oil companies. Consequently many of the decisions affecting oil supply are political. There are also involuntary political impacts such as wars.
· Demand has grown fairly steadily for many decades, due to living standards increasing in developed nations and many other countries accelerating their economic development.
· To the extent that supply is flexible, production tends to be driven by demand.
· Price is the major balancing factor. High oil prices increase the attractiveness of bringing new sources into production, but can also suppress demand. Low oil prices increase the attractiveness of using more, ie, they tend to increase demand, while discouraging high-cost sources of supply.
· Technology is a two-edged sword. Oil production technology has seen tremendous advances since the start of the oil era, allowing ever more oil to be found and produced, thus boosting supply. But technology also helps to make oil use more efficient and other energy sources more competitive, thus reducing demand.
Should I have listed Discovery as a major factor? Maybe I should, but I chose to regard it as a subset of Geology, perhaps with Politics, Demand, Price and Technology as modifying factors.
Hubbert’s Peak
Most people are by now familiar with Hubbert’s Peak. M King Hubbert’s theory [5] says that for any given geographical area, from an individual oil-producing region to the planet as a whole, the rate of petroleum production tends to follow a bell-shaped curve. In 1956, Hubbert famously predicted that US oil production would peak in about 1970. His prediction was remarkably accurate over the next 50 years.

Figure 2. Hubbert 1956 prediction vs US Oil Production . [5]
Predictions that are that accurate over 50 years are quite rare.
For the global bell curve, the upward slope tends to be limited by demand, ie. as much as can be sold at a reasonable price. The downward slope, for regions and fields that have reached it, tends to be limited by geology, ie. the maximum production rate consistent with maintaining reservoir viability. [NB. I’m only referring to general tendency. There are many exceptions of course.]
The overall bell curve is the sum of its components, each of which is a bell curve. Thus a region’s bell curve is the sum of its fields’ bell curves, and each field’s bell curve is the sum of its individual wells’ bell curves. This pattern is demonstrated in, for example:

Figure 3. Historical extraction of crude oil by discovery/field for the Norwegian Continental Shelf (NCS), 1970-2013, plus forecast. [6]
Note that the “bell curves” for the individual fields have a wide variety of shapes. Note also that once a peak has been passed, even a very large field like Johann Sverdrup (Norway’s 4th-largest discovery at 2.9bn barrels) may only produce a brief delay in the decline.
Unconventional Oil
One notable exception is the USA, where very large quantities of “unconventional” oil have recently become viable thanks mainly to technological advances and high oil prices: This surge in “unconventional” oil production can be seen from around 2007 in Figure 4:

Figure 4. USA oil production 1965 to date. [2]
What is “unconventional” oil? A-simple definition is “oil collected by other means than simply drilling for it” [7]. Willis Eschenbach put it differently:
The strange part is, when you open a barrel of unconventional oil to see what conventions were broken in its creation, you find it is indistinguishable from conventional oil. [8]
Both are right, in a sense, but I’ll stick loosely with the “unconventional” idea simply because it’s a useful word for the oil which even under current technology is much more difficult and expensive to produce than the oil we’re used to that satisfied all demand until recently. The definition is loose, but some pictures [9] might help:

Figure 5a. An oil rig blowout in Turkmenistan. The easiest “conventional” oil to produce (with care!) is under pressure.

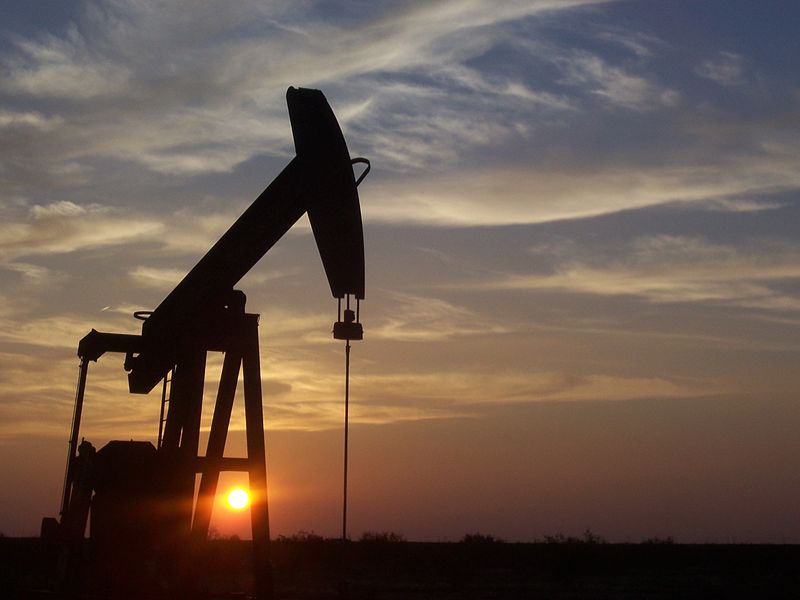
Figure 5b. West Texas pumpjack. Some “conventional” oil has low pressure and has to be pumped out.

Figure 5c. “Unconventional” oil such as the Alberta Tar Sands are currently being mined.
“Unconventional” oil also includes shale oil, which can be drilled for rather than mined, but tends to be in very tight rock formations that are difficult and expensive to produce from, and tends to require techniques such as horizontal drilling and fracking [11].
Past Oil Production
Before I show the graph of past oil production, it will be helpful to show the graph of oil price. It’s from data in BP’s June 2014 report [2], so doesn’t show the recent fall back towards $40.

Figure 6. Oil Price from 1965. [2]
Looking at the first half of the graph –
· The first major disruption in this period occurred in 1973, when OPEC quadrupled the price of oil.
· The second was the Iranian revolution in 1979 and the Iran-Iraq war starting in 1980.
· These disruptions helped to bring on a massive recession in 1981-2, the most significant recession since the Great Depression.
· Reduced demand because of the recession resulted in the oil price fairly quickly returning to “normal”.
In the second half of the graph:-
· For a decade or so after the start of the 21st century, supply struggled to keep up with demand and the oil price went up …
· … apart from a short sharp dip at the time of the GFC.
· Not shown is the recent sharp price decline, caused by surging US “unconventional” oil production and exacerbated by Saudi Arabia’s decision to maintain high production.
But in spite of the economic booms and busts, it is clear that although the oil price has been volatile at times, oil demand and/or supply have been relatively inelastic:

Figure 7 – Oil Production.[2]
Oil Reserves
Oil reserves are very much a function of technology and price. A generally-accepted definition [3] of Reserves, also called Proved Reserves or Proven Reserves, is:
the estimated quantities of oil which geological and engineering data demonstrate with reasonable certainty to be recoverable in future years from known reservoirs under current economic and operating conditions
In my 2012 article, I paid too much attention to proved reserves. That was partly because I was responding to a Willis Eschenbach article about the R/P Ratio (Reserves / Production), but mainly because in my mind I overestimated the importance of Proved Reseserves. What really matters is the Technical Reserve (“TR”, the total amount of oil that might be able to be produced at some future time), rather than the more narrowly defined “Proved Reserves”.
So – how much oil is there? That number is surprisingly difficult to find (well for me it is, anyway). The USA is it seems the only country that tries to estimate it. The U.S. Geological Survey (USGS) puts it at 732 Bbbl excluding the USA (565 conventional, 167 gas liquids) [12], plus 42 Bbbl in the USA (32 conventional, 10 gas liquids) [13]. But unfortunately USGS says “Unconventional oil and gas resources, such as shale gas, tight oil, tight gas, coalbed gas, heavy oil, oil sands, may be significant around the world, but are not included in these numbers.“.
Total USA shale oil is put at 2,175 Bbbl plus “significant volumes of heavy oil in the oil sands of northeast Utah” [14]. Outside the USA, total unconventional oil is put at 335 to 345 Bbbl, but with much information missing [15]. [Note: The source here is Wikipedia, but (a) the data isn’t particularly controversial so Wiki should be OK, and (b) accuracy isn’t very important, only the general level.]
Total oil production to date is about 1,440 Bbbl [16].
A possible estimate of global initial TR is therefore about 5,000 Bbbl:
| Bbbl | |
| Past production | 1,440 |
| USA conventional | 32 |
| USA gas liquids | 10 |
| USA shale etc | 2,175 |
| Non-USA conventional | 565 |
| Non-USA gas liquids | 167 |
| Non-USA shale etc | 345 |
| Total | 4,794 |
Peak Oil date
Looking back at Hubbert’s Peak in Figure 2, it is striking just how accurate Hubbert was for 50 years, and equally striking that after 50 years of impressive accuracy, it went badly wrong (see the production surge from 2007 in Figure 4). So – what happened, and are there good lessons to be learned?
If you read Hubbert’s paper [5], you will note that he bases his estimates on very few numbers. The most important number was the total amount of oil. For the graph in Figure 2, total oil in the USA was put at 200 billion barrels (“Bbbl”). Hubbert didn’t actually know what the correct number was, so he estimated for 150 Bbbl and for 200 Bbbl. The graph for 200 Bbbl proved remarkably accurate.
Where Hubbert went wrong (50 years later) was that he did not make proper allowance for the “unconventional” oil, even though he knew of its existence. The combination of technological advance and high oil prices resulted in a massive surge in USA production of “unconventional” oil from around 2007. There was therefore a major departure from Hubbert’s predictions for the USA (Figure 4).
Put simply, all we have to do in order to correct Hubbert’s predictions for the surge in “unconventional” oil is to update the figure for total oil TR. The other principal figures Hubbert used were current production rate and rate of demand growth, and of course new values for those should be used too.
Hubbert put initial global TR (today’s TR plus all past production) at 1,250 Bbbl, and predicted global Peak Oil in 2010, based on the theory that Peak Oil occurs when about half of the TR has been produced. 2013 production rate was around 32 Bbbl per year, so using Hubbert’s theory and our new figure for TR, we can do a rough calculation on an “all other things being equal” basis, of when Peak Oil will occur (see spreadsheet [16]):
If global initial TR was 5,000 Bbbl and future production growth rate is 3% pa, then Peak Oil occurs around 2036. At lower growth rates (2%, 1%) the date is only slightly later (2038, 2041). The truly fascinating aspect of these figures is that a quadrupling of initial TR from 1,250 to 5,000 Bbbl only adds about 30 years to the likely Peak Oil date.
Over the last few decades, oil production has grown at around 1.3% pa [2] on average. In spite of the recent surge in USA “unconventional” oil production, global oil production has slowed a bit in recent years to about 1.1% pa. With USA shale/tight oil production expected to decline from 2020 [17], it may be difficult to maintain a positive global production growth rate from then on. Peak Oil is when the global growth rate hits zero.
Variations
The above calculation putting Peak Oil at around 2036 is simplistic, of course. It implicitly contains some big assumptions about future demand, technological advances, massive mining operations from Alabama to Utah, and a few others no doubt. It is probably reasonable to view it as giving an upper limit.
But maybe we can get more realistic if we look at some of the major factors again:
· Politics : Already, fossil fuels are under savage attack from the Greens worldwide. Hopefully, sanity will prevail, but there is clearly some risk of a politically-enforced early Peak Oil date (and peak everything else). That could be very painful indeed, a disaster on a scale that is hard to imagine. On hopefully a lesser scale, political instability in oil-producing countries is a potential threat to oil supply.
· Demand : From 2000 to 2013, production has gone up from 74,983 to 86,808 bpd [2], an average increase of little over 1% pa. There are increasingly plentiful and cheap supplies of natural gas, which may well eat into the demand for oil. Greater efficiencies, possibly driven by the oil price, may also help to limit demand. However, a period of global cooling, as some think likely, may increase oil demand for heating. Also, a period of renewed global prosperity would surely push up the demand for oil.
· Note: The relationship between demand and Peak Oil date is interesting. In the simple calcs [16] a higher production growth rate gave an earlier Peak Oil date. But under higher demand, if the oil price is strong (but not so high that it knocks demand down again), it is likely that more of the TR will get produced and hence Peak Oil date could even be later.
· Price : The full incremental cost of oil production – the cost of a barrel from new sources taking up-front capital costs into account – is now probably above $US70/bbl [17]. This view is reinforced by the oil futures market, where oil for delivery in future years is in Contango, ie. higher than the spot price by more than the storage cost [19]. For global oil production to keep increasing, a greater proportion of production will have to come from “unconventional” sources, and that does look likely to push the cost up further. As the cost of oil rises, so alternatives such as natural gas become more competitive.
· Technology : Will technology be able to keep ahead of demand by both (a) reducing the cost of production of “unconventional” oil, and (b) increasing the rate at which it can be produced? If it cannot, then Peak Oil occurs earlier. Technology may also work to reduce demand for oil by, for example, replacing it with gas or electricity for some uses, and by enabling more efficient use of oil.
With all these conflicting factors, the future for oil looks difficult to pin down.
Conclusions
A Peak Oil date cannot, I think, be predicted with any reasonable certainty. Although it is mathematically possible for Peak Oil to occur after say 2040, it looks unlikely to be as late as that, and may well be much earlier.
Major advances in “unconventional” oil technology are needed to forestall Peak Oil for more than a few years. Technology has always delivered in the past, and it is reasonable to assume that it can continue to deliver in future.
But there is another possibility : The price of oil is still likely to increase. If alternative energy sources such as natural gas (or even nuclear or solar energy) are available in sufficient quantity, and if the technology is developed for them to compete for some uses of oil, then Peak Oil occurs early and everyone benefits.
So Peak Oil doesn’t have to be regarded as a disaster. With any luck it will be a massive non-event that no-one even notices.
Discussion
Prediction is very difficult, especially about the future [18]. So I won’t make any predictions. Instead, I will offer some scenarios (don’t take them too seriously, consider them as using “artistic licence”, a bit like climate model “projections” but hopefully more realistic):
Scenario 1. The marginal cost of oil (driven mainly by “unconventional” oil) stays high, while alternatives such as gas become increasingly available at attractive prices. Heating at first, then transport, start converting to the alternatives. Peak Oil occurs early, but the total amount of energy available just keeps increasing while prices remain fairly stable, so there is net economic benefit.
Scenario 2. US shale oil production increases sharply until 2020, then declines. Together with other new sources of supply, the US shale can more than keep pace with declines in existing fields until 2020, but then it is found that other “unconventional” oil sources simply cannot ramp up production enough to keep pace. Total oil production declines quite sharply. In this scenario, Peak Oil occurs around 2020 and the oil price soars. There is then a painful transition period while other fuels scramble to make up the shortfall.
Scenario 3. Technological advances continue to reduce the marginal cost of “unconventional” oil production and to allow ever-increasing production rates. Technological advances also allow increasingly efficient uses of the oil, fuelling economic advances world-wide. A lot more “unconventional” oil is discovered in various parts of the world, and oil production continues to increase steadily until well past 2040. Oil production peaks around 2050, but gas, coal and nuclear keep the energy supply increasing for many more years after that, while solar technology matures and eventually everything (except possibly air transport??) runs on nuclear and solar.
Scenario 3 should be the most likely, but if our politicians continue to get ever more adept at stuffing things up, then the unpreparedness of scenario 2 may be the best we can hope for.
As always, I will be happy to be proved wrong!
###
Mike Jonas (MA Maths Oxford UK) retired some years ago after nearly 40 years in I.T.. He worked for BP in the 1960s and 70s, including 3 years in Abu Dhabi.
References
[1] OilPrice.com “Declining Fossil Fuel Supplies and the Energy Trap“, Tom Murphy, 31 Oct 2011. http://oilprice.com/Energy/Energy-General/Declining-Fossil-Fuel-Supplies-and-the-Energy-Trap.html
[2] Data is from: BP Statistical Review of World Energy June 2014.
http://www.bp.com/content/dam/bp/pdf/Energy-economics/statistical-review-2014/BP-statistical-review-of-world-energy-2014-full-report.pdf
[3] BP: Oil Reserve Definitions.
[4] US Energy Information Administration (EIA): Petroleum & Other Liquids.
[5] From Wikipedia 3/9/14: Hubbert peak theory. The graph matches the graph in Hubbert’s 1956 paper, Figure 21, for assumed initial reserves of 200 billion barrels.
[6] Norway crude oil production 1970-2013. Data is from the Norwegian Petroleum Directorate (NPD).
[7] heatingoil.com Unconventional Oil Reserves in and Around the US.
[8] wattsupwiththat.com Conventional Wisdom, Unconventional Oil, Willis Eschenbach, February 2, 2013.
[9] Oil rig blowout photo from Azhargd Gdin. Pumpjack photo from Wikimedia. Alberta Tar Sands mining photo from Photobucket.
[10] Paleofuture article We’ve Been Incorrectly Predicting Peak Oil For Over a Century
[11] The Bakken Shale Oil Field, North Dakota. http://bakkenshale.net/
[12] USGS Global Estimate for Undiscovered, Technically Recoverable Conventional Oil and Gas Resources US Department of the Interior Press Release.
[13] USGS U.S. Oil & Gas Reserve Growth Estimates US Department of the Interior Press Release.
[14] Wikipedia Oil Reserves in the United States.
[15] Wikipedia Unconventional Prospective Resources.
[16] Spreadsheet.
[17] Business Insider Australia Breakeven Oil Prices For America’s Shale Basins. Keystone XL Project Draft Supplemental Environmental Impact Statement (Figure 1.4.6-8 Mining Breakeven Oil Price. Note also Figure 1.4.4-8 showing US shale/tight oil production expected to decline after 2020)
[18] Niels Bohr, from The Quotations Page http://www.quotationspage.com/quote/26159.html
[19] Futures Magazine Contango crude markets.
Moderator,
my April 20, 2015 5:39 am Reply to Fernando Leanme April 19, 2015 at 2:04 pm was held up in moderation for some time, and has now disappeared.
I do have a copy.
[Reply: Please re-submit. Cannot find the original; probably a WordPress glitch. Sorry. ~mod.]
Thank you Mod, my referenced post has now re-appeared; I do have regular problems with the Flash player crashing here, and elsewhere, and at times my pc is very sluggish.
Good luck with your estimate.
I tend to figure that for every barrel we draw out of the ground, there will likely be three found and placed into the technical reserves for the foreseeable future. Our technology for finding oil is actually increasing faster than our technology for extracting oil. As our ability to peek into crust of the earth improves, the amount of oil recoverable will grow in leaps and bound and Peak Oil will likely be put off for over a century from date.
So mark me down for 2170 as the date for peak oil.
There’s no reason why the supply side should dictate peak oil, and that is the only side you are looking at.
Demand for oil is hardly increasing at all, even with the current low oil prices, yet world GDP is still rising. The time is close where land transportation will start to electrify. See my post above for comprehensive details.
http://www.theguardian.com/local-government-network/2013/nov/20/lessons-electric-bikes-china
If you don’t believe it, look at what has already happened in China – electric bike use has gone from zero to 150 million in ten years. Would anyone have predicted this ten years ago?
History shows that disruptive change like this usually takes longer to arrive than anticipated, but, when it does arrive, it happens faster and more comprehensively than predicted.
So, however much oil this is in the ground, if no-one wants as much tomorrow as they need today, then peak oil will have been reached.
No matter what happens with the (currently bloated) oil supply, demand is sure to peak prior to 2050, perhaps well prior to 2050.
Yes, because of the debt bomb going off and the entire planet goes into a depression. Just in time for the next global cooling to hit.
Oil is found in the minds of men.
Peak oil will happen when peak demand happens. No sooner; no later.
“Peak oil will happen when peak demand happens.“. In a sense, what you say is necessarily true. But what really matters is what causes peak demand. If a price increase because of difficulty increasing supply, or political interference limiting supply, or political interference limiting demand, then that is likely to be quite painful. But if it is replacement by cheaper and more plentiful alternatives, then that is just great.
“Peak Oil” is a minefield. Discussing it leads to endless debates with people who have decided they 1) know exactly what the term really means and 2) they know it’s already happened.
Peak Oil is a long ways off if we’re talking about supply and demand and technology. Add the regulatory environment into the equation and all bets are off. Our current administration, for example, would love to make peak oil happen right now by chocking off exploration, production and consumption through regulation and taxes.
The G20 have already said they will remove fossil fuel subsidies, and there is the big climate meeting in Paris in November, at which all the national governments are going to agree to some specific level of reductions in CO2 and other emissions. Decarbonisation of electricity generation will take priority. Coal will be targeted and oil is also on the radar.
Inevitably the agreements are going to result in actions taken to reduce oil and gas consumption – from better insulating houses, to switch to electric heat pumps and away from burning gas and oil for building space heating. Oh, and solar panels for hot water.
We are going to need oil for petrochemicals for a long long time, so the oil industry is not going away. But by 2050 it will not be selling oil for transport or heating.
re the idea that they will “remove fossil fuel subsidies”.
Forbes:
http://www.forbes.com/sites/timworstall/2014/11/11/contrary-to-reports-rich-countries-do-not-subsidise-fossil-fuels-by-88-billion-a-year/
“Contrary To Reports, Rich Countries Do Not Subsidise Fossil Fuels By $88 Billion A Year
We’ve the latest report out trying to convince us that fossil fuel companies, those exploring for coal, oil and natural gas, are subsidised by some vast amount by the rich countries. More specifically that the G-20 countries cough up $88 billion a year to aid in the exploration for such fuels. I’m afraid that it’s not true and they reach this number by doing some quite delightful statistical dodging.
We should first note though that there are very substantial subsidies paid to fossil fuels. I’ve a note on that here. $500 billion a year is the usual rough estimate and we’ll not go far wrong with that. However, this is direct subsidies and almost all of it is taking place either in poor countries or in fossil fuel producers. The subsidy of gas to make sure that Siberians don’t freeze in the winter, below market prices for petrol in places like Venezuela. The biggest subsidiser used to be Iran but thankfully they’re gradually changing their system.
[..]”
Recent Peak was oil caused by government restricting drilling on Federal Lands.
Oil production has declined from federal lands in the last 6 years although the administration has tried to take credit for increased US production while attempting to kill it in any way possible.
Now we see that the royalties are not “fair” and the government wants a bigger slice although they do not contribute to the effort.
Lease fees paid to the US treasury have declined as the result of the environmental interest taking more and more lands off the table and not holding auctions. Lease fees are a significant part of our revenue.
The bad news, the lease bids will likely decline today because the current glut in crude and natural gas, so the public will be punished for foolish green agendas.
http://fuelfix.com/blog/2015/04/17/obama-administration-moves-forward-on-new-rules-for-oil-gas-on-public-lands/
Obama moves forward on new oil and gas rules for public lands
WASHINGTON — The Obama administration on Friday took the first formal steps to boosting the royalties that energy companies must pay for oil and gas they pull from public lands.
The Bureau of Land Management’s announcement that it would be proposing changes — and inviting public comment on the scope of them — marks the first major effort in decades to update onshore royalty rates that are among the lowest in the world.
“It’s time to have a candid conversation about whether the American taxpayer is getting the right return for the development of oil and gas resources on public lands,” said Interior Secretary Sally Jewell.
Royalty rates are currently locked in at 12.5 percent of the value of oil and gas extracted from public land — in contrast to the 18.75 percent charged for production from federal offshore leases.
The Government Accountability Office has repeatedly cast the United States’ royalty rates and rental payments as too low — below what many states and private landowners charge. Some lawmakers insist the current approach means oil and gas companies are paying far less than fair market value for the fossil fuels they harvest on federal lands.
Report: Taxpayers not getting fair return from drilling
“The royalty rate for oil and gas on U.S.-owned lands has lagged behind the royalty rate of states and for offshore areas like the Gulf of Mexico, and has been costing local governments and taxpayers hundreds of millions of dollars in lost revenue,” said Matt Lee-Ashley, the director of public lands at the liberal Center for American Progress. “This is a common sense step toward delivering a fairer return for taxpayers from the oil and gas boom and leveling the playing field within U.S. energy markets.”
more at the web site.
An exemplary post, with comments refreshingly free of the usual trolls. Thanks for keeping me awake more rewarded than from some ‘friend’s’ kittens YouTube.
Let’s see now, the rise in the peak oil graph corresponded with cheap oil and oil use in making electricity among other things for its easy transport characteristics. As oil prices adjusted higher in real terms, uses of oil was reset back to transportation and chemicals. After that point, world oil became dominated by government owned oil companies and the diversion of oil profits into the global game of populist vote buying alongside socialist vote buying with public debt in the non-oil region of Europe. Today we mostly have an oversupply of public debt and mostly under-invested oil plays.
Anyone who doubts that Peak Oil is not government made needs to look at the US government proposed plans for leasing.
“CERA 2015: Interior secretary signals five-year offshore plan could be reduced
Houston (Platts)–20Apr2015/645 pm EDT/2245 GMT
US Interior Secretary Sally Jewell indicated Monday that the Obama administration’s five-year plan for offshore oil and gas leasing could include fewer lease sales and fewer offshore plays before it is finalized, despite an industry push for the plan to include more sales in additional offshore areas.
The plan, which Interior unveiled in January, calls for 14 potential lease sales in eight of the 26 possible offshore planning areas from 2017 to 2022, including a possible sale off the US East Coast. But the plan, to the frustration of the industry, does not include sales in the Pacific nor offshore Florida’s coast and just three sales in federal waters offshore Alaska.
During a news conference at the annual IHS CERAWeek conference in Houston, Jewell indicated the plan may change before it is proposed and finalized by 2016, but those changes would only be reductions in lease sales. Interior will not consider more sales than what it has already proposed, she said.
“There’s two more bites at the apple here from what we’ve put out on the table as a proposed plan,” Jewell said.”
More at: http://www.platts.com/latest-news/oil/houston/cera-2015-interior-secretary-signals-five-year-21320672
Very little oil is used to produce electricity in the US.
Now, not then
Just a reminder that Hubbert’s bell graph was based on vertical drilling experience in basins and with significant technical improvements allowed for. It did not allow for a radical shift from conventional vertical targets and risk reward relationships in a basin to a horizontal target set within hydrocarbon source beds (shales) in the basin. That is a very different risk reward regime and goes well beyond the innovations included in the basin development experience up to that time. Even the assertion of total hydrocarbons in a basin is open to question if such source beds were previously excluded at the outset.
http://www.telegraph.co.uk/news/uknews/1344832/Sheikh-Yamani-predicts-price-crash-as-age-of-oil-ends.html
Sheikh Yamani, June 2000. He was Saudi oil minister from 1962 to 1986 and now in charge of an energy consultancy.
I hope he is right!
For a new view of peak oil, see my latest article: http://seekingalpha.com/article/3128336-what-will-prevent-oil-prices-from-dropping-or-increasing-forever-structural-factors-global-warming-evs-peak-oil-or-all-of-them