 By Christopher Monckton of Brenchley
“What Evidence,” asks Ronald Bailey’s headline (www.reason.com, April 3, 2015), “Would Convince You That Man-Made Climate Change Is Real?”
The answer: a rational, scientific case rooted in established theory and data would convince me that manmade climate change is a problem. That it is real is not in doubt, for every creature that breathes out emits CO2 and thus affects the climate.
The true scientific question, then, is not the fatuous question whether “Man-Made Climate Change Is Real” but how much global warming our sins of emission may cause, and whether that warming might be more a bad thing than a good thing.
However, Mr Bailey advances no rational case. What, then, are the elements of a rational, scientific case that our influence on the climate will prove dangerous unless the West completes its current self-shutdown?
Here is the mountain the tax-gobbling classes who tend to favor profitable alarmism must climb before they can make out a rational, scientific case for doing anything about our greenhouse-gas emissions.
The tax-gobblers’ mighty mountain
| Step 10. Would the benefit outweigh the cost? |
| Step 9. Can we afford the cost of CO2 mitigation? |
| Step 8. Will any realistic measures avert the danger? |
| Step 7. Will warmer worldwide weather be dangerous? |
| Step 6. Will temperature feedbacks amplify that warming? |
| Step 5. Will greenhouse-gas emissions cause much warming? |
| Step 4. Are humankind raising CO2 concentration substantially? |
| Step 3. Are humankind increasing atmospheric CO2 concentration? |
| Step 2. Is a consensus among climate experts compatible with science? |
| Step 1. Has any climate warming beyond natural variability taken place? |
If the answer to the question at any Step from 1 to 10 on the stony path up the tax-gobblers’ mighty mountain is “No”, there is no rational, scientific basis for climbing any further. Unless one can legitimately reach the top by answering Yes to all ten questions, there is no credible justification for any investment of taxpayers’ funds in trying to make global warming go away.
The mountain that the tax-gobblers have to climb is tall, steep, and difficult. Every policy-maker must climb that mighty mountain, and none can justify shelling out a single red cent on thwarting Thermageddon until he shall have demonstrated, at each step, that there is rational, scientific justification for climbing above that step. Gird your loins, sharpen your crampons, and grip your cromach. Let us climb.
Step 1. Is global warming exceeding natural climate variability?

No.
Step 2. Is consensus among climate experts scientific?
No. And there isn’t one anyway. A recent paper by paid propagandists trying to prove that there was a consensus inadvertently proved that there was not. Cook et al. (2013) claimed that 97.1% of 11,944 papers on “global climate change” endorsed the consensus, which they defined in their introduction as the “scientific consensus” that “most current warming” is anthropogenic. However, setting aside the fact that there has been no “current warming” for getting on for two embarrassing decades, the authors’ own data file shows that they had marked only 64 papers out of 11,944, a dizzying 0.5%, as endorsing the “consensus”.

Step 3. Are we all guilty of increasing CO2 concentration?
No, not necessarily. True, our emissions of CO2 and its atmospheric concentration are rising, but anthropogenic CO2 represents only 3% of the total free CO2 in the Earth-atmosphere system. But in logic – it cannot be repeated often enough – mere correlation does not necessary imply causation.
Professor Murry Salby, late of Macquarie University, Australia, has established that it is the time-integral of temperature changes that causes changes in CO2 concentration, leaving little or no room for any detectable anthropogenic contribution. He is not alone in his findings. If he is right, there is no need to posit any role for CO2 or other anthropogenic influences. On that analysis, climate sensitivity may well be zero.


Cross-correlations by Professor Salby between CO2 change and temperature change. He has found by detailed inspection that the observed record shows CO2 concentration change lagging temperature change by about 8-10 months, approximately the lag that would be expected on the basis of an atmospheric residence time of about 5 years. It is a settled principle of logic that that which occurs second cannot have caused that which occurred first.
Step 4. Is CO2 concentration rising to dangerous new levels?
No. Mr Bailey says CO2 concentration is 30% higher than the 800,000-year peak. So what?

Step 5. Will greenhouse-gas emissions cause much warming?
No – and, on the evidence to date, certainly not as much as the IPCC predicted.

Near-term projections of warming at a rate equivalent to 2.8 [1.9, 4.2] K/century, made with “substantial confidence” in IPCC (1990), for the 303 months January 1990 to March 2015 (orange region and red trend line), vs. observed anomalies (dark blue) and trend (bright blue) at less than 1.4 K/century equivalent, taken as the mean of the RSS and UAH satellite monthly mean lower-troposphere temperature anomalies.
Step 6. Do temperature feedbacks amplify direct CO2 warming?
No. Measurements suggest feedbacks are negative, attenuating direct CO2 warming.

Furthermore, the range of mean global surface temperature change over the past 810,000 years was just 3.5 Cº either side of the long-run average – about the same as the range of temperatures permitted by an ordinary household thermostat. It is difficult to alter the Earth’s temperature, because the atmosphere is sandwiched between two vast heat-sinks: the oceans below and outer space above.

Global surface temperature change over the past 810,000 years, obtained by halving (to correct the result for polar amplification) the temperature anomalies inferred from atmospheric δ18O ratios in ice cores from Vostok station, Antarctica. Absolute global temperature has varied by little more than ±1%.
Step 7. Will warmer worldwide weather be dangerous?
No. A growing body of papers in the literature finds climate sensitivity low – about 1 Cº per CO2 doubling. That is not enough to be harmful.

Steps 8-10. Will any realistic measures avert the danger?
No. Whether mitigation measures should be attempted in any event is an economic question, answered by investment appraisal. The UK’s $8333-per-auto subsidy for electric cars will serve as an example. The two initial conditions for the appraisal are the fraction of global CO2 emissions a mitigation measure is intended to abate, and the cost of the measure.

Going nowhere slowly: The Chevrolet Volt
Typical gasoline-powered auto engines are approximately 27% efficient. Typical fossil-fueled generating stations are 50% efficient, transmission to end user is 67% efficient, battery charging is 90% efficient and the auto’s electric motor is 90% efficient, so that the fuel efficiency of an electric car is also 27%. However, the electric car requires 30% more power per mile traveled to move the mass of its batteries.
CO2 emissions from domestic transport account for 24% of UK CO2 emissions, and cars, vans, and taxis represent 90% of road transport (DfT, 2013). Assuming 80% of fuel use is by these autos, they account for 19.2% of UK CO2 emissions. Conversion to electric power, 61% of which is generated by fossil fuels in the UK, would abate 39% of 19.2% (i.e. 7.5%) of UK CO2 emissions.
However, the battery-weight penalty would be 30% of 19.2% of 61%: i.e. 3.5% of UK CO2 emissions. The net saving from converting all UK cars, vans, and taxis to electricity, therefore, would be 4% of UK CO2 emissions, which are 1.72% of global CO2 emissions, abating 0.07% of global CO2 emissions of 2 μatm yr–1, or 0.00138 μatm. From eqn. (2), assuming 400 μatm concentration at year end on business as usual, forcing abated by the subsidy for converting all UK cars to electricity would be 5.35 ln[400/(400-0.00138)], or 0.00002 W m–2, which, multiplied by the Planck parameter λ0, gives 0.000006 K warming abated by the subsidy.
The cost to the UK taxpayer of subsidizing the 30,000 electric cars, vans, and taxis bought in 2012 was a flat-rate subsidy of $8333 (£5000) for each vehicle and a further subsidy of about $350 (£210) per year in vehicle excise tax remitted, a total of $260.5 million. On that basis, the cost of subsidizing all 2,250,000 new autos sold each year (SMMT, 2013), would be $19.54 bn.
Though the longevity of electric autos is 50% greater than that of internal-combustion autos, the advantage is more than canceled by the very large cost of total battery replacement every few years. No allowance for this extra cost is made. Likewise, the considerable cost of using renewable energy to bring down the UK’s fossil-fueled generation fraction from the global mean 67% to 61% is not taken into account, though, strictly speaking, an appropriate share of the cost of “renewable” electricity generation should be assigned to electric vehicles.
Dividing the $19 bn annual cost by the warming abated gives a unit abatement cost of $3400 tn K–1. Abating the 0.013 K projected warming by global methods of equivalent unit cost would thus cost $45 tn, or approaching $6500 a year per head of global population, or almost two-thirds of $71 tn global GDP.
Stern (2006) wrote that the cost of allowing the then-projected 3 K warming to occur over the 21st century would be 0-3% of global GDP. IPCC (2013, WGII) puts the cost at 0.2-2% of GDP. Assuming that 1 K 20th-century global warming would cost as much as 0.5% of GDP (in fact so small a warming would cost nothing), global mitigation by methods of equivalent unit cost to the UK’s subsidy program for electric vehicles would be 128 times costlier than adaptation.
In general, the cost of mitigation is 1-2 orders of magnitude greater than that of adaptation (Monckton of Brenchley, 2012). Affordable measures are ineffective: effective measures are unaffordable. Too little mitigation is achieved at far too great a cost. Since the premium is 10-100 times the cost of the risk insured, the precaution of insurance is not recommended.
Mr Bailey’s evidence
With that background, let us look at the evidence Mr Bailey adduces. He concedes that the warming rate since 1979 is 0.12-0.16 Cº decade (RSS and UAH respectively). But that is half of the rate predicted by the IPCC in 1990. He asks how we can be sure that the rise in greenhouse-gas concentration just happens to coincide with an entirely natural increase in mean temperature. But that is not what skeptics say. For it is possible that CO2 has contributed to the slight warming of the past 260 years, but it is not likely that CO2 is the major cause of the warming. Absence of correlation necessarily implies absence of causation, and the mismatch between the fluctuations in CO2 concentration change and temperature change demonstrates absence of correlation and hence of causation, at least in respect of the fluctuations.
Mr Bailey asks, “What about converging daytime and night-time temperatures?” That indicates two things: first, that there has been some warming, which is not denied; secondly, that the likelihood of severe storms outside the tropics is diminished, for it is temperature differentials, not absolute temperatures, that drive the intensity of storms. Sure enough, the IPCC admits in its 2013 report that there has been no increase in extra-tropical storminess (and none in tropical storminess, either).
Next, Mr Bailey cherry-picks a couple of months of the year and says that in those months northern-hemisphere snow cover is less by about a tenth than it was in the 1970s. Well, we had no means of measuring snow cover reliably till right at the end of the 70s; and besides, in the rest of the year there has been little, if any, decline in snow cover. Northern-hemisphere snow cover shows little change in the satellite era.

Next, Mr Bailey – who has certainly picked up all the talking-points – talks about Arctic and Antarctic sea ice, but without noticing that neither the extent nor the trend of global sea ice has changed much in the entire 35-year satellite record.

Next talking-point: Greenland, where Mr Bailey excitedly tells us the ice mass has been melting at 215 billion tons a year. However, he somehow fails to point out that the summit of the Greenland ice sheet was 2.5 Cº warmer than today a few thousand years ago, and the ice did not melt; and that from 1992-2003 a vast study area on the Greenland ice-sheet showed the ice growing at a rate of 2 feet per decade; and that even if we could measure accurately how much Greenland is gaining or losing ice 215 billion tons a year would cause an annual increase in sea level 0f – wait for drum-roll – half a millimeter.

Next, Mr Bailey, still on message – just the wrong one – says “most of the world’s 130,000 mountain glaciers are also disappearing”. No, they’re not. Actually there are more than 160,000 of them and nearly all of them are in Antarctica, which has not warmed in the satellite era, so there is no particular reason for the glaciers to vanish, and they haven’t vanished. One of them is 40 miles wide and 250 miles long.
In those parts of the world where there has been some recession of mountain glaciers, such as the Alps, researchers are finding long-lost medieval forests, mountain passes and even an entire silver mine. Besides, the retreat of the mountain glaciers began in many places in 1880, long before we could have had any influence.
And there is evidence that all but the very highest peaks of the Cordillera de Merida in the Andes were ice-free thoughout most of the Holocene. They are not ice-free now.
Next, water vapor. Mr Bailey cites a couple of studies that say there has been some increase in column water vapor in the atmosphere since 1982. However, the ISCCP satellite data, probably the most accurate way of determining this tricky variable, do not show column water vapor increasing.
Mr Bailey has his science wrong here. He says, “As temperatures increase by 1 Celsius degree, global average water vapor in the atmosphere is expected to increase by around 7%. No, the carrying capacity of the space occupied by the atmosphere for water vapour is expected to increase by 7% per Celsius degree, in accordance with the Clausius-Clapeyron relation. Just because the atmosphere can carry more water vapor, that does not mean it will. The atmosphere is not 100% saturated.

Then we are told precipitation is increasing. Well, the IPCC did not quite say that in its latest assessment report. It said confidence was high that precipitation had increased over northern-Hemisphere land areas since 1901, but that confidence in rainfall gains or losses elsewhere was low.
So let us look at the longest northern-Hemisphere mid-latitude rainfall record we have, to get some idea of how much the change in precipitation has been. Here goes.

Less than two inches more rain per year after a quarter of a millennium. Not at all easy to distinguish that from natural variability.
Mr Bailey is no Pause Denier. He admits there has been little or no warming recently, and cites Roy Spencer’s analysis of 102 models that found they had all exaggerated the warming trend by a factor of 2-5. Yet he trots out the ClimComm talking-point about the “missing heat” having gone into hiding in the ocean.
So let us look at the rate of ocean warming, measured by the 3600+ ARGO automated bathythermograph buoys.

Much of Mr Bailey’s reasoning is based not on the observed data nor on theory but on predictions. For instance, he cites an article in Nature Climate Change, a less than reliable rent-seekers’ rag, predicting that the warming rate will rise to 0.25 Cº per decade by 2020. But the IPCC predicted short-term warming at 0.28 Cº per decade as far back as 1990, and the warming rate since then has been half what it predicted. Why should we now believe predictions that have proven exaggerated by double?
Mr Bailey says the main reason for his conversion to the Temple of Thermageddon is that some researchers think climate sensitivity to a doubling of CO2 concentration might be as high as 6 Celsius degrees. But the main reason for these high-sensitivity estimates was the belief that the Bode feedback-amplification equation would apply unmodified to the climate, and that in particular no homeostatic asymptote would bound the output temperature.
The graph of the Bode equation shows that if feedbacks are strongly net-positive the equation would lead us to expect rapidly increasing climate sensitivity. But it does not apply to the climate. Researchers had wandered into a field with which they were not familiar, and had made the huge mistake of assuming that an equation that represents the behavior of dynamical systems such as an electronic circuit is applicable unmodified and undamped to dynamical systems such as the climate. Well, it isn’t. And without it, high sensitivity vanishes.

Mr Bailey concludes by asking:
“If generally rising temperatures, decreasing diurnal temperature differences, melting glacial and sea ice, smaller snow extent, stronger rainstorms, and warming oceans are not enough to persuade you that man-made climate is occurring, what evidence would be?”
Well, if Mr Bailey does me the courtesy of reading the above, he will realize that temperatures are not rising by much, glacial ice-melt (if occurring) is on too small a scale to raise sea level by much, global sea ice extent shows little change in two generations, ditto northern-hemisphere snow cover, there has been little increase in rainfall and (according to the IPCC) little evidence for “stronger rainstorms”, and the ocean warming is so small that it falls within the considerable measurement error.
The evidence he adduces is questionable at best on every count. The Temple of Thermageddon will have to do better than that if it wants to convince us in the teeth of the evidence.
I have presented much of the evidence in the form of simple graphs. Do readers like the way the graphs are presented, many of them with a small “Post-It note” highlighting the main point?
Conclusion
Back we go, down the tax-gobblers’ mighty mountain to base camp. Our attempt to climb it has failed at every single step. Even with the aid of CO2-emitting helicopters to lift us and our equipment to each new step as we fail to climb the one below it, no rational scientific or economic case can be made for taking any action whatsoever today in a probably futile and certainly cost-ineffective attempt to make global warming that is not happening as predicted today go away the day after tomorrow.
The correct policy to address what is likely to prove a non-problem – and what, even if it were every bit as much of a problem as the tax-gobblers would wish, could not by even their most creative quantitative easing be cost-effectively solved by any attempt at mitigation – is to have the courage to do nothing now and adapt later if necessary.
The question is why, in the teeth of the scientific and economic evidence, nearly all of the global governing class were so easily taken in or bought out or both by the strange coalescence of powerful vested interests who have, until now, profited so monstrously by the biggest fraud in history at such crippling expense in lives and treasure to the rest of us, and at such mortal threat to the integrity and trustworthiness of science itself.
Sorry, you missed Step 0: Prove that your measurements of “global” temperature and CO2 sources and levels are accurate to a degree (i.e. with proper error analysis) that allows you to make any scientific statement about either. Without proof that the measurements are accurate, the rest is so much garbage.
In regard to #1, what do you do if the person you trying to convince knows that you have cherry picked the only temp record that hasn’t shown recent warming, and that one is not even surface temps? Like you say, the rest of your pyramid comes tumbling down…
trafamadore:
Satellite data is far more accurate than surface data when looking at global T. So you are the one doing the cherry-picking. As usual.
No, recent refinements in the Satellite data calibration now show its in alignment with the conclusions of land based data — there’ no longer enough difference to be worthy of controversy.
dbstealey said “Satellite data is far more accurate than surface data when looking at global T.”
What is your proof of that?
Surface is surface. Troposphere is troposphere. We don’t live in the “average” troposphere, we live on the surface. The models don’t model the troposphere, they model the surface. There is no way a satellite is “more accurate” than the surface record and the satellite people have said as much. I mean, what are you thinking, the satellite calibration needs to be constantly recalibrated with thermometers in balloons. Sheesh. I mean, really, what are you thinking?
So db, you are being sort of silly. Or stupid. Whatever.
Chris says:
What is your proof of that?
“Proof” is pretty strong. I prefer reason: the U.S. government spends hundreds of millions of dollars launching and maintaining satellites that measure global temperature. Their data is accepted by scientists everywhere. Why would the government throw away money on inaccurate data?
=========================
trafamaore! You called me names! WAH!!
I’m going to tell on you to a moderator and get you banned!
dbstealey “trafamaore! You called me names! WAH!! I’m going to tell on you to a moderator and get you banned!”
I already am semi banned. Why do you think my “thoughts” come up 12 hours after I post?
[Reply: you are either banned or you’re not. ~mod.]
dbstealey said: ““Proof” is pretty strong. I prefer reason: the U.S. government spends hundreds of millions of dollars launching and maintaining satellites that measure global temperature. Their data is accepted by scientists everywhere. Why would the government throw away money on inaccurate data?”
The US government also spends hundreds of millions of dollars on ground based instruments to measure temperature, humidity, etc. I can apply the exact same reasoning you used for satellites for ground based instruments. Once again, what is your proof/evidence/reason for stating that satellite data is far more accurate than surface data when looking at global T?
[SNIP dragon slayers prose- way off topic – Anthony]
“That’s being cooled from 312K to 288K by our radiative atmosphere not warmed from 255K to 288 K by our radiatively cooled atmosphere.”
If the oceans are being cooled, why do the measurements show they are warming?
The oceans are NOT warming!
http://science.nasa.gov/science-news/science-at-nasa/2014/06oct_abyss/
You’re confusing THEORY, saying the “missing heat” must be hiding in the oceans, with actual measurements.
Alan said “The oceans are NOT warming.”
From the link you posted (http://science.nasa.gov/science-news/science-at-nasa/2014/06oct_abyss/) I quote: “Coauthor Felix Landerer of JPL noted that during the same period warming in the top half of the ocean continued unabated, an unequivocal sign that our planet is heating up. “
@Alan McIntire.
I’d also like to hear from you about the ‘lack of ocean warming’ citation that shows ocean warming. What do you say?
[SNIP by snipping Konrad for his failure to heed site policy, so must I snip this response – Anthony]
Lord Monckton,
It is unfortunate that I was at a conference three days this week and missed your reply before it was taken down. If you have a copy of it or if you have a copy of a similar response to someone else I would love to read it. You could send it to mark.stoval AT gmail.com if you would be so very kind.
I have been interested in this back and forth since the Scottish Sceptic wrote a series on climate and the positions of the various groups. In that series he had an interesting post called “Skydragons: good physics – appalling PR.” and I have wondered what your take would be on that ever since. Of course it is against this site’s policy to openly discuss any the theory that the greenhouse effect, on net, cools the earth rather than warms it so I despair of ever seeing your debating skills take on that issue. (and I don’t even know exactly where you would be on that)
Anyway, if you see this but don’t want to take the time to e-mail a note I’ll understand. I imagine your time is a limited and valuable resource.
Regards, Mark S.
“This is science. Black or white. Right or wrong.” If you are serious I have to ask when science became as simple as black or white, or right or wrong?
Konrad,
I think the temperatures measured on the moon’s surface provide ample evidence that the earth is cooler than it would be without the atmosphere to help move the heat towards the poles and upwards towards space. But the idea that CO2 does not do what James Hansen’s theory says it does is not something that either side wants to consider at this juncture in time. Perhaps in a decade or so.
”[SNIP dragon slayers prose- way off topic – Anthony]”
Anthony, it is your site and you have the right to snip, but do try to think. This is the age of the Internet, the act of censorship, just as the act of comment leaves a permanent record.
In snipping me, you are leaving a permanent record of censoring the guy who was right. I don’t want you to do that. The reason is this – you are an empiricist just like me. You didn’t trust that computer algorithms could adjust for micro site degeneration. You ran an experiment using hundreds of volunteers. And you were right. The stations most contributing to the “warming signal” were those with the most problems.
Do you like being called a “Holocaust Denier” Anthony? Can you guess how I feel about the “Slayer” smear? As I have pointed out multiple times, I have no association with that false flag operation. I present all my work as empirical experiments designed so that others can replicate. I don’t lie, I have the courage to give others clear instruction as to how to test my claims. I don’t stand on my own two feet, I stand in one steel capped boot and use the other to kick ass.
My message is simple. There can be no “lukewarmer” Realpolitik ending to this farce. AGW due to CO2 is a physical impossibility. A “soft landing” cannot be engineered, so stop trying.
Have you ever seen Monckton, Willis or Dr. Brown win a round against me without censorship? No. And many others have now seen the same thing. If those gate-keepers of opinion at WUWT were truly better than me at radiative physics, FEA and CFD, they wouldn’t need censorship to defend themselves.
Only the hard sceptics can win this. Time to open your ocular organs and turn your olfactory attentions to nearby caffeinated beverages Anthony. It’s not “warming but less than we thought”, It’s “AGW due to CO2 is a physical impossibility”.
As I said in my censored comment, It’s not good enough for sceptics to be “less wrong”. We need to be RIGHT.
[Reply: WUWT does not censor. If a comment was snipped it is because site policy makes it clear that sky dragon comments are not wanted. ~mod.]
“[Reply: WUWT does not censor. If a comment was snipped it is because site policy makes it clear that sky dragon comments are not wanted. ~mod.]”
I have seen Konrad say at JoNova’s site that the Sl*yers were not correct. He is not one of them. They do share some views, but then this site shares views with Dr. Mann and James Hansen. I would not call every post here “that Hansen crap” or anything like that.
What we have here is the censorship of a solid point of view —- the scientific point of view I was taught in college in the 70s. I was told in the 70s that the sun, our gravity, mass of the atmosphere, conduction, convection, and radiation all play various parts as do many other things. We were never told anything like the James Hansen myth that many are beholden to today.
We might be wrong, but saying that anyone who thinks CO2, on net, cools the atmosphere and does not heat it is not welcome here does look like censorship to me.
~Mark
[Reply: Thanks for the info. ~mod]
Markstoval,
Thank you for your response. Well written and to the point.
If WUWT is to retain its reputation, sceptics who claim, on the basis of empirical experiment, that CO2 causing atmospheric warming is a physical impossibility should still have a voice. If site policy says otherwise, then it is site policy that should be changed not censorship of lukewarming dissenters that should be enforced.
I put my claims to the test. I tell others how to replicate my experiments and check my claims. This is the scientific method. I find it distressing that the gate keepers Monckton, Dr. S and Dr. Brown need to flee behind censorship to avoid debate. Surely someone who’s aero & hydrodynamics engineering work has been exhibited in technology museums should be no contest? Who’s a bunch of squawking warmulonian chickens?
Moderators,
any-time you think Lindzen, Spencer, Monckton or Willis are better than me at empirical experiment or computational fluid dynamics, feel free to speak up 😉
Thank You. A very nice summation. As an engineer I could pick some nits, but I won’t as they don’t change the substance of the arguments presented.
Christopher Monckton asks…
“I have presented much of the evidence in the form of simple graphs. Do readers like the way the graphs are presented, many of them with a small “Post-It note” highlighting the main point?”
=========================
Yes, and overall an excellent post I have a few nits, but will leave that for now. Howe er I have one suggestion to add to this question…
” Will warmer worldwide weather be dangerous?”
I suggest something like this; Not only are the catastrophic affects of CO2 failing to manifest, but the benefits of additional CO2 are KNOWN and not in dispute. The climate sensitivity to doubled CO2 is, according to all the observations, neutral to slightly negative. The crop sensitivity to doubled CO2 is extremely positive, producing a 50% increase in crop growth on the SAME amount of water, on the SAME amount of land. About 1 to 1.5 billion people would potentially starve if we waved a magic wand and dropped CO_2 right back to 280 ppm tomorrow.
Dear Mr Monkton,
Your analysis of electric cars closely agrees with my calculations. However, Professor David MacKay who was (still is?) a UK government advisor on energy, still says that electric vehicles are five times more efficient than fossil vehicles. See Page 127:
Quote:
“I have looked up the performance figures for lots of electric vehicles – they’re listed in this chapter’s end-notes – and they seem to be consistent with this summary: electric vehicles can deliver transport at an energy cost of roughly 15 kWh per 100 km. That’s five times better than our baseline fossil-car, and significantly better than any hybrid cars. Hurray! To achieve economical transport, we don’t have to huddle together in public transport – we can still hurtle around, enjoying all the pleasures and freedoms of solo travel, thanks to electric vehicles.”
http://www.withouthotair.com
http://www.inference.eng.cam.ac.uk/sustainable/book/tex/sewtha.pdf
This claim was also copied and therefore repeated in the Sunday Times in Feb 2011. Now despite his threatening court action for ‘defamation’, I made Professor MacKay clarify and amend the article in the Sunday Times, as per the email below.
But Professor MacKay has still not amended his PDF briefing-note booklet to Parliament, which still says that electric cars are 5x more efficient than fossil cars. So Prof MacKay is continuing to mislead the public and mislead Parliament.
Why? How long would it take, to amend one line in a PDF booklet? I think that parliament needs to be told of this deliberate falsehood by one of its key advisors on renewable energy. How can Parliament make sensible decisions on energy policy, if one of its key advisors is fabricating the evidence and thus lying to parliament?
.
Prof MacKay’s letter of apology to the Sunday Times.
.
Dear Parin, (Business Section)
Mr Ralph Ellis has mentioned your article and his correspondence with you (pasted below).
I’d like to confirm that Mr Ellis is right to assert that what I wrote
appears to have been misinterpreted. I apologise for the lack of clarity on my part.
To be clear: when I said electric vehicles use about 15 or 20 kWh per 100 km
measured at the socket, and petrol vehicles use about 80 kWh per 100 km
measured at the petrol pump, this should not be taken as implying
that today’s electric vehicles use 4 or 5 times less fossil fuels
than petrol cars.
The electricity in the UK is largely generated from
gas and coal, and the efficiency of that elec generation is about 42%,
so electric vehicles are only about 1.7 times more efficient (assuming 20 kWh electric
is compared with 80 kWh of fossil fuel, and neglecting the upstream energy costs of
fossil fuel production in both cases).
The above statement is consistent with the emissions associated with the two
vehicle types which I estimated in my book on page 131
http://www.inference.phy.cam.ac.uk/withouthotair/c20/page_131.shtml
– I explained there that with today’s UK grid mix, elec vehicles have a footprint
of roughly 100g per km whereas the average UK car bought today rolls in at 168 g (p 122)
http://www.inference.phy.cam.ac.uk/withouthotair/c20/page_122.shtml
which is a ratio of about 1.7 to 1 in favour of the electric vehicle.
The best fossil fuel vehicles are in the 100 g range so if we compare the
best fossils with the typical electric car, they are level pegging today.
An increase in nuclear power or other low-carbon electricity will in due
course change these answers so that electric vehicles will look increasingly
good by the carbon emissions metric.
I hope this helps, and again apologies if the exposition in my book
was not sufficiently clear.
Yours
Prof David Mackay
Note:
Prof MacKay uses a 33 mpg 80kwh/100km fossil-fueled car for his comparisons. However, my large European Citroen 5-door turbo diesel does 50 mpg in mixed driving, or about 50 kwh/100km. If we multiply the electric vehicle’s power consumption by 3.7, to account for electric generating inefficiencies as per Monkton’s calculations, the Tesla has a consumption of 55 kwh/100km (3.7 x 15), which is more than my diesel. And much more, if it happens to be -10ºc outside and you have the heater on.
Nice job.
If ICE cars average 27% efficient and electrics are 5 times more efficient, that would make them 135% efficient? Heck with perpetual motion, these guys are getting out more energy then they put in.
That’s as horrific as the commonly used “5 times less”, which is actually a meaningless combination of words. Does “5 times less” mean “one fifth”? If so, why not just say that?
The advertising industry is largely responsible for destroying our ability to think and envision numbers accurately. 4 out of 5 dentists surveyed agree…. which just means that 4 out of 5 of the 2% of dentists that actually filled in the form and got a free sample of the product they were testing…. and at that, they only represent the 80% of dentists who agree that sugar-free gum is better for the teeth than chewing on sugar all day.
Anyone who lives in this civilization and hasn’t yet figured out that most numbers we hear in the media are blatant lies is just not paying attention. If your IQ is anywhere above 70 you should intuitively recognize that a “97% of scientists” claim is rubbish. I doubt you could find “97% of scientists” who agree with anything.
That is the result of using 27% as the average efficiency of the ICE. It is actually far less at the light loads experienced by the engine while powering the typical mid sized sedan on a level road at 65 mph. A typical 2 liter, 4 cylinder ICE has a specific brake fuel consumption (bsfc) around 275 grams per kilowatt hour at its most efficient operating point while that increases to 500-600 grams per kilowatt hour at the light loads experienced by a typical sedan moving at a constant 65 mph.
ref- Internal Combustion Fundamentals by John B, Heywood
I think you need to account for the amount of fuel used to create distilled fuel for a car. I suspect it is of a similar order to the amount lost when creating electricity.
>>I suspect it is of a similar order to the amount
>>lost when creating electricity.
Nonsense. You only heat to heat it to 400ºc. Besides, oil for power stations goes though the same refining process, because there is no point burning the light oils in a power station.
R
If you want to convince me of AGW being a problem, first thing to do is stop the hysterics. The catastrophe of the hour nonsense doesn’t further the cause even a little bit, it just makes the proponents of CAGW look silly— when projected times of calamity come and go without the calamity actually happening. Seriously, by some timetables that have come and gone New Yorkers should be treading water right now. But– it didn’t get THAT warm, not nearly enough glacial ice has melted for even a couple of inches or rise in sea level.
Then if it really IS a problem, how about some realistic means of combating it– assuming that can be done? Changing incandescent lightbulbs to CFC and driving electric cars won’t cut it. You would need to admit that you think there’s too many people and that we should cull the herd. Of course as soon as you say that you’ll show a hand yo’d rather not show– but that really is where all this inevitably heads all the same.
Almost all the programs, green energy, light bulbs, CFCs, biofuels, etc., are simply chances to practice crony capitalism and funds your friends and allies from the taxpayers’ pockets. Knowing most of these projects will fail means that large sums can simply disappear to offshore banks, as the mess left behind in the failures is rarely properly investigated to establish where all that money went.
the biggest winner in CAGW is big oil, as strange as it might seem. they get to eliminate coal as competition, and they get paid to pump CO2 underground to enhance oil recovery. right now they have to pay for their CO2.
Also big oil makes a ton of money on wind and solar
For starters all solar and wind plants need a natural gas plant to back them up for when the sun don’t shine or the wind don’t blow. “Big Oil” is also “Big Gas”, so right there they benefit.
Plus
Those windmills require lots of lubrication and you can’t just put 10W-40 in ’em. Nope, they need super expensive specialized synthetics that need to be changed often. Who provides that? Big Oil
Same with Solar. BP and Shell oil are among the worlds biggest solar cell distributors, but beyond that, most solar plants are Solar Thermal Plants which use the sun to heat up…..You guessed it Oil. And again, you can’t just use 10w-40 or cooking oil, nope you need a super expensive specialized synthetic blend. Who provides that? Well Big Oil of course
The sad part is the Gruber Liberal voters believe they are hurting “Big Oil” when in reality they are Big Oil’s best friend. Well they don’t call them useful idiots for nothing
You don’t have to scratch very deep:
http://www.renewableenergyworld.com/rea/news/article/2004/07/vestas-kbr-halliburton-team-up-for-wind-farm-11615
Mr Bailey concludes by asking:
“If generally rising temperatures, decreasing diurnal temperature differences, melting glacial and sea ice, smaller snow extent, stronger rainstorms, and warming oceans are not enough to persuade you that man-made climate is occurring, what evidence would be?”
Completely unbelievable. Even if the things he cites were true and significant, it would merely suggest that some climate change has occurred. It would say absolutely nothing about the cause.
As Christopher Monckton has ably shown here, the climate change we have experienced in the last century is well within the range of natural variability. Many of the changes, including temperature, could merely be the inevitable rebound from the Little Ice Age. Therefore Bailey’s argument is not just wrong, it’s nonsense.
Chris
But Bailey’s exercise depends on answering the questions honestly and accurately, Mr. Monckton.
A seminal effort, Lord Monckton.
Thanks, Christopher. Once again a very enjoyable read. Had me smiling the whole time.
Cheers.
How to convince a climate sceptic he’s wrong
This reminds me of the notice hanging outside a church hall in the late 1970’s
“Tonight,the economy and how Labour will deal with it”
Underneath someone had written:
“Next week, how to nail jelly to the ceiling”
Here is a good interview with the esteemed Freeman Dyson from the rather left leaning Vancouver (Canada) Sun. In it he says that models are wrong, and warming is good.
http://www.vancouversun.com/technology/Conversations+that+matter+Earth+actually+growing+greener/10944052/story.html
CO2 has a strong absorption and emission band at 15 microns, a small portion of Earth’s heat emission spectrum but could be a significant enough amount.
THEN WHAT HAPPENS?
I want the rest of the story. I want it from beginning to end.
And I want it told in the language that it operates at, photons, the speed of light, electrons, excited molecules, gases and solid earth. I want to see the proof that all the rest (the 90% of the story that is is still missing) is actually happening. There are about 8 billion things per second which could happen that are completely different than what the global warming theory is based on.
maybe the best thing to remember is that convection is important in the troposphere energy transfers.
This is so true and so often ignored. Convection trumps radiation almost every time. Hold your hand in front of a radiator, and then above it, to see how this works. And that is without things like tropical storms to amplify the convection.
Last time I pointed that out there was a flurry of indignant warmists shocked that I could be so dense.
Convection moves energy around the atmosphere and oceans. Warmth from equatorial regions moves toward the poles until it radiates away, or moves it high enough in the atmosphere that it can radiate away.
The planet is self-regulating for temperature with documented multi-million year stability. The reason we have life on the planet is probably directly related to long term climate stability. There is no human activity that could screw that up, even if we were trying, short of some of the more frightening schemes that put the planet in shadow.
A simple test to lay it to rest.: https://www.youtube.com/watch?v=qTrreN4aGF8
When will it end? Make it go away My good lord Mockton. The reason this scam has gotten so far is obvious and a depressing sign of our times. It’s funny on websites like this scientists and other intelligent people try to discuss this like the are a skeptic. How can you be a skeptic of something that there is no evidence of to begin with? Skeptic is a pretty far stretch… more like sane. Or a “saner” Are there spaghetti monster skeptics?
craziest scam I’ve seen in my lifetime
Point 6 has a very good graph showing positive and negative feedbacks. However, those who are not familiar with the graph won’t understand it. Please provide a brief explanation for the graph. That iirc, the models (ie the red lines) claim that as CO2 rises, the level of heat escaping the atmosphere will decline, further heating the atmosphere. However the green line with the actual satellite readings, show that all of the models are wrong. As CO2 rises, the Earth responds as we would expect, with more heat leaving the Earth’s atmosphere and escaping into space.
If the models were right, it would be a positive feedback on the buildup of temperatures in the atmosphere. However in reality, excess heat escapes the Earth’s atmosphere. This is a negative feedback on the claim of a buildup of heat from additional CO2. Since the real world satellite data shows it is a negative number, you subtract it from the Climate Model’s claims, which decreases their claimed impact of CO2 in the real world.
Adjust as needed. Item 6 is good information, if it can be stated in a way that is understandable for those not familiar with the chart, the model claims and the real world measured results.
Great work as always Christopher Monckton of Brenchley. Keep up the good work.
The ONLY relevant question is, as noted by commenters above, is “What evidence would you consider convincing that CAGW is wrong?”
As soon as my students advance to the level of writing lab reports with a scientific journal format, I insist that the hypothesis governing the experiment is clearly stated, and that it be falsifiable. They object, having not been exposed to its necessity in the scientific method, but usually acquiesce. It amazes me how quickly after that they come to understand my comparison between CAGW and Christian Science. If a proposition does not have a testable hypothesis, it is not science.
Lord Monckton here addresses the opposite question. One that would need to be addressed if Trenberth becomes successful in his effort to redefine the null hypothesis in favor of CAGW. Christopher does a fine job here, and obviously believes in keeping some of his powder dry.
While not disputing your general argument comparing CAGW to Christian Science is bit of a stretch. My observation is that Christian Science demands a level of proof completely lacking in main stream christianity. Many churches have incorporated Gaia into their worship and theology in an attempt to appeal to the CAGW crowd. This has certainly happened in my home town. On one level comical but on a political and economic level down right sinister. The Catholic church for example will shortly endorse the AGW position.
AB,
Each of your points is well-taken. That my actions are influenced by a Jewish carpenter running around the Middle East two millennia ago results from faith, not science. I have no such faith in CAGW. Thus, when reviewing the science basis for each topic, the formalities of scientific methodology play a significant role in my intellectual acceptance of the science.
I have not seen a clear list of testable hypotheses, leading to a global conclusion for either topic. Lord Monckton, in the main article, presents ten points that should have been presented as hypotheses outright by the CAGW crowd. The fact that he trashes them so effectively reflects their reticence to being held accountable. The recent analyses of the Shroud of Turin constitute solid test methodology, and are very interesting technique applications, but the operational hypothesis was limited to whether it is the image of a crucified man formed two thousand years ago by an unknown process. Does a final answer either way lead to a firm conclusion on the basis of Christian Belief?
Thanks for a stimulating lunch break.
Re Step 3:
The earliest Murry Salby presentation on CO2-lags-Temperature was (I believe) at the Sydney Institute in August 2011:
My similar January 2008 paper predates Salby by more than three years.
http://icecap.us/index.php/go/joes-blog/carbon_dioxide_in_not_the_primary_cause_of_global_warming_the_future_can_no/
I concluded that in the modern data record, the rate of change dCO2/dt varies ~contemporaneously with temperature and atmospheric CO2 lags temperature by about 9 months.
Atmospheric CO2 also lags temperature by about 800 years in the ice core record on a longer time scale.
Therefore, atmospheric CO2 lags temperature at all measured time scales.
I suggest with some confidence that the future cannot cause the past.
The evidence suggests that atmospheric CO2 does not significantly drive temperature; in fact, temperature (among other factors) drives CO2.
This still allows for other significant drivers of atmospheric CO2, such as fossil fuel combustion, land-use changes such as deforestation, etc. This question, called the “mass balance argument”, has been ably debated on wattsup and elsewhere by Richard S Courtney and Ferdinand Engelbeen.
The global warming alarmists have dismissed this lag of CO2 after temperature as a “feedback effect”, which I suggest is a Cargo Cult argument (i.e. They KNOW that CO2 drives temperature; therefore it MUST BE a feedback effect). 🙂
Regards to all, Allan
Ron, I suggest you read the 2008 icecap paper, which covers the satellite data from ~1978 to 2007. I later verified the temperature-drives-CO2 relationship back to 1958 using Mauna Loa CO2 data and Hadcrut3 temperatures.
I suggest below that short-term temperature change is not the only factor that drives CO2 – other factors that may contribute include fossil fuel combustion, deforestation, longer term temperature-CO2 cycles, etc.
Global temperature in the 20th Century varied up and down naturally, with little if any causal influence from increasing atmospheric CO2. The only clear signal we can derive from modern data is that CO2 lags temperature at all measured time scales..
Regards, Allan
More here:
http://wattsupwiththat.com/2015/03/15/chaos-climate-part-1-linearity/#comment-1885239
To be clear, I am saying that Temperature (among other factors) drives CO2 much more than CO2 drives Temperature.
The annual rate of change dCO2/dt (detrended, in ppm/year) ~= 4T (Temperature anomaly, in degrees C).
Thus the integral CO2 lags surface and tropospheric temperatures by about 9 months.
Natural CO2 flux dwarfs humanmade CO2 emissions. Some parties say that the observed increase in atmospheric CO2 concentrations is primarily natural – I suggest the jury is still out on this question, and fossil fuel combustion, clearing and burning of rainforests and other land use changes do contribute – how much is the question.
See also this January 2013 paper from Norwegian researchers:
The Phase Relation between Atmospheric Carbon Dioxide and Global Temperature
Global and Planetary Change
Volume 100, January 2013, Pages 51–69
by Ole Humluma, Kjell Stordahlc, Jan-Erik Solheimd
http://www.sciencedirect.com/science/article/pii/S0921818112001658
Highlights
– Changes in global atmospheric CO2 are lagging 11–12 months behind changes in global sea surface temperature.
– Changes in global atmospheric CO2 are lagging 9.5–10 months behind changes in global air surface temperature.
– Changes in global atmospheric CO2 are lagging about 9 months behind changes in global lower troposphere temperature.
– Changes in ocean temperatures explain a substantial part of the observed changes in atmospheric CO2 since January 1980.
– Changes in atmospheric CO2 are not tracking changes in human emissions.
“Textbooks are not peer reviewed.”
Really Ron?
Had I realized you were a troll, I would not have wasted time on you.
A day is a time scale, too. Normally what Allan MacRae and others refer to are historical temperature records. You can see here that CO2 follows temperature, but at times there is a short term divergence.
And we see that on longer time scales, CO2 always follows temperature:
http://www.brighton73.freeserve.co.uk/gw/paleo/400000yearslarge.gif
But what we DO NOT ever see is that ∆T is caused by ∆CO2. Therefore, it is hard to argue that a rise in CO2 is the cause of global warming. If there is any such effect, it is simply too small to measure.
Has ∆T been zero for the past 15-18 years?
Close enough.
Don’t you think ∆CO2 would have followed ∆T in the past 15-18 years and remained zero (close enough) instead of increasing by over 8% ?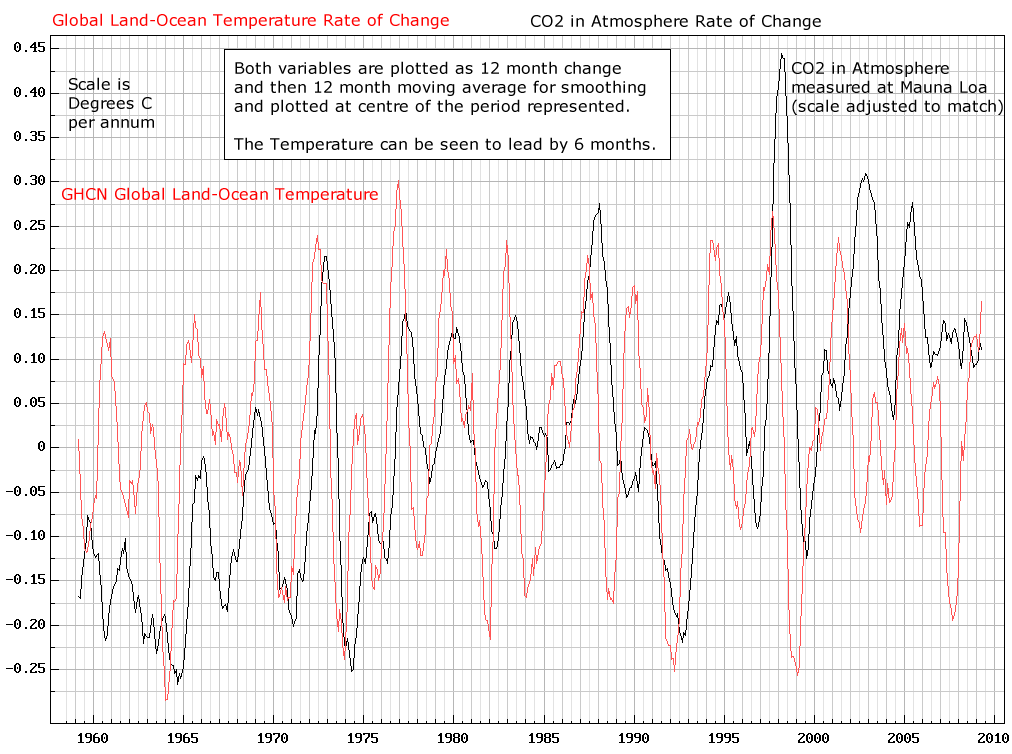
Not necessarily. As explained, there are sometimes short term divergences. In the chart below you can see temporary divergences around 2003 – 2004, around 1961, and at other times:
A temporary divergence would be expected. But as explained above, there are no instances where ∆CO2 is the cause of ∆T.
That fact destroys the climate alarmists’ case. They have based their argument on demonizing “carbon”, by which they mean CO2. But all real world evidence shows that there is no such cause and effect.
I’m glad you agree with me that MacRae is incorrect…
I agree with Allan MacRae. Take some time to read up on the subject here, including the comments. You will learn a lot.
Next, your chart of Mauna Loa data means nothing. It does not show causation, which is the basic debate. Here is a better chart.
Finally, the fact that CO2 follows temperature — not vice versa — destroys the alarmist argument. The chart below is from Wikipedia, hardly a skeptical blog:
http://upload.wikimedia.org/wikipedia/commons/8/82/Past_740_kyrs_Dome-Concordia_ice_core_temperature_reconstructions.png
Note the “Note” in the chart.
How do you explain…&etc.
Ron, you haven’t had time to read the linked article and comments I provided. That would answer most, if not all of your questions.
Also, you have causation backward: the real question is: why doesn’t ∆CO2 cause ∆temperature? Because that is the central premise of the alarmist crowd.
The question concerns causation. The alarmist folks want us to believe that CO2 is the cause of global warming. But as we see, empirical evidence only shows the opposite: that ∆T causes ∆CO2. There is NO real world evidence showing that CO2 is a driver of global temperature. [CO2 may affect temperature. I think it does. But the effect is so small that it can be completely disregarded.]
Once again I suggest you go back and read the WUWT article and comments that I linked for you. You will learn a lot.
Your claim that CO2 follows temperature doesn’t work for the past 15-18 years.
That is not even the question. I’ve provided you with an easy to understand explanation, which you are free to accept, or reject. I don’t care whether you learn or not. I’ve also explained that the central question is not whether temperature always, in all cases, controls CO2. Obviously it doesn’t; only in almost all cases, from centuries to hundreds of thousands of years. The central question is whether a rise in CO2 will cause global warming. You always deflect from that.
Allan MacRae has also explained for you. I agree with Allan. I do not see why you refuse to understand (actually, I think I know). He has provided you with study materials, but you’re uninterested in them.
I’ve posted explanations for you using various links, which you disregard and refuse to read, even though I am sure your answers are there. I’ve told you that. But you state that you refuse to read either my links or MacRae’s. I’ve posted links to charts, showing that what you seem to believe is wrong. You refuse to acknowledge them. Then you pompously proclaim:
Please try to stay on topic.
First, the central topic is always this: the alarmist cult has stated their conjecture that a rise in CO2 will cause global warming. That’s what they hang their collective hats on. Without that premise, there would be no topic at all. There would not even be a WUWT to comment on. So you don’t get to define a topic to the exclusion of everything else.
It is the job of scientific skeptics like myself to deconstruct conjectures. I’m doing my job. And skeptics are good at it: the “carbon” scare has been booty-kicked out of the realm of science, and into politics. Their conjecture has been falsified by Planet Earth.
Second: You do not decide what I will post. I decide what I will post. You just don’t like the fact that the charts I posted debunk the alarmist narrative. There is no verifiable, testable, measurable evidence that a rise in CO2 will cause global warming. That’s what the charts I posted show conclusively.
And you are still bird-dogging my comments. Why? Here I am, responding to your last two unfriendly posts in a row. All your comments responding to my posts are unfriendly. Why is that? Who got you so wound up? I patiently tried to respond ever since you showed up a few weeks ago, attacking my comments. But you’re not interested in explanations. You never accept them. Every explanation is met with an objection.
You have no interest in learning anything, you are only interested in running interference. Allan MacRae was correct when he pointed out that you are trolling. My advice: stop it. You are not interested in learning. If you were, you would have read the article I provided, and the hundred-plus comments under it. As I told you, your explanation is there. I don’t care if you read it or not. If you don’t it’s your loss.
I am happy to help you or anyone else understand the basics. But when I see someone like you endlessly bird-dogging my comments with your inane questions, always deflecting, and always moving the goal posts, I know what’s up. You are not here to learn anything. You are here to attack. To run interference. My advice: find someone who won’t put you in your place. It will be much easier on you. Because I won’t roll over, and you are not smart enough or knowledgeable enough to get the upper hand.
Ron
http://www.woodfortrees.org/plot/esrl-co2/mean:12/from:1979/derivative/scale:3/offset:-0.3/plot/rss/from:1960
The plot shows that the rate of CO2 level change correlates reasonable well with the the RSS data. The rate has been constant while the temperatures have been constant. It shows that the equilibrium CO2 concentration for the current temperature is a lot higher and still more than 8 years away.
Before there is an argument as to why, I looked at how well they correlate by subtracting a line of best fit, taking 0.68SD of each to work out the lower and upper quartiles and when one is in the upper or lower quartile, the other is also twice as often as you would get by chance (about 0.45 rather than 0.25). So the correlation is not because I chose an arbitrary offset and scaling.
Also, I have zero faith in those numbers so I’m not going to argue about what it means.
Robert and db,
There is a lag in the variability of the rate of change of CO2 after temperature changes, but that says next to nothing about the cause of the increase as by taking the derivative, you have effectively detrended the curve of the original increase. That there still is a slop is because the human emissions and as result the increase in the atmosphere are slightly quadratic, which gives a linear slope in the derivative.
The short term effect of temperature on CO2 levels is +/- 4-5 ppmv/K, the long term effect over ice ages is 8 ppmv/K. Humans have emitted twice the amount as seen as increase in the atmosphere, which is far beyond what temperature can do…
Allan MacRae
You say
and
But the similar finding by Kuo et al. predates you by nearly two decades.
Their paper is
Kuo, C., Lindberg, C., Thompson, D.J., 1990. ‘Coherence established between atmospheric carbon dioxide and global temperature’. Nature 388, 39-44.
In 1990 that paper reported atmospheric CO2 concentration and global temperature cohere such the changes to the CO2 lag changes to the temperature by 9 months. Subsequently, other papers indicate that the time of the lag varies with latitude.
Richard
Agreed Richard.
You kindly referred me to that Kuo et al 1990 paper and also a Keeling et al 1995 paper some time after I wrote my 2008 paper.
My 2008 paper pointed out the closer coherence of dCO2/dt with temperature, which results in the ~9 month lag of CO2 after temperature.
The close dCO2/dt relationship with temperature points to the causal mechanism and should be investigated further.
I believe the primary driver of atmospheric CO2 is photosynthesis and oxidation of plant matter, driven primarily by the larger Northern Hemispheric landmass; lesser drivers include dissolution/exsolution of CO2 from oceans, fossil fuel combustion, deforestation, etc.
It is clear that temperature drives atmospheric CO2 much more than CO2 drives temperature.
Best personal regards, Allan
However Richard, isn’t it interesting that the conclusion of Kuo and Keeling that CO2 lags temperature was apparently forgotten to mainstream climate science, since both sides of the fractious mainstream debate have focused almost exclusively on the magnitude of Equilibrium Climate Sensitivity (ECS), with the warmists say it is high and the skeptics saying it is low.
Since 2008, only a few individuals have been willing to discuss this lag, which implies that ECS is so low as to be irrelevant or even nonexistent. Most professionals on both sides of the mainstream ECS debate are so uncomfortable with the lag they will not even publicly discuss it, and yet I suggest it will become the conventional wisdom in climate science within ten years, and many will then say of course they knew it all the time…
Best personal regards, Allan
Allan MacRae:
I agree all you say. However, in my own defense, I point out that I have been consistently pointing out this lag since 1990.
Another issue I have been trying to promote for years is the effect of cloud cover variations on radiative forcing. Good records of cloud cover are very short because cloud cover is measured by satellites that were not launched until the mid-1980s. But it appears that cloudiness decreased markedly between the mid-1980s and late-1990s
(ref. Pinker, R. T., B. Zhang, and E. G. Dutton (2005), Do satellites detect trends in surface solar radiation?, Science, 308(5723), 850– 854.)
Over that period, the Earth’s reflectivity decreased to the extent that if there were a constant solar irradiance then the reduced cloudiness provided an extra surface warming of 5 to 10 Watts/sq metre. This is a lot of warming. It is between two and four times the entire warming estimated to have been caused by the build-up of human-caused greenhouse gases in the atmosphere since the industrial revolution. (The UN’s Intergovernmental Panel on Climate Change says that since the industrial revolution, the build-up of human-caused greenhouse gases in the atmosphere has had a warming effect of only 2.4 Watts/sq metre).
Put the CO2 lag of temperature together with the effect of cloud cover and it is very hard to dispute your assertion that
Regards to you.
Richard
Thank you Richard,
Great to hear from you.
Interesting points on cloud cover – seems to relate well to Svensmark. I must read further.
I wonder if cloud cover is increasing again with declining solar activity?
Best, Allan
Ferdinand, I’m not referring to the slope when I say correlation. When one goes significantly positive from the slope, the other does more often than it would randomly (and vice-versa when it goes negative)
‘Slop’ is probably the correct word though. Even if it was physically true, its strange that it shows up in the data.
Robert B,
Everybody agrees that the variability around the CO2 increase is caused by temperature: indeed there is a (for a natural process) quite good correlation between temperature rate of change and CO2 rate of change (also between temperature and CO2 rate of change, but that is because taking the derivative shifts a sinusoid back in time without much change in variability). See e.g. what Pieter Tans says about the influence of temperature on the CO2 rate of change (from slide 11 on):
http://esrl.noaa.gov/gmd/co2conference/pdfs/tans.pdf
The point is that Dr. Salby and others use the high correlation between the short term (2-3 years) variability of temperature and CO2 to assume that temperature also is responsible for the bulk of the increase over the past 55 years of accurate measurements.
That is a bridge too far: the variability is clearly caused by the influence of temperature variations on (tropical) vegetation, but the trend is certainly NOT caused by vegetation, as that is a net increasing sink over time. Variability and trend are caused by different processes and not necessarily by temperature for the trend.
As human emissions are twice the increase in the atmosphere and both show a slightly quadratic increase over time and human emissions fit all known observations, there is little doubt that humans are directly responsible for the recent increase…
Ah Ferdinand,
Again with the mass balance argument, which may or may not be correct.
Richard S Courtney has argued this question far better than I can, on wattsup and elsewhere.
Best personal wishes, Allan
Please note that the annual range of atmospheric CO2 varies from about 16ppm in the far North (Barrow Alaska) to near-zero at the South Pole.
The annual growth rate of CO2 is only about 2ppm. This 2ppm annual growth rate may be primarily caused by fossil fuel combustion (the “mass balance argument”), or it may be primarily caused by other factors either humanmade or natural.
However, this mass balance argument about the Earth’s carbon cycle, while of great academic interest, can be viewed as irrelevant to the question of manmade global warming, because it is clear that Earth’s climate is INsensitive to increasing atmospheric CO2.
Furthermore, it is also clear that Earth’s atmosphere is CO2-deficient. More atmospheric CO2 is clearly beneficial for the environment and for humankind, whatever its source.
CO2 is naturally sequestered by coral reefs, such that ultimately, all carbon-based life on Earth’s surface will disappear when atmospheric CO2 falls below certain levels.
Hello Allan,
Some time ago…
Your argument doesn’t hold: because the tide gauges show meters of change with waves and tides, that doesn’t exclude that tide gauges can be used to show a few mm sea level change per year, even if you need 25 years of data to make the change statistically relevant.
For the increase in CO2 it is much easier: the seasonal variability is globally around +/- 4 ppmv, while the 2-3 years residual variability is +/- 1 ppmv. Human emissions are ~4.5 ppmv/year and the increase is about 2 ppmv/year, surpassing natural variability in only a few years…
As Dr. Singer, Dr. Spencer and several others said some time ago: it is a quite bad argument from skeptics to even allude that the increase of CO2 as not from human origin. It undermines the rest of the arguments which are much more solid, like the cause of the pause (directly linked to the sensitivity of temperature for the CO2 increase)…
Alan,
One can hardly say that CO2 lags temperatures over the past 160 years. At minimum both parallel each other and in some periods temperature goes down or flat (1945-1976 and 2000-current) while CO2 goes up unabated. Moreover, the increase is far beyond the historical changes of 8 ppmv/K and far beyond the solubility of CO2 in seawater for the current temperature.
As for your “mass balance argument”, it relies on a “fixed pie” concept that is probably not applicable in this case, as in other fields where factors are inter-dependent:
I never trust any economical projection, as that never takes into account the unpredictability of human behavior, but I still trust the behavior of carbon atoms, that they don’t disappear in space neither are created from nothing (except 10^-22 of all carbon in the atmosphere by cosmic rays…)
If humans add 9 GtC/year as CO2 and the measured increase is 4.5 GtC/year, somewhere somehow there are 4.5 GtC/year more natural CO2 sinks than sources on earth, whatever mathematical thought experiments try to convince me from the opposite… Thus indeed an ever changing mass balance which must balance for each year between human and natural emissions and natural sinks.
The atmosphere is just a dump site for all CO2 of all sources. The sinks just grab what they need, if they are temperature dependent (seasonal to 2-3 years) or they grab more CO2 if they are pressure (difference) dependent. The latter is mainly the case for the oceans: besides a rather fixed temperature dependency, their CO2 balance between ins and outs is heavily influenced by the increased CO2 pressure in the atmosphere, which is caused by the emissions, not temperature…
Hello Ferdinand,
I should be more clear on this subject. Based on your last post, we really do not disagree on what I consider to be the important point.
I have repeatedly stated that I am an agnostic on the “mass balance argument”. Furthermore, I do not even view it as necessary in this debate about manmade global warming.
As I said previously:
“The annual growth rate of CO2 is only about 2ppm. This 2ppm annual growth rate may be primarily caused by fossil fuel combustion (the “mass balance argument”), or it may be primarily caused by other factors either humanmade or natural.
However, this mass balance argument about the Earth’s carbon cycle, while of great academic interest, can be viewed as irrelevant to the question of manmade global warming, because it is clear that Earth’s climate is INsensitive to increasing atmospheric CO2.
It is clear that temperature and other factors drive atmospheric CO2 much more than CO2 drives temperature.”
We agree that ECS is quite low – and that is all that matters at the practical and political level of this global warming debate.
At the scientific level, I suggest that ECS is very low or even insignificant, since the only signal we can detect in the modern data is that CO2 lags temperature.
A note to the moderators and Ferdinand..
The green slime are increasingly infiltrating wattsup and deliberately disrupting valid and interesting conversations on important subjects.
I correctly identified the impostor as a troll on April 9, 2015 at 12:34 pm after reading his post regarding “peer review”, only his second post that I recall ever reading.
Ron’s appeal to the alleged absence of “peer review” is a typical Troll Mantra which, I suggest, could be added to the spam filters here at wattsup.
There are several other Troll Mantras – perhaps contributors to wattsup would be so kind as to propose a list of Troll Mantras for our edification and amusement.
Ladies and gentlemen, faites vos jeux!
It seems to me that one important question is missing from the mountain: “Is the science actually valid?” Back in 1900, Knut Angstrom conducted careful experiments to test Svante Arrhenius’s novel idea that absorption of infrared Earth radiation by carbon dioxide would produce a greenhouse warming effect, and concluded that any such effect was insignificant. Some 30-odd years later, a British engineer named Guy Callendar revived Arrhenius’s concept on little more than a conviction that it should work, but neither he nor anyone else has seen fit to repeat Angstrom’s careful experiments or to concoct new ones to test the theory, so here we are, just taking it on faith. It seems rather odd, nay, damned odd, however, that life on Earth, which is so fundamentally dependent on carbon dioxide, should have failed to evolve mechanisms to defend itself against any fortuitous, and possibly deleterious, excursions of that vital gas. In fact, life on Earth has indeed done just that with such well-documented mechanisms as the production of dimethyl sulfide by marine phytoplankton, and of carbonyl sulfide by soil microorganisms, in response to increases in the atmospheric concentration of CO2. The sulfur ends up as sulfuric acid condensation nuclei on which clouds form, increasing albedo and thus cooling the planet. Of course, such mechanisms don’t appear in the climate science models, but never mind. Consensus can always compensate for such shortcomings.
David, I can be wrong, but as far as I know, Callendar was mainly interested in the accuracy of CO2 measurements, based on stringent pre-defined criteria to weed out data taken in the middle of towns, etc. He and many others at that time and later assumed that more CO2 would be beneficial for agriculture and the world in general. The extreme scenario’s only emerged in the late 1980’s with the first climate models and the warming after 1976, not in the 1940’s…
I think it was Budyko in the late 60’s who hiked up the CO2-alarm with his unrealistic climate sensitivity of 6 degrees per CO2-doubling in his crude model.
You’re still citing this guy? : ‘In 2005, the National Science Foundation opened an investigation into Salby’s federal funding arrangements and found that he had displayed “a pattern of deception and a lack of integrity” in his handling of federal grant money. He resigned his position in Colorado in 2008 and became professor of climate risk at Macquarie University in Macquarie Park, New South Wales. In 2013 he was dismissed by the university on grounds of refusal to teach and misuse of university resources’
regardless of where his funding comes from, why has popular culture accepted this flawed logic. If somebody or some political faction says anything funded by this group or this corporation then the science and reporting is automatically fraud and contrived? That is circle reasoning. Why would a corporation commit fraud if it didn’t have to? The science speaks for itself. No need to practice junk science here. Why is government funding left of the hook? Oh yeah because the government never lies. It is gospel sent from higher life forms.
Why don’t you focus on Salby’s science, or is playing the man the only thing you have left?
His “Science” is worthless.
Playing the Mann, I think you mean.
warrenlb has no credible facts or evidence. That’s why he always engages in ad hominem fallacies to make his quack arguments.
I have no doubt that if we scrutinized “warrenlb”, there would be plenty of skeletons in his closet that would make Salby look like a saint by comparison.
warrenlb: if you cannot argue facts and evidence, go away. We don’t need your kind of personal denigration of people you have never met, and who have forgotten more than you will ever know about the subject. Your crusade of personal destruction via innuendo reflects very badly on you, and it doesn’t help this excellent site, either. Be despicable somewhere else.
An arrogant dismissal of someone who , to judge by his textbook open before me , has outstanding mathematical ability – the quality of intellect necessary for establishing the details of radiative transfer and convective models for input to any advanced modelling. Is climate science so full of bright people that it can dismiss his contributions as ” worhless”.
OK then , if you are so much more brilliant than Salby that you can dismiss his work so contemptuously show us how good you are . His chapter on atmospheric radiation has 34 problems of increasing complexity. Pick one in the middle of the range , and solve it for us – in public , on the blog . And dont say that you cannot locate a copy of the work , it is available as a free pdf book , as I am sure that you know. .
Up for it?
mikewaite,
Prestige for-profit journals likely aren’t motivated to publish the work product of blithering idiots. The whole point of that heuristic is to save we arm-chair experts the effort of learning everything.
Warrenlb when you write an equivalent to Salby’s 660-page peer reviewed textbook
‘ Physics of the Atmosphere and Climate’ published by Cambridge University Press, ISBN 978-0-521-76718-7 will people start to consider your verbal diarrhea (VD).
See the definition of VD in the Urban Dictionary:
https://www.google.com.au/url?sa=t&rct=j&q=&esrc=s&source=web&cd=2&cad=rja&uact=8&ved=0CCIQFjAB&url=http%3A%2F%2Fwww.urbandictionary.com%2Fdefine.php%3Fterm%3DVerbal%2BDiarrhea&ei=jaQmVYfIJ8fAmAWZooHoAw&usg=AFQjCNEyn0UQTvBQUDD_akFyVQNBAt5QuA&sig2=W57TM7DH–5N-6YEX8GVtQ&bvm=bv.90491159,d.dGY
It depends how you define “Peer Review”. From Salby’s book.
Praise for Physics of the Atmosphere and Climate
“Salby’s book is a graduate textbook on Earth’s atmosphere and climate that is well
balanced between the physics of the constituent materials and fluid dynamics. I
recommend it as a foundation for anyone who wants to do research on the important
open questions about aerosols, radiation, biogeochemisty, and ocean-atmosphere
coupling'” -Professor Jim McWilliams, University of California, Los Angeles
“Salby’s book provides an exhaustive survey of the atmospheric and climate sciences.
The topics are well motivated with thorough discussion and are supported with
excellent figures. The book is an essential reference for researchers and graduate and
advanced undergraduate students who wish to have a rigorous source for a wide
range of fundamental atmospheric science topics. Each chapter ends with an excellent
selection of additional references and a challenging set of problems. Atmospheric
and climate scientists will find this book to be an essential one for their libraries.”
-Associate Professor Hampton N. Shirer, Pennsylvania State University
“Murry Salby presents an informative and insightful tour through the contemporary
issues in the atmospheric sciences as they relate to climate. Physics of the
Atmosphere and Climate is a valuable resource for educators and researchers alike,
serving both as a textbook for the graduate or advanced undergraduate student with
a physics or mathematics background and as an excellent reference and refresher for
practitioners. It is a welcome addition to the field.”
-Professor Darin W. Toohey, University of Colorado at Boulder
Salby’s earlier book is a classic. As a textbook it is unequalled in breadth, depth, and
lucidity. It is the single volume that I recommend to all of my students in
atmospheric science. This new version improves over the previous version, if that is
possible, in three aspects: beautiful illustrations of global processes (e.g. hydrological
cycle) from newly available satellite data, new topics of current interest (e.g.
interannular changes in the stratosphere and the oceans), and a new chapter on the
influence of the ocean on the atmosphere. These changes make the book more useful
as a starting point for studying climate change.”
-Professor Yuk Yung, California Institute of Technology
Apologies the text was OCR-ed.
There are too many anonymous slimers on this page.
Thank you Frank and others for your defence of Murry Salby.
@FrankKarrvv.
Are you appealing to Authority?
warrenbot,
Boy, you simply do not understand the Appeal to Authority fallacy.
As I explained, he doesn’t understand the ATA fallacy. It’s clear from your comment that you don’t, either.
None of this surprises me. I’m used to dealing with alarmist ignorance.
Re the ‘latest research’ comment. Goodness me. Ron I suggest you go to Salby’s book to learn some basics. Go through the book and do the exercises and then come back to indicate you understood all that was in the book and that you completed all the exercises.
Then you will have more authority than you have now.
I forgot to mention Salby’s preface.
” This book has benefited from interaction with numerous colleagues and students. In addition to those received earlier….etc”. He goes on to name the individuals who provided contributions and feedback.
Seems to me that’s close to peer review.
:
Writes FrankKarrvv:
Well, no.
Not to reflect ill on Dr. Salby, but that’s pretty much the definition of “pal review.”
Peer review requires “blinding” by referees – usually the editorial staff of a periodical or a conference’s proceedings – so that the comments and responses are “anonymized.”
If your “colleagues and students” know you, and you know who they are, it ain’t “peer review” in the strictest sense at all.
What ought to help preserve a textbook from error is editorial review, with the editors’ objective being to ensure that the book is perceived as a reliable element in education – and will therefore sell well.
Of course, that’s not a guarantee.
Just ask anyone who’s gotten stuck with any of the editions of Samuelson’s Economics in an Econ 101 course.
With the Obama administration it is not about the science it is all about the control. Remember at the moment they are still in charge and forget the science.
Poor Mr. Monckton, Falling at the first fence with his smoke and mirrors RSS faux pause trick. Of course he well knows that surface (where most of us actually live) data shows a different story:
http://www.climate4you.com/
And then there’s that inconvenient Ocean heat content. Remember? The place where more than 90% of the heat goes?
http://www.nodc.noaa.gov/OC5/3M_HEAT_CONTENT/
And that sea level rise. Just what is causing that if no land ice is melting, and the oceans aren’t Warming:
http://climate.nasa.gov/vital-signs/sea-level/
Please, Sir Christopher, don’t insult my intelligence by telling me that there’s been a 20 year pause 😉
what’s next a link to skeptical science?
you give a link to climate journalism for evidence of heat in the oceans when the extensive float data proves this wrong. Then you give a link about sea level rise when all the sea level assessments the ipcc uses comes from giss data that has never been made public in the raw form. In previous ipcc assessments they admit no rise in sea level rate in the 20th century. now noaa, CU and the rest of the giss gang claim a sudden rise in rate in the last 12 years. No added heat in the atmosphere or ocean in over 18 years yet the sea level suddenly shoots up. no massive melting of ice caps either. Doesn’t seem suspicious at all. I mean until now this has been painfully ethical science. I don’t know what I was thinking
How can this be, a different idiot has been telling us that the satellite data and ground data are in perfect agreement?
That’s a concern rather than reassuring.
“And then there’s that inconvenient Ocean heat content. Remember? The place where more than 90% of the heat goes?” If 90% goes into the ocean, there’s only 10% left to heat the atmosphere, so it must virtually be cooling. It’s easy to estimate the amount of heat that would have to go into the ocean to increase the ocean temperature by say 1 K. Neither you nor your descendents will be around when this happens, should it happen.
What intelligence?
You would first have to demonstrate intelligence before complaining that it is being insulted.
Pachauri and Slingo, two eminent warmists, both publicly acknowledged the existence of the pause (or as it will in future decades be called, the peak).
The problem with dealing with village idiots is that they aren’t very well-informed. They comment caustically on topics they have no clue about.
Village Idiot continues to live up to its name. It mentions the “missing heat” notion. If it had read the head posting it would have realised that the ocean is warming at a rate equivalent to 0.2 Celsius per century. Hard to make a climate crisis out of that.
In his first paragraph, Village Idiot claims that satellite temerature data somehow doesn’t count because it’s not measured at the surface “where most of us actually live”. In his second paragraph he wheels in the “ocean heat content” meme. Most of us don’t actually live in the ocean so that too is clearly irrelevant.
For forecasts of the coming cooling based on the1000 year and 60 year natural cycles in solar activity see
http://climatesense-norpag.blogspot.com/2014/07/climate-forecasting-methods-and-cooling.html
We have started the general cooling to the depths of the next LIA in about 2650.
For the temperature peak of the millennial cycle in about 2003 and the subsequent cooling see
see
http://www.woodfortrees.org/plot/rss/from:1980.1/plot/rss/from:1980.1/to:2003.6/trend/plot/rss/from:2003.6/trend
Excellent post as always Christopher, thank you!
I would like to add that during the General Election campaign here, not one of the political leaders came close to telling the electorate, that due to diktats from the EU our way of life has to change to pre-industrial times. Why? Because we rely on fossil fuel for our economy and the EU want us to cut our fossil fuel consumption to levels that would have a huge adverse effect on our economy. We rely totally on information technology, which in turn relies on dependable electricity production, which we will not have when the wind fails to blow or the sun doesn’t shine. Ironically there was an item on the radio just now confirming an oil find of a projected 150 billion barrels crude in the south of England,which if the EU has their way we will not use!