Guest Opinion: Dr. Tim Ball
The 2001 Intergovernmental Panel on Climate Change (IPCC) “Hockey Stick” graph produced solutions for three facts challenging the claims of key IPCC climate scientists at the Climatic Research Unit (CRU). The problems appeared in Figure 7c in the 1990 First Assessment Report (FAR) (Figure 1).

The three problems it created were
- The Medieval Warm Period (MWP) contradicted their claim that the 20th century was the warmest ever.
- The Little Ice Age (LIA) showed that the present warming trend began prior to the major impact of the Industrial Revolution. Significant production of CO2 by humans began only after World War II.
- The trend of the warming since circa 1650 A.D., the nadir of the LIA, was well within natural variability.
The hockey stick graph dealt with all those by eliminating the MWP and the LIA. It inappropriately tacked on, as the blade of the stick, an upturn in temperature in the 20th century. Phil Jones produced the upturn that claimed a 0.6°C ±0.2°C increase in 120 years. They claimed this rate of increase was beyond any natural increase, conveniently ignoring the ±33% error factor.
A second part of their problem involved a paper by Soon and Baliunas titled “Proxy climatic and environmental changes of the past 1,000 years” (Climate Research, 23, 89–110) that detailed worldwide evidence of existence of the MWP. The personal attacks on Soon and Baliunas are now exposed, particularly the role of John Holdren when at Harvard.
A third part involved the claim that Figure 7c was the temperature for the Northern Hemisphere and neither the LIA nor the MWP was a global event. The argument that a climatic period was regional or for a given portion of a record, was used to counter the problem that the Holocene Optimum was warmer than the 20th century. Steve McIntyre examined the response of AGW supporters, including a quotation from NOAA that says,
In summary, the mid-Holocene, roughly 6,000 years ago, was generally warmer than today, but only in summer and only in the northern hemisphere.
Timing of Events
The issue involved here is classic and essential to proper understanding of climate. It involved a standard practice in climatology called Relative Homogeneity. If you are going to establish a pattern of climate change, you must determine if it is local, regional, hemispheric or global. It addresses the very definition of climatology, which is the study of climate in a region or the change over time.
I dealt with the issue while preparing for my doctoral thesis that involved reconstructing climate change at Churchill, Manitoba, on Hudson Bay for the period from 1714 – 1850. My supervisor, Dr. Bruce Atkinson, directed me to reconstruct climate changes at York Factory, also on Hudson Bay, but 200 km away. The comparison identified local changes at Churchill while examination of regional, hemispheric and global changes provided a wider context.
Two major assumptions complicate determination of the length and extent of the change. First is that an event, such as the MWP, begins and ends at the same time. Second is that changes created by an external forcing is evident in all records. I discussed both issues at length with Hubert Lamb because my thesis period covered the transition from the LIA to the modern warm period. Lamb did not use the term Medieval Warm Period (MWP) and Jean Grove attributes the Little Ice Age (LIA) name to Mathes (1939), but Lamb gave much thought to the dates of onset and termination of both. In Volume 2 of his Climatic History and the Future: Climate Present, Past and Future he used the transitional terms of “the medieval warm epoch or Little Climatic Optimum.” This was the distinction between epochs and events, like that used with magnetic reversals. At that time the Holocene Optimum was called the Climatic Optimum, so the MWP was the Little Climatic Optimum.
Lamb pointed out that, even though an event was global, the dates of onset, peak, and termination varied considerably depending on different conditions at all levels from local to regional to hemispheric. He also indicated that the difference in dates could vary by decades. You can look at a single station or even a few in a region for a particular time and not find evidence of a trend like the MWP or the LIA. As Lamb wrote
“Evidence already cited at various places in this volume suggests that for a few centuries in the Middle Ages the climate in most parts of the world regained something approaching the warmth of the warmest postglacial times. The climax of the warm epoch was not quite contemporaneous everywhere …” “in the heartland of North America, as in European Russia and Greenland, the warmest times may be placed between A.D. 950 and 1200. In most of Europe, the warmest period seems to have been between 1150 and about 1300 though with notable warmth also in the later 900s.”
The original IPCC FAR Figure 7c (Figure 1) indicates in the legend that
“The dotted line nominally represents conditions near the beginning of the twentieth century.”
Presumably somebody added the line and in doing so provided a general range for the MWP and the LIA. By eyeball the MWP covers A.D. 950 to 1350, and the LIA from A.D. 1350 to 1900. This does not match with the numbers in the text, particularly for the LIA with numbers attributed to Grove of 150 to 450 years ago or A.D. 1540 to 1840. There are a few interesting comments that needed correction for the politically motivated 2001 IPCC Report. In referring to the MWP, they note,
This period of widespread warmth is notable in that there is no evidence that it was accompanied by an increase of greenhouse gases.
Discussing the various explanations for the LIA cooling they wrote;
Some have argued that an increase in explosive volcanism was responsible for the coolness (for example Hammer, 1977, Porter, 1986), others claim a connection between glacier advances and reductions in solar activity (Wigley and Kelly, 1989) such as the Maunder and Sporer solar activity minima (Eddy, 1976), but see also Pittock (1983).
Note that these are the same arguments made for the current “hiatus” in temperatures. Also, notice the name of Tom Wigley, former Director of the CRU and a central figure in the 2001 IPCC, attributing the cooling to solar activity. The actual reference given is:
Wigley, T M L , and PM Kelly, 1989 Holocene climatic change, 14C wiggles and variations in solar irradiance Phil. Trans. Royal Society London, (in press).
Apparently, the article listed as “(in press)” never appeared because Wigley’s publication list at the CRU doesn’t list it.
On page 203 of the IPCC Report they observe,
Thus some of the global warming since 1850 could be a recovery from the Little Ice Age rather than a direct result of human activities So it is important to recognise that natural variations of climate are appreciable and will modulate any future changes induced by man.
All these points confronted and contradicted the political agenda of blaming human CO2 for global warming and latterly climate change. Refutation began in the 1995 Second Assessment Report (SAR) and hit full stride with the 2001 Third Assessment Report (TAR) and its central feature, the “Hockey Stick”. Accurate determination of the onset and termination dates for the MWP and LIA, the relative homogeneity, was essential to identifying the underlying mechanisms. The Hockey Stick ‘solved’ the problem by eliminating the events completely and tacking on a modern blade with an error factor that made the numbers meaningless.
Welcome to IPCC climate science.
Off topic, sorry but I think it is important PMSML.org is now offline. I can still find global data up to 2012 on wayback http://web.archive.org/web/20140704001934/http://www.psmsl.org/data/obtaining/ How long will that last?
Now it’s back again. http://www.psmsl.org/data/obtaining/ Thanks AND Please take all individual country DATA before it’s gone 4ever?
Dr. Ball’s article is spot on as usual. The real problem we face is the political agenda supported by the corruption of the scientific method (as elucidated by Dr. Ball).
These are powerful forces. How can they be defeated? I supposed over time, the scientific community will have to just keep presenting the truth over totalitarian elitist objectives.
Like Islamofascim, the Western World will have to wake up and face the facts if it’s to confront the evil and corruption. It’s our only hope. I hope it’s not too late…….
For all you true scientists, thank you for your great works; most especially Dr. Tim Ball.
Interesting article. The extent of the LIA and the extent of the MWP have been hotly contested for decades with Lamb and Groves being foremost in determining their length, depth and spread.
A few weeks ago I re-examined the material I had researched in connection with my own reconstruction of CET, said to be a reasonable proxy for at least the NH. I am currently back to 1540 and am compiling research material in order to try to determine the likely start of the LIA-said by Mann to be around 1256 and caused by Volcanoes-and thence further back to 1086 in order to take in the MWP.
There is no doubt the LIA is misnamed, as noted by Groves and Mathes. It was a very intermittent period of rapid climate changes with periods of intense cold punctuated by periods around as warm as the present era. That parts of the LIA could be around as warm as today surprised me and it will be interesting to see what temperatures will be recorded during the MWP. Here is my recent article;
http://judithcurry.com/2015/02/19/the-intermittent-little-ice-age/
As Tim Ball notes, the curious thing about all this is that, according to Lamb, temperatures have been rising since 1700 AD and the graphs in my article clearly show this. There was a very considerable burst of warmth from 1700 to 1740 which surprised Phil Jones who wrote a paper in 2006 on that era in which he confirmed that Natural variability was greater than he had hitherto realised.
The period from 1920 to 1950 stood out as being the ‘least cold’ with the last couple of decades also being noticeable for their warmth and appearing to be similar to the 1530 to 1550 period (this still to be confirmed)
It is good to look back as far as possible as it helps to put the modern era into context. It appears that GISS from 1880 is merely a staging post for growing warmth and not the starting post.
It would be interesting to see any research that explains the reasons for the warming since 1700 and also the causes of the intermittency that can be perceived.
It is good that Tim Ball ensures that past climates are continually examined and questions asked.
tonyb
IMO the rapid and large warm cycle in the early 18th century was primarily the rebound from the Maunder Minimum. In this view, the LIA is the story of three (or four, depending on start date) solar minima, with recoveries in between them. The same is probably true for prior cold spells during the Holocene and prior interglacials.
Spörer Minimum 1460 1550
Maunder Minimum 1645 1715
Dalton Minimum 1790 1820
…and then convince everyone the LIA ended in 1870 and that was the perfect temperature
If latest fashion of last 10 million years is a Ice Box climate with majority of the time being glacial period, the meaning of perfect, than LIA is step in the right direction of what one could call perfect temperature.
But the actual temperature of Earth is it’s oceans, warmer ocean higher sea levels, and oceans continue to warm and continue to rise, and LIA was just a dip in overall warming of the oceans and rising of sea level. And centuries into the future, the oceans will stop warming and sea level will stop rising and we fall back into the glacial period. So if perfect temperature is the peak, then we are slowly heading towards perfect temperatures.
Ref: Warmist claim “In summary, the mid-Holocene, roughly 6,000 years ago, was generally warmer than today, but only in summer and only in the northern hemisphere.” Yeah shure my leg. Are they not saying that during ice age that it was generally cooler in summer and only in the nothern hemisphere?
Is Marcott ’13 still the best data on the Holocene? If so, the height of the Holocene was similar to today or a little lower.
Marcott never was any good. Do an archive search here, you will understand why their conclusions are NFG.
The MWP and prior warming episodes were all warmer than now. The Holocene is gradually cooling, as we see here from Alley’s data:
http://jonova.s3.amazonaws.com/graphs/lappi/gisp-last-10000-new.png
On this occasion I must agree with Mr. Stealey. I expected the Marcott paper to be withdrawn by now, perhaps it has.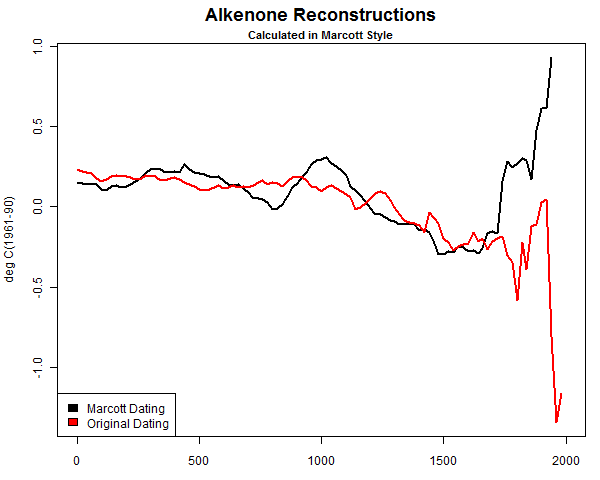
Like the infamous hockey stick graph of Michael Mann, the paper has been extensively debunked to the extent that neutral observers may conclude that they were fraudulent.
http://rogerpielkejr.blogspot.co.uk/2013/03/fixing-marcott-mess-in-climate-science.html
http://climateaudit.org/2013/04/02/april-fools-day-for-marcott-et-al/
Marcott, Shakun, Clark and Mix did not use the published dates for ocean cores, instead substituting their own dates
http://climateaudit.org/2013/03/16/the-marcott-shakun-dating-service/
As result iof the above |Climate Audit Review, the leading authors were forced to issue the following statement….
I think the problem is that ‘Climate Change’ has become a billion dollar industry such that the scientific method goes out of the window in the rush to grab government funding.
Mike Borgelt,
If you want a reply you will have to use my screen name. I search using that. Otherwise, it’s just by chance that I see subsequent comments.
Re: Marcott, as I suggested, do a WUWT search. There is extensive commentary deconstructing their paper, and we don’t limit our discussions here to only peer eviewed papers. Peer review [or in the case of climate, Pal review], is merely a gatekeeper, nothing more. It does not confer validity or scientific veracity. The way to get at the truth is by lots of discussion. That way the grain of truth of can be separated from the chaff of pseudoscience.
As for the ice core data, it is necessarily limited to locations where there is deep, old ice. Greenland is one such place; Antarctica is another. If there is a dispute in the matter, I suggest you take it up with R.B. Alley, whose data provided for the chart above.
I also have many similar charts from both hemispheres and from different sources, showing the same thing: the MWP and previous warming episodes were warmer than now. I’ll post them at anyone’s request.
As Mike Borgelt (Mar 22 10:41 am) points out,Greenland is not a very good proxy for the entire surface of the earth. It would clearly be better to find a tree in Siberia that reacts to, and is therefore a reliable guide to, the entire global climate.
“Unfortunately the postings on WUWT have little impact on what Marcott has published. ”
yes this is the difference between a skeptic like Nic Lewis who actually publishes versus comments on blogs.
The other odd notion people have is that one does science by merely criticizing.
[much like you do with your cryptic and sometimes irrationally formulated drive-by comments – Anthony]
Mike Jonas,
Yes, I nominate Briffa’s YAD061:
☺
MikeB “I expected the Marcott paper to be withdrawn by now, perhaps it has.”
Nope. Still going strong, has more than 30 citations, not bad for a two year old paper.
No scientific concerns with the paper, actually.
Jimbo “Do they grow figs out in the open in Germany today?”
Yes.
Steven Mosher March 22, 2015 at 1:54 pm
”The other odd notion people have is that one does science by merely criticizing.”
No, science is a method. The mistake you make is believing publication in a pal revised journal is part of that method. It’s not. That’s just part of academic bureaucracy, not the scientific method.
Part of the scientific method is repeatable empirical experiments, just like this one –
http://oi61.tinypic.com/or5rv9.jpg
– which shows the foundation claim of the warmulonians to be junk science. (it’s not surface at 255K being warmed 33K by our radiatively cooled atmosphere, it’s surface at 312K being cooled 24K by our radiatively cooled atmosphere.
It doesn’t matter that they are published on the web, only that the results are repeatable and right. In fact I believe it is vital that the correct answer “global warming due to CO2 is a physical impossibility” exists in the instantly accessible and permanent public domain of the Internet for years before it is ever admitted in the discredited journals. When it comes to AGW there can never be too much shame for the fellow travellers.
Has the Earth’s temperature passed that of a blue giant star yet, or do we have to wait a couple of years more ?
http://www.zeeburgnieuws.nl/nieuws/images2/carbon_pollution_marcott_plus_projection_climateprogress_1080.jpg
(Another wasted effort by a banned sockpuppet. Comment DELETED. -mod)
Next time someone tells me the climate models are pretty accurate I will point them to this and let them decide. ;-p Ho, ho.
MW – here is an article on a find that showed that the settlers grew [barley] (would you stay if you couldn’t make beer?). http://sciencenordic.com/vikings-grew-barley-greenland
It should grow now but the growing season would be too short for the seeds to ripen for the next season.
[The mods suspect that, as the weather grew colder, they were barely able to even grow barley while barely escaping the bears ….mod]
Your point is obscure and I would appreciate your take on the cited paper, but I suspect albedo feedback is substantial and still largely unknown. Might it vary under changing climate conditions by plus or minus 10%? I think that is possible.
k.kilty
Why do you expect that big a change from albedo feedback?
Cheers, mod. I’m a keyboard dyslexic. I should proof read before hitting the PC button (just typed “hte”) and check that I’m replying in the right spot.
[Proofreading, then taking a breath, and checking for any second-thoughts (intuition, guardian angles, nagging “I would never say that in front of my mother” thoughts, or pre-cognition-before-cautions) before posting, are all strongly recommended. But never mandated. Remember, those who did not listen to their second-thoughts about unseen dangers (or their ESP senses – if you are of that ilk) never survived to breed children in years past. .mod]
Do they grow figs out in the open in Germany today? Is timing everything?
UK TV often has a series in which people of he present generation try to live the agricultural lifestyle of previous generations , eg the Tudor farm , the Victorian farm etc. How about a series in which academics or farmers of Danish or Norwegian extraction return to the sites in Greenland occupied by the original settlers and see if they can survive as we know the original settlements did for several hundred years . We are constantly told that the Arctic is at least as warm as in 1000-1200 AD , so maintaining a mixed beef/dairy and oats /barley/hay farm should not be a problem .
I wonder how many AGW protagonists would accept the challenge? Of course they would have to fend off any dangerous wildlife with knives and spears , gunpowder not having been invented (in the West ) in 1000AD , but since there is so little of it according to peer-reviewed accounts the danger should be minimal.
I wonder if the BBC would fund it?
Sorry, I meant whether olive trees grow out in the open in Germany today? Here is the abstract from Michael Mann again.
Wasn’t Mikes tree ring data only from the Northern latitudes? This has been used all over the place to prove the entire world is warming up. At the same time Mike and company say that the MWP doesn’t
count because it was not global. The other thing I don’t get is why there is not a difference between the
northern and southern world temperatures as CO2 is not uniformly present all around the world.
“If you are going to establish a pattern of climate change, you must determine if it is local, regional, hemispheric or global. It addresses the very definition of climatology, which is the study of climate in a region or the change over time.”
I think this is the heart of the problem. Measuring regional affects and homogenizing globally doesn’t work. It just erases data.
It is warmer now in Greenland than during the MWP. That Alley graph posted by dbstealey is misleading as it claims that the present is the year 2000 when in fact it is the1850’s! Well before the modern warming!
http://s11.postimg.org/uf5yojk4j/gisp2.jpg
Well, Martin, your chart shows the same thing: prior warming episodes were warmer than modern warming. As to the point I made: the Holocene has been steadily and gradually cooling. Naturally, I might add.
The current warming cycle is indistinguishable from previous natural warming cycles. The climate Null Hypothesis has never been falsified. Therefore, the default position for any honest scientific skeptic is that the current [very *mild*] warming cycle is natural, not man-made.
The onus is entirely on those who promote the man-made global warming [MMGW] narrative, not on skeptics, who have nothing to prove.
Martin, here is Greenland before the 1950 IPCC start of discernible human influence. Ice, ice baby.
Martin – extreme care is needed with the graph you posted. The temperatures of the last few years are not from the same source, are are not of the same ‘granularity’. They can therefore show short-term temperature changes that are not available in ice core data. That means that a temperature spike like that of the last few years would likely not show up in the ice core record – not until it had been of much longer duration – and it would also show a lower peak.
Martin,
It has been pointed out to you that the chart you posted is an amalgam of ice core records with a different, presumably instrumental record tacked on. That was not made clear in your comment or in the chart, nor was it disclosed how you arrived at the “2010 –> +” notation.
I recognize that chart as one by Prof Ole Humlum. He produced the original. But it has been diddled with, in order to show extreme warming. That much warming has not happened, so I don’t think that fabrication to Dr. Humlum’s original chart is accurate.
Further, the entire MMGW debate revolves around the 0.7ºC rise in global T over the past century or so. That chart shows more than 1.5ºC of warming.
Where did you find that misinformation? It looks to be alarmist propaganda, because it overstates warming by more than double.
Hey Martin (12:08 pm).
Recent Greenland temperatures have barely reached the levels of the late ‘30s before human CO2 emissions were a factor — why doesn’t your SkS derived graph show that?
http://appinsys.com/globalwarming/RS_Greenland_files/image023.gif
“The climate Null Hypothesis has never been falsified. Therefore, the default position for any honest scientific skeptic is that the current [very *mild*] warming cycle is natural, not man-made.”
there is no falsifiable “climate null hypothesis” to reject.
Steven Mosher says:
there is no falsifiable “climate null hypothesis” to reject.
Of course there is. If current climate parameters begin to exceed past parameters, the null hypothesis is falsified. That has not happened.
Steven Mosher March 22, 2015 at 5:27 pm
”there is no falsifiable “climate null hypothesis” to reject.”
The null hypothesis is simple “Adding radiative gases to the atmosphere will not reduce the atmosphere’s radiative cooling ability, nor its ability to cool the solar heated surface.”
The null hypothesis stands.
No amount of flappy hands claiming natural warming to be due to CO2 can ever disprove the null hypothesis. For that you would need a repeatable lab experiment showing that incident LWIR can slow the cooling rate of water free to evaporatively cool. And that you can never do.
Martin, is that another modern thermometer graphed onto a proxy ice core where anything less then 100 hundred year data is whipped smooth?
The 8th century in Europe was likely warmer than recently, at the same time that it was much colder in Greenland. While during the Dark Ages cold period during in the 4-6th centuries, it was warmer in Greenland. The most obvious point in the GISP proxy that is completely opposed to mid latitude temperatures is around 1200 BC, the Minoan Warp Period, such a fiercely cold period that it finished off the Minoans as well as collapsing much of Mediterranean and Neolithic culture. So I would suggest that there would have had to been a sharp downturn in regional mid latitude temperatures around 1000 AD if Greenland was warmer then:
Note Europe in the 7th century:
http://www.nature.com/ngeo/journal/v6/n5/images_article/ngeo1797-f2.jpg
Typo.. 8th century in Europe.
Also note in my first graph link above, the deep cold events in the 1100’s. Michael of Syria writes of several times that the Euphrates froze in the 1120/30’s and 1170’s.
Where did Martin get a graph that shows a lot of warming between 2000 and 2015? The chart immediately above says 2010 is 0.5 degrees warmer than 2000. Either the 2010 figure is in error, or the Greenland ice core doesn’t represent the global temperature. Not even close.
Medieval Warm Period in Antarctica! It’s worse than I thought!
For those interested here is Co2 Science’s dedicated section to the Medieval Warm Period studies from all continents and oceans.
http://www.co2science.org/data/mwp/mwpp.php
And here is an interactive map of the Medieval Warm Period.
http://www.co2science.org/data/timemap/mwpmap.html
As warmists ramp up the alarm, I become more and more relaxed about overheating. They lost me a long time ago. I used to be a warmist until I woke up to the trickery of climastrology. If they were accountants they would be in the State Penn – if you know what I mean. :-p
Another wonderful essay Dr. Ball. Best read of the week for me.
Considering all that you wrote (and many other items to boot), I wonder why this site will send a post to moderation for using the word “fraud*lent”. That word is so utterly descriptive of the “team’s” actions.
Oh heck, I put the star in the wrong place. Darn, got moderated anyway.
Yeah, but unlike many of the alarm sites – you got through moderation.
You could say they were just doing their job. From the IPCC website (‘History’):
Sorry, I forgot to mention the bold in the above quote was of my doing.
Perhaps another point to highlight ..
so, ” to understanding the scientific basis of risk of human-induced climate change,” as opposed to… ” to understanding IF THEIR IS A scientific basis of HARM OR BENEFITS of human-induced climate change,”
Yes, it s clear how and why the IPCC ignore many of the benefits of anthropogenic CO2, and ignore many of the observed real world peer reviewed reports (documented in the NIPCC) showing the IPCC projected harms are unlikely to manifest, even in a plus 2C world.
David, this is not entirely correct. As shown in the 4th Report of the Working Group I (http://www.ipcc.ch/publications_and_data/ar4/wg1/en/faq-2-1-figure-1.html) the concentrations of CO2, NH4, and N2O were nearly constant for the past 2000 years, with exception of the time after 1850 or so. This means that during the MWP and the LIA the concentrations were nearly constant. Thus, in the sense of the AGW apostles it was indispensable to remove the MWP and the LIA. Otherwise, it would be necessary to explain why we had had two phases of notable climate variability, namely the MWP and the LIA, but the concentrations of the so-called greenhouse gases were constant.
The 2-degrees goal has its origin in a IIASA working paper written by William Nordhaus in 1975. He is an economist with Yale University. The project Energy Systems of the IIASA was the center of the anti-CO2 propaganda. This project was directed by Wolf Haefele, the father of the German fast breeder reactor. In Europe, the fear of the public regarding the use of nuclear energy was horrible. The nuclear power plant Zwentendorf in Austria, for instance, was built, but never operated because of a referendum.
According to the Haefele-Manne model from 1975 most of the conventional power plants should be substituted by nuclear power plants. Thus, Haefele and collaborators distributed the story about the anthropogenic effect on climate change due to the increase of greenhouse gases to relativize the public opinion regarding the use of nuclear energy. It has been reported by witnesses that Haefele claimed in 2004 that he has generated the CO2 fear in the brain of the Green Party of Germany (He said in German: “Ich habe den Gruenen das CO2 ins Gehirn gesch……”).
Even today, the German nuclear energy lobby claims that nuclear energy may help to protect climate (see http://www.kernenergie.de/kernenergie/themen/klimaschutz/index.php).
When seaching for the reason the Gamay grape made wine became a threath to the pinon noir grape made wine in Burgundy in the fourteenth centuryI found this below. About the Southern Atmosphere we have not much historical data from the same period. SO any claim is valid?
European famines of the (Late) Middle Ages
•Famines were a familiar occurrence in Medieval Europe. In France during the fourteenth century alone, famines occurred in 1304, 1305, 1310, 1315–1317 (the Great Famine), 1330–1334, 1349–1351, 1358–1360, 1371, 1374–1375 and 1390. In England, famine-years included 1315–1317, 1321, 1351, and 1369.
•For most people there was often not enough to eat and life expectancy was relatively short since many children died. According to records of the royal family of the Kingdom of England, among the best cared for in society, the average life expectancy in 1276 was 35.28 years. Between 1301 and 1325 during the Great Famine it was 29.84, while between 1348 and 1375, during the Black Death and subsequent plagues, it went down to only 17.33.
•1250 for when Atlantic pack ice began to grow
•1275 to 1300 based on radiocarbon dating of plants killed by glaciation
•1300 for when warm summers stopped being dependable in Northern Europe
•1315 for the rains and Great Famine of 1315–1317
“lent” survives to this day, a time to conserve the last food of winter.
And in the spring, my grandmother still ate mainly stuff canned in glass and tin, she said “it just felt good”. The Finn’s had their pasties made of lard and potatoes and the Swedes had their fish stored in lye.
I think seasonal shortage of food and famine was common in the Western world before the 1900’s. I was a lot due to the fact that people got their food from the local area and locally the weather can vary, actually quite a bit.
But the Black Death and disease, that was mainly bad sanitation and partially no antibiotics.
“The Finn’s had their pasties made of lard and potatoes…”
————
The Finns wore pasties made of lard and potatoes?
A combination bold fashion statement and interesting snack!
Sounds titillating.
On the 2,000 year JG/U tree ring study the years from around 1235 to 1400 are on the whole below average. Right around 1230 there is a rapid medium drop in temps. Then there is a span of 165 years where it can be seen that this was the longest low period in the entire 2,000 years of the study. There are 4 medium drops in that time span at, 1236 1315/16 1336 1350 approximately. There are very few groups of years that rise above the average trend line on the graph during that 165 year period, nor do they rise far above that trend line. That was the heart of the cold period. Afterwards the Maunder shows up as being deeper, but it was short lived by comparison to the earlier period…http://www.sciencedaily.com/releases/2012/07/120709092606.htm
A similar picture here:
And further evidence of cold conditions in Europe from around 1200 AD:
http://wattsupwiththat.com/2013/08/23/the-medieval-warm-period-in-the-arctic/#comment-1398577
https://wattsupwiththat.files.wordpress.com/2011/09/weather1.pdf
Warmunist, malthusian, totalitarian government enthusiast, and current “science tsar” John Holdren is a perfect match for the obama junta.
So heartwarming to see this ancient, discredited and almost forgotten graph (Figure 1) once again resurrected and dusted off for exhibition 🙂
That graph was published by the IPCC. Explain why you believe it is ‘discredited’.
I suspect the reason is because it does not fit your confirmation bias.
the chart was included by mistake. see the climategate mails
Which particular emails? I’d be interested.
http://www.ecowho.com/foia.php?search=Lamb
This link will allow you to view much of the grubby behaviour on of the “Hockey Team” trying to discredit Lamb and discourage anyone from referencing his work.
Including of course this little gem –
That graph was indeed presented in the 1990 IPCC report (Fig 7.1c not 7C), but was clearly referred to as a schematic and no numerical values indicated on the temperature axis, it also ended in ~1950.
No direct source was given for the graph although subsequent investigation shows it to to be a plot of the CET due to Lamb. There have been multiple ‘versions’ of this graph which have been discredited due to the additions and annotations which have been added without any justification.
The version used by Ball above is not the version used in the IPCC report as indicated by the incorrect figure number and legend.
Here is NH NASA 1981 compared to 1999. It does not go back as far, but is indicative. Much of the work at CO2 science supports a MWP. The changes have continued since.
David A
See more files supporting a worldwide MWP at http://www.co2science.org
And, for the Medival Warm Period in particular, see http://www.co2science.org/subject/m/subject_m.php
Phil,
Although you are correct about the typo for the figure number, if you follow the link that Dr. Ball has given to the IPCC report, you will see that the graph he shows is a true representation of the original, apart from a change to type font.
The IPCC graph also appears to go up to year 2000 (see page 202)
http://ipcc.ch/ipccreports/far/wg_I/ipcc_far_wg_I_chapter_07.pdf
So I think it is a little unfair to suggest or imply that he has misrepresented the graph.
Thanks RA. My point was to Moser’s assertion, that the IPCC chart was “accidental”, when the fact is that many graphics from the time show a similar “accidental” trend.
It was indeed “accidental” from the IPCC perspective, as it did not fit their agenda. The “Hockey Stick” overturned the standard version of the past without so much as a “how do you do” to the past. A deeply flawed study by Mann, without even the curtsey of acknowledging the accepted “consensus” at the time contrary studies. set an entire new paradigm, simply through political post normal agenda! (It could be called a lot of things, but science is not one of them.)
A less political look backwards, such as the CO2 science report, supports the MWP. When they eliminated the MWP, they also eliminated the 1940s warmth as well as much of the decline to 1979.
However they got into a bit of a bind. The Mannian flat T trend, before the 1978 to 1998 increase, did not allow adequate ability for other factors to explain the pause, or the past. Slowly, using more discredited proxies studies, they brought a little bump to the MWP back, giving room for natural causes to explain the pause. Should the AMO turn negative, and a strong La Nina manifest, that too will be wholly inadequate, and the particulate excuse, will likewise completely collapse.
MikeB March 23, 2015 at 2:44 am
Phil,
Although you are correct about the typo for the figure number, if you follow the link that Dr. Ball has given to the IPCC report, you will see that the graph he shows is a true representation of the original, apart from a change to type font.
The IPCC graph also appears to go up to year 2000 (see page 202)
http://ipcc.ch/ipccreports/far/wg_I/ipcc_far_wg_I_chapter_07.pdf
So I think it is a little unfair to suggest or imply that he has misrepresented the graph.
I did not say that this version was discredited, only that it was not the original, many versions are misrepresentations though. The graph does not go up to 2000 and it is a local graph (CET) not global.
Konrad cant even find it.
‘That darned diagram’ would be a good clue.
Clue number 1. Who wrote the Paleo chapter? you could search on ‘Dork’ cause that is what they called him.
did any of you clowns read the mails?
Clue number 2. The history of this was something they wanted to keep buried.
“A lot of this history is likely best left buried, but I hope to summarise
enough to avoid all the skeptics wanting copies of these
non-mainstream papers. Finding them in CRU may be difficult!”
basically they wanted to protect Lamb.
“Basically they wanted to protect Lamb”
Just give up Steven, it’s never going to work. There is only one email using tat as an excuse for hiding their sleazy team effort in an “obscure journal”.
Lamb didn’t believe their CO2 tripe and he was right. The actions of the “Team” will be seen in this light. History is not written by the losers and AGW believers are the losers in the climate debate.
Konrad March 24, 2015 at 12:30 am
Lamb didn’t believe their CO2 tripe and he was right. The actions of the “Team” will be seen in this light. History is not written by the losers and AGW believers are the losers in the climate debate.Rather strange then that he would write in the preface to his book on ‘Climatic History and the Future’
“Recent research……has rendered more specific the expectation that the
beginnings of the next glaciation will be upon our descendants within 3000
to 7000 years. It is to be noted here that there is no necessary contradiction
between forecast expectations of (a) some renewed (or continuation of) slight
cooling of world climate for a few decades to come, e.g., from volcanic or
solar activity variations; (b) an abrupt warming due to the effect of increasing
carbon dioxide, lasting some centuries until fossil fuels are exhausted and a
while thereafter; and this followed in turn by (c) a glaciation lasting (like
the previous ones) for many thousands of years.”
Village Idiot & Phil, How disappointing that Tim B used this FAR graph. And he even quote Lamb by authority in contradiction. It does worry me the vitriol thrown from the skeptic camp when ever I say, as I do now…
Smash this idol!
https://enthusiasmscepticismscience.wordpress.com/2013/09/09/millennium-idols-smash-the-hockey-stick-but-smash-the-others-too/
Where’s Flashbag on this? Maybe he’ll whip out some of his Dark Money Demagoguery and accuse the Evil Koch Brothers of funding Dr. Ball’s education.
By the way, Flashbag, that’s called an Ad Hominem. FYI it’s not scientific to critique the finding by questioning the funding.
Let’s see if you or any of your fellow travelers/lurkers can make a real argument.
The evil Koch Brothers fund a lot of people’s education.
http://kochfamilyfoundations.org/FoundationsDHK.asp
That explains all the misbelief!
It’s possible we could enter a new LIA, and not notice it because our technology allows us to easily cope. Can you imagine the last two winters in the central/eastern U.S. without modern technology? We’d have seen failed crops, starvation, pestilence, and thousands of people freezing to death. Instead, we bitch and moan, but mostly shrug it off. Maybe we’ve already entered a new LIA.
Your comment regarding our improved capability to cope with change is a good point. I think that we are in the very beginning of the cold trend. Will it reach LIA levels? That is hard to say. We will not have to wait too many more years though, before nature will bring more clarity to the thought.
Good thing they didn’t have thermometers 1000 years ago, else we peasants would have been burned at the stake for sorcery and witchcraft as temperatures went up.
The wealthy always blame the problems of the world on the poor. If the poor would just accept their lot in life and quit struggling to change things, the world would be such a nicer place for the rich.
Climate change is no different. It is us poor folks driving around in cars, using air-conditioning, messing things up for the rich folks running the planet that are the problem.
Africa – stay in yo’ place:
http://www.examiner.com/article/obama-planet-will-boil-over-if-africans-have-air-conditioning-cars
Cooling by air con in a car takes about the same amount of extra energy as driving with the windows open. The citation for that calculation is the USA and the time was early ’70’s.
There was a comma after “air-conditioning”, but yep, smacks of elitism.
Any “political corruption” cited is solely about taking advantage of a “crisis” in order to make some form of change. In the case of “tax and spend” politicioans it has been the rollback of taxation that followed Thatcher and Reagan that needs to be overcome in order to pursue the direction they want. What better crisis than climate change that will reduce us all if not stopped, and how better to counter it than by a “carbon tax” enterered into for the “good” of the planet? Long live political expediency.
Let me start by saying all data sources do NOT support the made up absurd Hockey Stick. That is fabricated junk to try to give AGW theory some validity which it does not have when faced with the reality of the real data.
What fits the global temperature trend data the best since the Holocene Optimum- Present is what I suggest below. To get a more refined fit of the temperature trend during this time period the phase of ENSO,AMO,PDO along with VOLCANIC ACTIVITY have to be further superimposed upon what I suggest drives the climate in the larger picture , those being Milankovitch Cycles with Solar Variability superimposed upon it.
My thoughts on what drives the climate conform to what the data shows(present/past), unlike AGW theory which totally ignores the data both present and past.
AGW theory wants the data to conform to what it suggest, not the other way around.
More data which shows since the Holocene Optimum from around 8000BC , through the present day Modern Warm Period( which ended in 1998) the temperature trend throughout this time in the Holocene, has been in a slow gradual down trend(despite an overall increase in CO2, my first chart ), punctuated with periods of warmth. Each successive warm period being a little less warm then the one proceeding it.
My reasoning for the data showing this gradual cooling trend during the Holocene ,is Milankovitch Cycles were highly favorable for warming 10000 years ago or 8000 BC, and have since been in a cooling cycle. Superimposed on this gradual cooling cycle has been solar variability which has worked sometimes in concert and sometimes in opposition to the overall gradual cooling trend , Milankovitch Cycles have been promoting.
Then again this is only data which AGW enthusiast ignore if it does not fit into their scheme of things.
http://www.murdoconline.net/wordpress/wp-content/uploads/2011/01/gisp2-ice-core-temperatures.jpg
The above graph stops at the 1850’s. It is not the year 2000. This graph shows how much warmer it is in 2010 at the site in Greenland where the ice core was from.
http://s11.postimg.org/uf5yojk4j/gisp2.jpg
I really really hope this is the truth? Because this is really really good News to me!!!
I Am living in the Late Holocene antroproghenic experienced optimum?
Why do we still have glaciers in norway?
You scale is different too….both show the same decrease…and both show the same spike around the 8000 mark
….which shows it’s normal
Martin,
Guess what!
The Greenland Ice Sheet is not melting!
Another obvious feature on that graph is that the current warming is not exceptional. If the adjusted temp portion was removed, then it would be as ordinary as the average movements on the graph
You can’t use ice core data to claim a certain time period was the hottest or coldest ever.
The x-axis says “Years before present (2000AD)” . The little bit in red at the end is the temperature record from the last century and a half! It doesn’t stop in 1850.
Martin, is the tacked on with circle from ice cores or from selected temperature data for the area?
Looks like Martin has skedaddled.
If I understand correctly you are extrapolating thermometer in a box five feet off the ground measurements onto cored ide data. You may be aware that 18O does not customarily skydive from five feet in the air to the surface to be included in ice bubbles and the specific reason temperatures are measured at five feet is to avoid the much colder (or in different circumstances hotter) temperatures down at the surface than human noses experience .
Your little 2010 marker is about -28.7 C to my eyechrometer. Brrr. Not meltin’ soon. Calibrating global anomaly to this is very suspect.
Jon sez:
I really really hope this is the truth? Because this is really really good News to me!!!
Agree w/you, Jon. I don’t necessarily accept that graph, but like you, that would be WONDERFUL news — currently avoiding the next glacial period.
Warmists must live, mentally, in opposite-world…
The graph you post has a 1.25 deg rise in temps since the 1850s in a linear fashion. This raises a few questions….
Where did the 1.25 deg rise come from? What data source?
The trend is linear since 1850. I’m assuming that was natural from 1850 to 1950. Why has the rise not accelerated in the post 1950 CO2 era?
This nonsense graph (that ‘Martin’ posted above as well) has been floating around the CAGW camp. It is their ‘piece de resistance’ to try to co-opt the GISP core. It just displays their total ignorance and dishonesty. No one knows where the instrument temp tacked onto the end of the graph comes from. Might be imaginary. Might be Kingston, Jamaica. Might be the hottest August daytime temperature ever recorded on Greenland. No one knows*. It in NO WAY represents a continuation of the trend of average temps displayed in the graph. The GISP data ends in 1850 because the firn and snow above the depth that date represents are not yet consolidated sufficiently to yield valid data.
* I saw a comment in a CAGW blog somewhere last year, where the commenter appears to have tacked on the end to the original Alley graph, which appeared unmodified in the post. So it’s possible that commenter was the originator. Sorry, I don’t remember where I saw that, but I found it from a link in a post here at WUWT. So probably an article about GISP or Greenland temps.
Thanks Michael. That is a valuable perspective. Exposing amateur graph-tacking has become a whack-a-mole sport.
After the end of the Little Ice Age (in the middle of 19th century, around 1850), global temperature started to rise, the main reason of this phenomenon being the decrease of the volcanic activities. But naval war interrupted a steady warming trend two times yet.
World War I ended with a severe “bang” in the late 1918.
There is nothing clearer than the beginning of a “big warming” that occurred concomitantly with the end of WWI, in November 1918.
World War II (1939 – 1941): In the autumn of 1939, the naval warfare ended within four war months which reversed the two decade warming trend and determined the cooling phenomenon which started with three extreme war winters in Northern Europe and which lasted four decades, until 1980.
What lead us to the 1980 moment and what happened after that is explained largely in the Booklet on Naval War changes Climate, which you can read here: http://1ocean-1climate.com/book.pdf.
“On the 4th of March the cold was gradually increasing and an incessant snow-storm filling the track up rapidly made the dragging of the Toboggans exceedingly laborious ……. When we got to the end of our day’s march the cold was so intense that the men could scarcely use their fingers to hew down the fire-wood, or to build huts, and it was dark before we could commence cooking; if sticking a bit of salt pork on the end of a twig and holding it in a fire could be so termed.
On the morning of the 5th the cold had greatly augmented and the thermometer once more fell to 27 degrees below zero, together with a gale, a north-wester in our teeth, which scarcely left us power to breathe ……”
http://www.warof1812.ca/march.htm
For comparison, the actual temperature in Canada. 03/23/2015.
http://oi60.tinypic.com/j97e9u.jpg
The reason for the warming in the 1910s was that the climate shift to warming occurred around 1916/17. That 30 year warming trend ended around 1946/47. The next 30 year cool leg goes to 1976/77, which is when the current warming trend began. That warming trend ended in 2006/07. Time will tell the rest of the story.
The shift to warming started in winter 1918/19 around the Fram Strait, shown by an extraordinary temperature jump at Svalbard http://www.seaclimate.com/i/image/images/buch/big/i_3.jpg
and had a profound impact on the entire Artic temperature statistic, http://www.seaclimate.com/i/image/images/buch/big/i_2.jpg
Even James Hansen calculated the start of the global cooling since 1940, which is primarily due to three extreme cold winters in Europe beginning 1939/40 only four months after WWII started. Here is a global winter temperature map for the first three war years. http://www.seaclimate.com/b/images/buch/big/B_3.png
smamarver,
I read that entire .pdf file. For me it was not convincing.
In the late 1940’s, numerous atomic bomb tests were conducted. These were followed by hydrogen bomb tests in the atmosphere and in the oceans. But there seems to be no indication in the record that either global warming or cooling was triggered.
Your link says that in WWI and WWII, ships, mines, and depth charges caused climate change. But nukes, including nuclear depth charges, were thousands of times more energetic. If human activity during WWI and WWII caused climate change, it seems we would have seen the same thing, and to a greater degree, following hundreds of hydrogen bomb tests.
As I said, it was not convincing. But my mind is open to new evidence.
The released energy by atomic devises since August 1945 had been primarily affecting the atmosphere, but the war at sea 1939-1945 used conventional explosives, which churned huge water masses around. Global temperature dropped since 1940 and as hydrogen bomb tests where later, a convincing answer is still missing: Why?
I never knew thermometers were so accurate back then.
I should have said, “accurate and precise.”
If the past was natural and no caused by Man then there is no reason to try and control Man now.
Man’s CO2 emissions is a puppet string.
http://c3headlines.typepad.com/.a/6a010536b58035970c01761761470e970c-pi
This is accurate . Martin your chart is not accurate since global temperatures have not risen since 1998 -present times.
http://c3headlines.typepad.com/.a/6a010536b58035970c017eea5c93d4970d-pi
What has to be remembered is the temperature trend for the globe since 1998 has not risen.
And it was higher (and lower) in the past…before anyone ever lit a lump of coal.
In addition to the hockey stick, the other pièce de résistance of the IPCC turd-machine is of course the national laboratory-produced GCM outputs, that is the CMIP3 of AR4 and CMIP5 of AR5 archived ensembles.
With the steady exposure of the hockey stick fabrications as Dr Ball describes so well here, the central pillar still standing for the IPCC (and the political effort behind it) are the failing model projections, the infamous “ensemble predictions” based on future carbon emission scenarios.
Bob Tisdale, and others across the internet continue to disassemble the GCMs and expose their many pseudoscience tunings and output failures.
Central to “saving” the models is the on-going fudging of the GISS, CRU, and NCDC temp datasets. The one thing we can be sure of now is that in the next 20 months the dataset fudging is going to get worse, not better, as the vainglorious climate priests make a final desperate attempt to save the models.
I admire your courage as a young up and comer in an academia dominated by government-funded GIGO. I hope there are more of your caliber, willing to risk career opportunities in defense of the honor truth, science and the once American Way.
My hat is off to you, although it’s already off, so I salute you!
Thanks to Dr Ball for his summation how this CAGW madness got a hold and how significant the ‘scientology’ of Mann, Jones et al was in getting its acceptance by mainstream media and left leaning politicians and commentators. I suspect Dr Ball article may enjoy some demand as a summing up of the ‘denier’ case when the green-left-west wakes up to itself.
Thanks, Dr. Ball.
Here is some more IPCC:
IPCC 2012, Special Report on Managing the Risks of Extreme Events and Disasters to Advance Climate Change Adaptation (SREX). Summary for Policymakers. (drafted 18 November 2011, published 29 March 2012)
Part D. Future Climate Extremes, Impacts, and Disaster Losses
“Projected changes in climate extremes under different emissions scenarios generally do not strongly diverge in the coming two to three decades, but these signals are relatively small compared to natural climate variability over this time frame. Even the sign of projected changes in some climate extremes over this time frame is uncertain.”
From IPCC SREX Summary for Policymakers (29 March 2012, pg. 9), at http://ipcc-wg2.gov/SREX/report/
BTW, maybe your “Two major assumptions complicate determination of the length and extent of the change. First is that an event, such as the MWP, begins and ends at the same time.” should be “Two major assumptions complicate determination of the length and extent of the change. First is that an event, such as the MWP, begins and ends [everywhere] at the same time.”
Here’s my answer to a blogger at Jennifer Marohasy’s blog about Jones’s response about the Med WP in his 2010 BBC interview—————-
Here’s Jones’s answer to question G about the MedWP and the lack of SH proxies for that period. Yet we have since had the PAGES 2K study that showed a warmer Antarctica ( than today) from 141 AD to 1250 AD or 1109 years. And 1250 fits exactly for the Med WP.
There is also a 30 year warming spike for 1671 to 1700 in the study. All NATURAL warming of course.
http://web.science.unsw.edu.au/~sjphipps/publications/pages_2k_consortium2013.pdf
And just to add to the above, Co2 Science has many PR studies that show a SH Med WP. Here’s a number for South America.
http://www.co2science.org/subject/s/southamericamwp.php So we can say that there is nothing unusual or unprecedented at all about the NATURAL warming from 1950.
Here’s question G and his answer.
G – There is a debate over whether the Medieval Warm Period (MWP) was global or not. If it were to be conclusively shown that it was a global phenomenon, would you accept that this would undermine the premise that mean surface atmospheric temperatures during the latter part of the 20th Century were unprecedented?
There is much debate over whether the Medieval Warm Period was global in extent or not. The MWP is most clearly expressed in parts of North America, the North Atlantic and Europe and parts of Asia. For it to be global in extent the MWP would need to be seen clearly in more records from the tropical regions and the Southern Hemisphere. There are very few paleoclimatic records for these latter two regions.
Of course, if the MWP was shown to be global in extent and as warm or warmer than today (based on an equivalent coverage over the NH and SH) then obviously the late-20th century warmth would not be unprecedented. On the other hand, if the MWP was global, but was less warm that today, then current warmth would be unprecedented.
We know from the instrumental temperature record that the two hemispheres do not always follow one another. We cannot, therefore, make the assumption that temperatures in the global average will be similar to those in the northern hemisphere.
“Neville
March 22, 2015 at 2:15 pm
On the other hand, if the MWP was global, but was less warm that today, then current warmth would be unprecedented.”
Not necessary “unprecedented”, just possibly warmer than the MWP, wouldn’t you say?
You’re quoting Phil Jones not me.
Ah, OK, sorry.
Point still stands, regardless of who said that unprecedented word.
Neville says:
…if the MWP was global, but was less warm that today, then current warmth would be unprecedented.
That is wrong. You are limiting your global warming argument to only the MWP. But as we know, the MWP wasn’t all that warm compared with prior warming events such as the Holocene Optimum and others.
Look at the chart below, and you will see at least twenty other “hockey stick” shapes indicating natural warming events:
http://i.snag.gy/BztF1.jpg
Some of those warming events caused global tempertatures to rise more than 3ºC, and those warming episodes happened before human CO2 emissions could have had any effect. IMHO that completely debunks the current MMGW scare. YMMV.
You’re quoting Phil Jones’s interview, not me.
Neville,
If that’s the case, my sincere apologies. It’s hard to tell when you don’t make some sort of distinction. I’d recommend either using italics, or quotation marks when quoting someone else.
This graph is more to the truth than the misleading one posted above with the supposed Mann hockey stick tacked on the end.
http://hot-topic.co.nz/wp-content/uploads/2011/01/GISP210klarge.png
spaatch,
Thank you for confirming that there were repeated instances of natural global warming events during the Holocene, prior to human CO2 emissions being a factor, and that those warming events were much greater than during the MWP.
That pretty much deconstructs the man-made global warming narrative, no?
However, I must point out that the chart you posted is fabricated, and dishonest. It tacks on an instrumental record that purports to show a recent ≈3.5º+ rise in global temperature over the past century and a half. But as we know, global temperatures have only risen about 0.7ºC in the current warming. So someone is diddling with the original chart again.
And once again: where are you folks getting your misinformation?
“Some of those warming events caused global tempertatures to rise more than 3ºC..”
You’ll make more sense of it if you invert it. ~1350-1150 BC was a largely global cold period, apart from Greenland of course.
“On the other hand, if the MWP was global, but was less warm that today, then current warmth would be unprecedented ….” (Neville 2:15 pm).
===============================
For pity’s sake, do you understand what the word “unprecedented” means?
It means never done or known before — never, ever.
Do you seriously believe that the Earth has never ever before been as warm as either during the MWP or now.
I’d just like to point out that the (crude ) graph at the head of this article originated from HH lamb (1965) based on a study of CET and some botanical evidence.
It is not a graph of ave global temp, just one of a very small part of the world that is now 50 years old.
Time and science has moved on.
http://en.wikipedia.org/wiki/Description_of_the_Medieval_Warm_Period_and_Little_Ice_Age_in_IPCC_reports#/media/File:Ipcc7.1-mann-moberg-manley.png
Toneb says:
Time and science has moved on.
The data is either true, or it’s not. Whether it’s 50 years old does not matter. Facts are facts.
The chart was debunked by Lambs own associates and then they hid the debunking in an obscure journal to save his pride.
Since this is news to me, can you post a verifiable link? Thanx.
“Debunked” was it Steven? No, every attempt to erase the history of the RWP, MWP and LIA has failed.
And any attempt to erase the disrespectful treatment of Hubert Lamb’s solid work by the “Hockey Team” will fail too. The Climategate emails are forever. Anyone can now search them for “Lamb” as see just what those scumbags did.
db:
climategate mails. do your own damn homework
Steven Mosher March 23, 2015 at 1:39 pm
”climategate mails. do your own damn homework”
Your problem Steven is sceptics actually do their home work. Some like me even design and run the empirical experiments. How much “homework” did Anthony and his hundreds of surface station volunteers do on documenting the micro-site conditions of all of Americas surface stations? More than the climastrologists ever attempted! Why is the climate reference network in existence? Sceptics doing their homework, that’s why. And that’s why you and yours can never win. You didn’t.
I too have done my homework. I did the empirical experiments you and yours avoided. I checked if incident LWIR could heat or slow the cooling rate of water free to evaporatively cool. It can’t. I checked if the oceans would freeze without DWLWIR. They won’t. I checked if the atmosphere would run colder without radiative gases. It wouldn’t.
Yes, your BEST effort failed, more time in the blender cannot unscramble the egg. But all is not lost Steven, you still get to be famous as “first sleeper at WUWT to snap” 😉
(Although my records show your snap occurred at AirVent in 2010, but close enough).
I love Mosher’s nonsense when he cannot provide the requested information. You do not need the climategate emails to locate the paper – Jones et al. (2009) as it can be found in the alarmist blog-o-sphere (e.g. Skeptical Science, Desmogblog). Nothing was attempted to be hidden to save anyone’s pride as The Holocene is a well known journal.
http://pubs.giss.nasa.gov/docs/2009/2009_Jones_etal_2.pdf
I find it telling that Mosher recommends a paper authored by Mann and Jones. I believe Mosher must attempt some form of bad speed reading because he constantly misconstrues information he allegedly read. Yet it always turns into some BS narrative.
look again
Maybe you should read the emails before mentioning them because Wigley does not even remember which paper it was and both papers appear to be worthless in supporting their argument as they were cited only two times each since they were published. If they were such devastating refutations of Lamb they would have brought them up many times already instead of attempting to write an entirely new paper.
http://di2.nu/foia/1168356704.txt
Sounds more like they attempted to “hide” the paper because they did not want Lamb refuting it or it was too weak to stand on its own. Typical alarmist playbook as they knew there was no way the journal would reject a comment on their paper from someone like Lamb.
Unlike a real scientist Mosher is always quick to accept hearsay as a valid argument.
0.7°C rise in temperatures since 1965? The BS is flowing thick and fast.