![CMIP5-90-models-global-Tsfc-vs-obs[1]](https://wattsupwiththat.files.wordpress.com/2013/10/cmip5-90-models-global-tsfc-vs-obs1.jpg?quality=83)
COLLEGE PARK, Md. — An analysis of changes to the climate that occur over several decades suggests that these changes are happening faster than historical levels and are starting to speed up. The Earth is now entering a period of changing climate that will likely be faster than what’s occurred naturally over the last thousand years, according to a new paper in Nature Climate Change, committing people to live through and adapt to a warming world.
In this study, interdisciplinary scientist Steve Smith and colleagues at the Department of Energy’s Pacific Northwest National Laboratory examined historical and projected changes over decades rather than centuries to determine the temperature trends that will be felt by humans alive today.
“We focused on changes over 40-year periods, which is similar to the lifetime of houses and human-built infrastructure such as buildings and roads,” said lead author Smith. “In the near term, we’re going to have to adapt to these changes.”
See CMIP run
Overall, the Earth is getting warmer due to increasing greenhouse gases in the atmosphere that trap heat. But the rise is not smooth — temperatures bob up and down. Although natural changes in temperature have long been studied, less well-understood is how quickly temperatures changed in the past and will change in the future over time scales relevant to society, such as over a person’s lifetime. A better grasp of how fast the climate might change could help decision-makers better prepare for its impacts.
To examine rates of change, Smith and colleagues at the Joint Global Change Research Institute, a collaboration between PNNL and the University of Maryland in College Park, turned to the Coupled Model Intercomparison Project. The CMIP combines simulations from over two-dozen climate models from around the world to compare model results.
All the CMIP models used the same data for past and future greenhouse gas concentrations, pollutant emissions, and changes to how land is used, which can emit or take in greenhouse gases. The more models in agreement, the more confidence in the results.
The team calculated how fast temperatures changed between 1850 and 1930, a period when people started keeping records but when the amount of fossil fuel gases collecting in the atmosphere was low. They compared these rates to temperatures reconstructed from natural sources of climate information, such as from tree rings, corals and ice cores, for the past 2,000 years.

Taken together, the shorter time period simulations were similar to the reconstructions over a longer time period, suggesting the models reflected reality well.
While there was little average global temperature increase in this early time period, Earth’s temperature fluctuated due to natural variability. Rates of change over 40-year periods in North America and Europe rose and fell as much as 0.2 degrees Celsius per decade. The computer models and the reconstructions largely agreed on these rates of natural variability, indicating the models provide a good representation of trends over a 40-year scale.
Now versus then
Then the team performed a similar analysis using CMIP but calculated 40-year rates of change between 1971 to 2020. They found the average rate of change over North America, for example, to be about 0.3 degrees Celsius per decade, higher than can be accounted for by natural variability. The CMIP models show that, at the present time, most world regions are almost completely outside the natural range for rates of change.
The team also examined how the rates of change would be affected in possible scenarios of future emissions [link to RCP release http://www.pnl.gov/news/release.aspx?id=779]. Climate change picked up speed in the next 40 years in all cases, even in scenarios with lower rates of future greenhouse gas emissions. A scenario where greenhouse gas emissions remained high resulted in high rates of change throughout the rest of this century.
Still, the researchers can’t say exactly what impact faster rising temperatures will have on the Earth and its inhabitants.
“In these climate model simulations, the world is just now starting to enter into a new place, where rates of temperature change are consistently larger than historical values over 40-year time spans,” said Smith. “We need to better understand what the effects of this will be and how to prepare for them.”
###
This work was supported by the Department of Energy Office of Science.
Reference: Steven J. Smith, James Edmonds, Corinne A Hartin, Anupriya Mundra, and Katherine Calvin. Near-term acceleration in the rate of temperature change, Nature Climate Change March 9, 2015, doi: 10.1038/nclimate2552.
Discover more from Watts Up With That?
Subscribe to get the latest posts sent to your email.
Climate variation has not changed at all over the 350 years of CET.
Proof: recent temperature trends are not abnormal
However, I’ve now started look at HADCRUT4 and am seriously thinking there is a pattern suggesting marked cooling peaking around 2030.
So when I saw that above graph with a peak around 2030 I nearly split my coffee I laughed so much.
You have to factor in that they are making claims about a “pause” that they simultaneously claim does not exist…
The pause that simultaneously does and does not exist is Schroedinger’s Pause.
Shouldn’t that be Schroedinger’s paws?
Ghost
+4 [four paws!]
Auto – with a grin!
Mann-O-Pause….
Thank you that was brilliant.
Just what I needed.
Which IS sometimes correlated with hot flashes. . .
..and the inability to have a civil debate.
Do they ever say why the rate of change flattens out and goes negative around 2030?
Is that when CO2 goes back to 350ppm?
Must be, eh?
No, that when they plan to retire, they’ll be scot free with a pension
So the slope from 1986 to 1991 is actually less than what it is from 2010 to 2015,despite the fact that the curves are steeper.
It’s the “rock climber effect” where that 40 degree slope is actually the average of a whole bunch of offset 20 ft high 90 degree steps, none of which you can actually climb.
Yes I’ve got the gist of it now !
g
Maybe these morons can contrive a simulated fix for their simulated world and leave the rest of us alone. Right now I’m simulating interest as I get on with reality.
As some genius summarized:
18 years of no warming is much faster than experts expected only a decade ago…
Yeah, but something’s suckin’ up that warming and when it spits it out again we’ll get the ol’ double whammo! Our grandchildren (who moved to the tropics for the weather) will not see snow. It’ll be hot where it’s supposed to be cold and cold everywhere else! That’s what the sin of being people brings! The Earth will purge itself of us, unless we enslave the masses to fight climate change! We have passed the point of no return (and have become hopelessly neurotic)!
…How am I doing?
{:-o
Steven J. Smith, James Edmonds, Corinne A Hartin, Anupriya Mundra, and Katherine Calvin
Names to remember? I think not.
Did they analyse the relative contribution of ‘adjustments’ ?
Do you think they were off their medication?
Five people in a ‘team’ and all they have to do is run a spreadsheet and press ‘update links’ once the sums are done by the computer model. They didn’t go out into the field and measure anything, nor even write any ‘cutting edge’ new model if I read this correctly. Just update links once the compuker finishes the number crunching.
So while one post graduate does that, what are the other four people doing? Sitting around repacking the bong or brewing up a new pot of herbal tea now and then?
What is written on the toilet walls above the bog rolls at Northwest laboratories? “Climate Science papers; please take one”?
Delusions of adequacy.
Compuker is right…
No, don’t underestimate them. They’re playing ‘Call of Duty’ or ‘Halo.’
oh yeah..remember them. cos chances are theyll be quoted by msm as experts sometime soon.
we need to know who the nutters are.
self defence.
First they say, “these changes are happening faster than historical levels and are starting to speed up.” Then they say, “The Earth is now entering a period of changing climate that will likely be faster than what’s occurred naturally over the last thousand years…” Which is it? These changes are happening, or will likely be faster? Either they are already happening, or they’re not. Then they gave it away:
“In these climate model simulations, the world is just now starting to enter into a new place, where rates of temperature change are consistently larger than historical values over 40-year time spans,” said Smith.
They are talking “model simulations” not real observations. It hasn’t happened yet, but they changed the “likely” to happen to “are happening” just to give it more impact. Apparently, it’s okay now for scientists (or their press agents) to lie for the cause.
Your writing demonstrates surprise.
Of that I am surprised.
Louis,
Here, just read the abstract: Anthropogenically driven climate changes, which are expected to impact human and natural systems, are often expressed in terms of global-mean temperature1. The rate of climate change over multi-decadal scales is also important, with faster rates of change resulting in less time for human and natural systems to adapt2. We find that present trends in greenhouse-gas and aerosol emissions are now moving the Earth system into a regime in terms of multi-decadal rates of change that are unprecedented for at least the past 1,000 years. The rate of global-mean temperature increase in the CMIP5 (ref. 3) archive over 40-year periods increases to 0.25 ± 0.05 °C (1σ) per decade by 2020, an average greater than peak rates of change during the previous one to two millennia. Regional rates of change in Europe, North America and the Arctic are higher than the global average. Research on the impacts of such near-term rates of change is urgently needed.
The way I’d say it is that the 40-year rate of change is already faster than any time in the past 1,000 years and expected to increase in the future.
Models are how they’re estimating the future rates, yes. Difficult to observe the future before it happens.
Here’s the link to the supplemental, which lists the 13 or so NH proxy reconsctructions used, and notes that HADCRUT4 was part of the analysis.
No it is not, but — speaking of weasel words — “apparently” you find it ok for you to not read things carefully, and then just make up whatever you want to believe about it.
Real bright, Gates, ya’ forgot the link to the supplemental: http://www.nature.com/nclimate/journal/vaop/ncurrent/extref/nclimate2552-s1.pdf
Gates
You reveal yourself as the typical , confused global warmer, having difficulty distinguishing between GCM’s and reality.
This sort of confusion is the hallmark of all of the global warmers, who always are referring to the product of flawed models as if that represented reality.
They say ” the model tells us..” and proceed from there. Then they wonder why skeptics can’t see what is so obvious to them.
mpainter,
I repeat:
Here’s the link to the supplemental …
http://www.nature.com/nclimate/journal/vaop/ncurrent/extref/nclimate2552-s1.pdf
… which lists the 13 or so NH proxy reconsctructions used, and notes that HADCRUT4 was part of the analysis.
Once again you “reveal” that you stop reading when you see the word “model”. Here is another, extremely clear-cut example:
http://wattsupwiththat.com/2014/11/21/surprise-sea-water-salinity-matters-to-sea-level-on-long-time-scales/#comment-1795250
mpainter: Shun the whole paper, yessir.
“A suite of climate models tell us….”
Who needs to go any further than this?
Note the subthread you are responding to, my rebuttal to Bob, who said “Climate models are the reference? Oy.”: http://wattsupwiththat.com/2014/11/21/surprise-sea-water-salinity-matters-to-sea-level-on-long-time-scales/#comment-1795037
For your next bit: the “observations” are not reality.
YOUR inability or unwillingness to parse plain English — which clearly distinguishes between observation and model output — is the evident confusion here, rendering your chosen belief unassailable. Repeat for emphasis:
mpainter: Shun the whole paper, yessir.
“A suite of climate models tell us….”
Who needs to go any further than this?
No need to go any further when one has already decided what to believe, is there.
It’s the voice of the Mysterons all over again.
years ago a female friend of mine said she really fancied Captain Black, freaked me out a bit.
I fancied Snow White. No, really.
Only one thing is more unpredictable than weather, and that is the mind of the female.
1.5C temperature rise from 1971 to 2020 (0.3C per decade for 5 decades).
GISS and NCDC are gonna’ have to get busy. We need some SERIOUS temperature adjustments over the next 5 years!
With the sun past peak and beginning to slow down, they are going to need some serious adjustments to cover up the soon to come cooling.
It is not yet April 1st. Modelled ‘climate change’ is what’s happening faster than observations.
As Fred Singer: “Successive IPCC summaries have claimed increasing certainty [from 50% in 1996, rising to >95% in 2013] about a human cause of global warming — even as the disparity between observations and IPCC models continues to grow year by year –now for more than 18 years.
http://www.energyadvocate.com/gc1.jpg
Thanks for that
Roy Spencer has something to say: Even Though Warming Has Stopped, it Keeps Getting Worse?
http://www.drroyspencer.com/2015/03/even-though-warming-has-stopped-it-keeps-getting-worse/
http://img.vavel.com/south-park-1667608288.jpg
[Please add a few words of explanation when posting links. ~mod.]
Oops … sorry about that. (I assume everyone here is twelve, like me.)
This is from the comedy series “South Park.” You’re looking at Eric Cartman, lost to the real world in a virtual-reality device produced by Oculus. The implication here is that cAGW alarmists are lost in the virtual world of their mathematical models.
I got that Max…which really worries me as I have not watched much South Park!
What is “South Park’ Is that near Central park or north of it ( it seems to be the way these people in the AGW crowd think to me)
Funny… despite providing some context, your explanation didn’t really contribute to my understanding the meaning of the picture of Cartman lost in his virtual reality world.
Don’t underestimate these guys. I think they see the writing on the wall as far as global warming goes, and they know it. People are weary of being told to ignore their lying eyes and believe the world is burning. I’d bet the next scare tactic push will be ocean acidification. NOAAs 2016 budget shows a 248.8% increase for “Integrated Ocean Acidification”, which I assume is these guys: http://www.goa-on.org/GOA-ON.html
with the coral at Bikini Atoll, ( where man does not go) growing like a forest and in pristine condition, that is going to be a hard one to convince that so called acidification is having much effect.
You must be mistaken. Isn’t that where they did the nuke testing? How could coral be thriving only 57 years after detonating 23 atom bombs. And those were the real kind of atom bombs, not the SkS make-believe kind. Just kidding. Corals are like cockroaches, only pretty.
RH … you’re right. Ever notice that you never see people enamoured with kelp stands … organising dive holidays with the seals ?
Naw
I think they’ll formally try to let the UN take over all the earth’s water.
Our EPA is close already here in the US.
Maybe if they fund enough monkey’s with keyboards…………………..
If we fund a billion climate modelers each running a billion models, which will occur first, an accurate climate model or the complete works of William Shakespeare?
Monkeys with crayons have a better chance at achieving climate model skill than the biased, circular logic used by the human climate modellers.
All these models assume the troposphere is in radiative equilibrium, when actually it is in convective equilibrium, unaffected by fluctuations in greenhouse gasses.
This is something I have been considering. Do you have any references or links you could share?
Bart, Clive Best discusses this at length:
http://clivebest.com/blog/?p=6305
One comment on Best’s article. The atmosphere is actually opaque to IR in the water bands. A very small amount of water vapor should suffice to establish the lapse rate, and water vapor exists in large excess. I am proposing that once the lapse rate is established the atmosphere becomes insensitive to changes in greenhouse gas concentrations, water vapor, CO2, or anything else, and that this explains the “pause” of recent years in spite of continually increasing CO2 concentrations.
Thanks. I think you are onto something, and my thoughts are similar. I think that, at some point, the convective exchange dominates, and radiative exchanges become, at best, second order influences.
Doesn’t convection require a breeze?
At night there isn’t weather coming through, my winds usually drop after dark to nothing, start up again once the Sun starts heating things up. This will be location specific, but if you are a ways from the coast I’ve read this is somewhat common. So night time cooling under those conditions is radiative, right?
Maybe, but there’s always some convection going on, and the mean over the entire surface at any time is, I expect, quite a lot.
A key point here, I think, is that convective cooling will actually increase with increasing GHG, as there are more radiators then to pick up the heat convected to the upper levels of the atmosphere and send it out to space. This could nullify, or even overwhelm, the warming effect at the surface which is due to decrease in radiation to space from increased radiative impedance between the ground and space.
Bottom line: increasing GHG could either increase, or decrease, or have no net effect on surface temperatures, depending on the rate of convection to the upper levels of the atmosphere where the radiators reside. My money is on “insignificant net effect” based on the fact that there is no apparent cause and effect relationship between levels of CO2 and surface temperatures.
“occurred naturally over the last thousand years”
Nice of them to exclude the Mideival Warm Period.
MarkW,
They started right about at the peak if Moberg (2005) is one you trust:
http://climexp.knmi.nl/data/imoberg2005.png
Seems the MWP was just as warm, if not warmer, than today according to that graph.
That’s an inconvenient truth, isn’t it?0
david smith,
As I posted previously, the Holocene maximum looks to have been even higher than the MWP:
http://www.realclimate.org/images//Marcott.png
Especially considering the upper extreme of the 1-sigma envelope bracketing the mean estimate, it was FAR warmer 5,000 years ago than it was at the bottom of the LIA between 1300 and 1870 CE. I don’t see anything inconvenient about that at all, because I’m very much in touch with the fact that CO2 is not discussed in literature as the ONLY radiative forcing affecting the system. The Sun goes a long way toward a plausible physical cause for the LIA …
http://climexp.knmi.nl/data/itsi_wls_ann.png
… as well as much of the subsequent trend upward leading into the Industrial Revolution. But not all. The proposed explanation for the Holocene maxium is orbitally-driven insolation at high northen latitudes a la Milankovitch orbital parameters …
http://stout.hampshire.edu/~ejr09/Vavrus_InsolationTrends.jpeg
… which neatly explains the 10,000 year decline from the Holocene max. The comparison to previous interglacials is striking, the falloff in insolation has not been as steep as in previous ones, going a long way toward explaining the relatively long period of stable temps during the Holocene — something which I take as a hint as to the success we as a species have enjoyed.
What that chart does not show, but implies, is that insolation is leveling of and poised for a moderate increase. I know from other plots that it will be gradual, and not exceed the Holocene max — IOW, I don’t consider it a warming threat, nor do I think it explains the “recovery” from the LIA. The reversal hasn’t happened yet, and it would be too gradual to explain the insolation increase over decades and centuries shown by various reconstructions of solar output itself.
“Why the MWP?” you ask. “Surely anthro CO2 didn’t diddit.” [1] Right, good question. Again, speaking of the Sun, and courtesy of the rocket whizzes at NASA:
http://science.nasa.gov/media/medialibrary/2003/01/15/17jan_solcon_resources/eddy_strip.gif
The delta-14C reconstruction is the one I find compelling evidence for a MWP. Here’s the text from the NASA webpage about this image:
Above: Inferred variations in solar intensity (red and green lines) over the last 900 years appear to be related to the severity of winters in London and Paris. The red line is deduced from the abundance of a heavy form of carbon (carbon-14) in tree rings. This “isotope” of carbon is formed in the upper atmosphere when incoming cosmic rays smash into carbon dioxide molecules. When the Sun’s activity is low, its weakened magnetic field lets more cosmic rays into the solar system, so carbon-14 abundances go up. (Notice on the graph that the scale for carbon-14 is upside down.) This image by scientist John Eddy is based on an earlier one that appeared in Science, 192, 1189 (1976).
Researchers still aren’t sure how small changes in the Sun’s output nudge Earth’s climate in one direction or another. To find the answer, they need to monitor our climate and keep a finger on the Sun’s “pulse” for many decades running.
“Consistency in this data record is crucial,” says Alexandre Joukoff, a scientist at the Royal Meteorological Institute of Belgium who studies the solar constant. “Gaps or flaws in the record undermine our ability to use statistics to draw strong conclusions about phenomena such as Earth’s climate.”
To sum up:
1) Not even NASA is trying to hide the MWP, much less the IPCC, or anyone else save perhaps ignorant or dishonest politicians, journalists and yes, unfortunately some activists.
2) That the past was warmer despite CO2 concentrations is not “inconvenient”. We know these things because good science IS being done, and that science is providing explanations which attempt to take as many knowns into consideration as possible, and constantly looking for others.
3) Understanding the entire system is the only way to seperate out our influence from things, such as the Sun, that we could not possibly have any direct influence over. That’s GOOD science. It’s BAD science and poor logic to argue that “because natural variability, human influence is impossible”. Physics is not so mutually exclusive.
——————
[1] I’ve seen rumblings in literature that agriculture and other human activities going back several thousands of years may have had some effect. I’m somewhat dubious, but wouldn’t rule it out either.
I’d say it’s REALLY BAD science to say that despite there having been greater and much steeper temp increases (and decreases) in the past that were from natural causes, this current (very slight) increase must be from man and his eeevil see-oh-toos. It’s pure supposition. I could go around saying that the increasing price of beer is the reason for the latest temp rise – it’s a hypothesis that is just as weak as the evil see-oh-toos idea.
BTW I love the marcott graph with the nasty red line slapped on the end. Laughable!
David Smith,
Well let’s see. Repeating the original argument without modification or further substantiation, using qualifiers instead of quantifiers when the data are staring you in the face, and ending with a feeble critique about the colors on the plot.
I think I’ll stick with my definition of good science. Thanks for playing.
Make grants payable to Pacific Northwest National Laboratory…before it’s too late.
The models do work; you just have to know how to
cherry-pickselect the correct time periods you use, then plug in the “greenhouse warming” factor (because, what else could be “heating up” the planet?), and presto chango, manmade climate change. Simples!They got rid of the Medieval Warm Period by announcing it wasn’t global based on nearly zero information.
And this reminds me of the Red Queen in Through the Looking Glass. Remember when she yells at Alice to go faster and faster and…they are going nowhere?
“Now, here, you see, it takes all the running you can do, to keep in the same place. If you want to get somewhere else, you must run at least twice as fast as that!”
emsnews,
Nope, MWP and LIA are still there:
http://upload.wikimedia.org/wikipedia/commons/c/c1/2000_Year_Temperature_Comparison.png
Holocene still looks like spaghetti:
http://upload.wikimedia.org/wikipedia/commons/c/ca/Holocene_Temperature_Variations.png
Marcott (2013) still makes the MWP look cold:
http://www.realclimate.org/images//Marcott.png
But weren’t we talking about rate?
Brandon, your proxy model graphics are meaningless for decadal variation…
http://wattsupwiththat.com/2015/03/09/laughable-modeling-study-claims-in-the-middle-of-the-pause-climate-is-starting-to-change-faster/#comment-1879234
David A,
I posted those to rebut the untruth that the MWP has been made to disappear. Try reading what I write.
The previous warm periods have been greatly watered down, and the IPCC ignores much peer reviewed evidence, both before the CAGW proxy studies and after, that they should not have been.
I also mentioned this because your graphics have surface record tails on them, composed of daily resolution, and this conflation of less then 100 year resolution with daily resolution is a piss poor graphic, (especially the scary red stick) likely to give a wrong impression to most laymen.
David A,
Confronted with evidence that the MWP has not been “disappeaed” from the corpus of publicly available information, you move the goalposts …
… ascribe motive …
… and claim correct knowledge without producing a shred of evidence to support your assertions.
For the grand finale, you play the “if it looks scary it must be false” fallacy:
I really like the “if it says something I don’t want it to say, it must be piss poor” tack. You can’t be arsed to comment on the information contained in the plot, no sir. With all the hand-waving you’re doing, it’s a wonder you can even type. Are you dictating?
So Brandon, you must agree that Mikey Mann’s hokey schtick is rubbish because it ‘dissapeared’ the MWP. Yes?
david smith,
Here’s Moberg (2005):
http://climexp.knmi.nl/data/imoberg2005.png
And Mann (2009):
http://climexp.knmi.nl/data/inh_mann.png
This plot contains both, plus several others, including more from Mann:
http://upload.wikimedia.org/wikipedia/commons/c/c1/2000_Year_Temperature_Comparison.png
The distinguishing difference between Mannian and Mobergian reconstructions are that Moberg’s 2005 reconstruction implies, to my eyes, a higher climate sensitivity. Another feature is that Mann’s reconstructions tend to NOT show a runup to the MWP, whereas Moberg shows lower temps rising into the MWP and then falling off into a deeper LIA.
Which reconstruction is most correct I cannot determine from just eyballing the charts, nor would I. For if I did, all I would be doing is saying, “I like the way that one looks better, so that’s the one I’m going to believe”. Which would be motivated reasoning. That’s a no-no.
Mann doesn’t disappear the MWP, it’s still there. Whether Moberg is correct and Mann isn’t is something I do not know, for I have no way of knowing other than what’s published in literature. What I can say with certainty is that both studies are “wrong”, because no measurement of such a large system will ever be pefectly “correct”. All are estimates, because that is all that scientists — who are finite humans same as everyone else — are able to do. It would be nice if they were omniscient, but they’re not.
Accepting these irrefutable truths is the best way I know how to live in reality. What about you?
David A,
Brandon says, “Confronted with evidence that the MWP has not been “disappeaed” from the corpus of publicly available information, you move the goalposts …=========================================================
Bradon, please I never moved any goalposts. Mann disappeared the MWP. His work was described as indefensible by his own team of hockeystick creators. They had to slowly add back in the MWP because the climate models were running so far off the rails from reality, they needed more power to natural variation to keep CO2 alive.
====================================================================
Brandon qutes me, The previous warm periods have been greatly watered down …
Brandons asks, … ascribe motive …
================================================================
Brandon stop trolling. I have given you long and linked work on the disparate motives of CAGW climate scientist. Social science has well established, peer pressure, monetary survival, confirmation bias, political power, post normal science corruption, and several other recognized social science motivations for what is known as CAGW.
The fact that you AGAIN ask a two word question to something that books have been written about, is nothing more then rank trolling.
=============================================
Brandon quotes me further… and the IPCC ignores much peer reviewed evidence …
Randon acuses… and claim correct knowledge without producing a shred of evidence to support your assertions.
========================================================
Wow Brandon, you are a troll.. I have previously quoted studies and given you peer reviewed links to the NIPCC reports and CO2 science ,and other peer referenced studies by PHD scientists. The fact that you ignore them, and throw out false accusations reflects on you.
=================================================================
Brandon continues…”For the grand finale, you play the “if it looks scary it must be false” fallacy:
And then quotes me, “I also mentioned this because your graphics have surface record tails on them, composed of daily resolution, and this conflation of less then 100 year resolution with daily resolution is a piss poor graphic, (especially the scary red stick) likely to give a wrong impression to most laymen.
And then Brandon comments..”I really like the “if it says something I don’t want it to say, it must be piss poor” tack. You can’t be arsed to comment on the information contained in the plot, no sir. With all the hand-waving you’re doing, it’s a wonder you can even type. Are you dictating?”
========================================================================
O my gosh Brandon, your arrogance is only exceeded by your ignorance. Here is the graphic plot you supplied. Clearly my comments were cogent and not hand waving in the least.
http://www.realclimate.org/images//Marcott.png
Now Brandon, see the blue multi proxy with nothing less than 100 year resolution line, with error bars for the less than 100 year resolution line? See the red daily resolution global T anomaly line (Now so you know, the shaded error bars are based on the less then 100 year resolution, and do not pertain to the daily and annual resolution of the red line, or to multi dcadal resolution either. Now do yourself a favor and read up on the evidence for the MWP as well as the peer reviewed science the IPCC missed. I have given you numerous links.
David A,
Can’t miss ’em. The 1-sigma error range is about 0.2 degrees C.
Really can’t miss that becaue
1) It’s red.
2) The mean estimate ranges just over 0.8 degrees C, which is what, 4 — four! — standard deviations of the proxy record.
Irony. And no, I don’t suffer content-free foolishness such as yours gladly. Deal with it, or make better arguments. Your choice.
Brandon, that chart is rubbish, there is no valid way to merge proxy temps with the modern temp record, it is propaganda meant for those who don’t know better.
Brandon it is not so difficult. The error margin for the proxies is a smoothed error margin as well. Decadal signs within that could easily far exceed the error margins. In the words of your heroes, they know [trimmed] about anything less then 100 year resolution.
[Cut that kind of language yourself. We should have to do it for the rest of us. .mod]
Dear Mod, thank you. However please be aware that that was in quotes because it was from one of Mann’s co-workers. It is an historic quote I have given Brandon before, and goes straight to the heart of the matter regarding mixing proxies and error bars. Brandon likes to say he listens to these scientists. His listening is very selective.
David A,
Pesky error bars. So distracting. Where’s Willis when I need him?
Wouldn’t it be cheeper for the world to send the uneducated back to school to learn Basic Math, Geology, Physic and Chemistry?
or else:
When will they ever learn?
Wouldn’t it be cheaper for the world to send the uneducated back to school to learn Basic Math, Geology, Physic and Chemistry?
or else:
When will they ever learn?
Why? Liberal Arts degrees are much easier.
Sometimes not. I became systemprogrammer 1971, studied math and geography(including geology) as well as Theories of Science in those not to mention studying History, Religion and others subjects afterwards. The hardest was History….
Having to read, understand and be able to use Theories of science on medieval texts + a lot of other texts in more than three languages (as I had to for D-level – academic essay same level as Master) isn’t easy when you have to read more than 200 pages each week, at least.
Once I had to read, understand and be able to reflect the text re. French(!) Medieval females economy inheriting small companies in Paris in 1200’s. I don’t have a problem with modern French, but having to read more than 200 pages in Medieval French apart from studies made in 1900’s, from one week to the next isn’t easy. Understanding string-theory is a piece of cake compared to that!
Math is logic. Medieval handwritten text digitialized or not isn’t…..
Norah
To add to the Pete Seeger query
Where have all the scientists gone
long time passing
Where have all the scientists gone
long time ago
where have all the scientists gone
Gone Climate Grant Crazy everyone.
When will they ever learn?
When will they ever learn?
And how about some Mr Dylan?
Come gather ’round Scientists
Wherever you roam
And admit that the sea waters
Around you have grown
And accept it that soon
You’ll be sweating to the bone.
If your World and Universe to you
Is worth savin’
Then you better start climate alarmin’
Or you’ll sink like a stone
For the temperatures they are a-changin’
Come everyday scientists throughout the land
And don’t criticise what you can’t understand
Infallible Climate Scientists are
Beyond your command.
The whole world is rapidly heating
Please get out of the new world
if you can’t fudge a dodgy model
For the temperatures
they are a-chaa aaay aaay ging
BTW
Schroedinger’s Pause
Schroedinger’s Paws
4 paws
Mann-o- Pause
gets The Climate Comedy Gold Award for the Month. So Far.
Papers such as the above certainly give such awards a run for their money
And Ghost of Big Jim. In regards to your Snow White comment. Please go to your
nearest university and give yourself up to the On Campus PTP (Proper Thought Police).
Do not Run or Hide. Resistance is futile.
We know where you Blog!
“Laughable modeling study…”??? No, it is the dirge of what used to be known as “Science.”
Jeez – what do you guys make houses out of? Suger cubes?
I can spell – I just can’t type. ;(
really, my place (oldish for this part of New England) is a young 4+ of those 40 year periods
“what do you guys make houses out of? Suger cubes?”
Nope, they’re all OSB now. Slightly less durable than a sugar cube, but doesn’t sweeten nearly as well.
As some builders say, “The road to Hell is paved with OSB”
No joke. The newest “green” materials are just awful. So much of what is tagged “green” these days is actually, in the aggregate, considering energy usage and pollution for manufacture as well as life cycle costs, worse for the environment and less functional than what it replaces.
I designed and helped build our house using SIP panels in the walls and roof. The SIP panels are two OSB panels with layer of styrofoam in between them. I have a picture in a book on SIP panels, which shows a SIP panel supported at both ends on cement blocks and two men and an elephant standing on the panel. It bows some, but it doesn’t break. I believe the OSB panels are considered about the same strength as plywood. I also believe that at least some of the buildings in Antarctica are constructed out of SIP panels as well as some of the new construction in Japan, because the SIP panels/buildings perform so well in earth quake prone areas. I don’t know how green they are, but they are pretty neat.
You beat me too it but what they said was
“We focused on changes over 40-year periods, which is similar to the lifetime of houses and human-built infrastructure such as buildings and roads,” said lead author Smith. “In the near term, we’re going to have to adapt to these changes.”
What about bridges and sewage systems etc.
Where ignorance is bliss tis a folly to be wise?
They don’t get out much do they? I live in a (still sturdy) house built around 1870. The road it’s on goes back way beyond that. Can I assume that the Pacific Northwest area is parvenu?
I watched a T&V program with a name like; “After Humans ” which went through the gory details of what happens after human life on earth is extinguished.
Surprisingly they actually showed photographs of abandoned this and abandoned that, which showed man made structures actually being devoured by nature, including when it comes to that New York’s Manhattan City.
Basically steel and concrete decompose extremely rapidly in the scheme of things, WITHOUT HUMAN MAINTENANCE .
So will basically all be gone in about 1,000 years after the last meddling human stops tinkering with climate data. Well maybe the pyramids will still be there but may be buried in the sand, but pretty much everything else goes.
Seeing what Mother Gaia did to Machu Pichu or Angkor Wat, or other Mayan sites, and it will all be taken care of in due time.
Have you seen what strangling vines do to totally immense trees, given enough time ??
g
George, I find it fascinating to see what nature has done to Pripyat and the exclusion zone around Chernobyl in a relatively short time of abandonment. Elena Filatova has an excellent photo journal of this at:
http://www.angelfire.com/extreme4/kiddofspeed/
http://www.angelfire.com/extreme4/kiddofspeed/plutosrealmproject14a.jpg
Nature swallows up the follies of mankind.
“george e. smith
March 9, 2015 at 1:10 pm
I watched a T&V program with a name like; “After Humans ” which went through the gory details of what happens after human life on earth is extinguished.”
Yes, regularly repeated here in Australia, on state funded SBS, along with the climate change alarmist message. Quite comical in fact. Pets going hungry, nuclear power stations exploding etc etc etc etc.
My house was built in of wood in 1932 … still going strong!
I believe those are the days when a 2 x 4 was actually 2″ x 4″ instead of 1.5″ x 3.5″
Isn’t Climate Change™ supposed to bring bigger and nastier termites?
AW … the timber has become very hard with age … the termites would need to be nuclear powered. 😉
My thought’s exactly, “Only 40 years for a house?!” My house is 70 and in fantastic shape. I once visited a buddy from grad school at his ancestral home in Italy and it was over 500 years old. Granted, wood-frame houses (the majority in the U.S.) have to be maintained and repaired if/when things happen, but many are still going strong after 100 years and should easily last another 100 if maintained.
Oh, but I forgot about Global Warming. All the houses will cook, and get brittle and crispy. We’re doomed. Quick, simulate a solution!
The case for climate alarm is dying, people have just heard enough. As this happens the alarmist claims get wilder and wilder. What is really sad is the taxpayer dollars being spent on junk science like this.
This is nothing to do with science any more. It’s just religion, pure and simple.
Look at the names cited in the references.
Near-term acceleration in the rate of temperature change
http://www.nature.com/nclimate/journal/vaop/ncurrent/full/nclimate2552.html
And the name of their institution: “Affiliations Joint Global Change Research Institute, Pacific Northwest National Laboratory”. They have dropped anthropogenic and warming and climate and weather, and just generalized whatever they do to “change”. Well, maybe their new institution now includes diapers and oil and coins.
“The more models in agreement, the more confidence in the results.”
Just incredible that the models are verified with each other and not actual observation!? The only thing more disturbing than the failure in basic science and logic is the fact that taxpayers money is taken from them to pay for this without any recourse.
Time to end zero accountability, government-sponsored “science”
“The more models in agreement, the more confidence in the results.”
That was the one phrase that made my stomach turn. I just find it impossible to add the word ‘science’ to climate. Total, utter crooks. Not idiots. These people know what sh!t they are producing but just don’t care. They see it as getting back some of the tax THEY have paid.
Tempted to email them saying we have developed 32 models which are in very good agreement that they do shoddy, pseudo-science, so we are highly confident of that result.
+1
Dave in Canmore,
Yes.
No, that really would be dumb. Try reading further down:
The team calculated how fast temperatures changed between 1850 and 1930, a period when people started keeping records but when the amount of fossil fuel gases collecting in the atmosphere was low. They compared these rates to temperatures reconstructed from natural sources of climate information, such as from tree rings, corals and ice cores, for the past 2,000 years.
To be fair, the PR team look to have muffed the time period studied … I believe it should be past 1,000 years, not 2,000.
And plow that money into literacy skills.
Nope. You cannot mix disparate proxy. Most proxies have very poor decadal resolution, Ice cores at best have nothing less then 100 year resolution. Proxies to determine decadal trend is a poor idea to start, but hey given adequate parameter tuners, it can say whatever they want.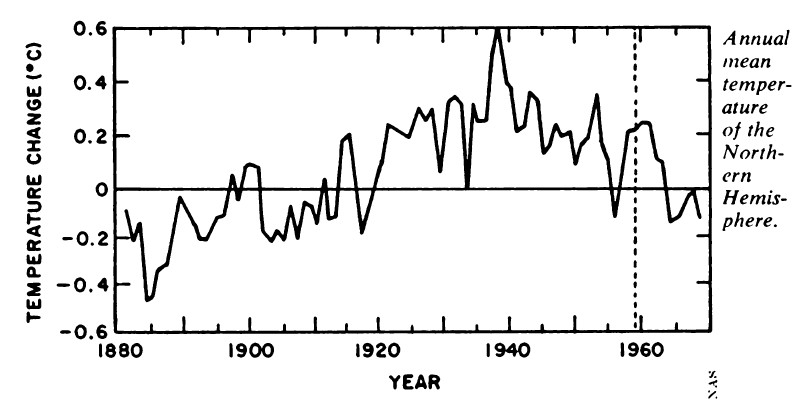
As, shoot I cannot remember which CAGW proponent it was, but he said words to the affect of we should just pool our best proxy record together in one paper, keep Michael Mann out, and in the end “we would still know “fuck-all” about less then 100 year resolution”, and we should publish, retire, and not leave a forwarding address.
Up through the early part of the IPCC their own documents showed trends equal to the 1979 to 1998 run up.
Here was a N.H. drop of .7 C plus in 30 years. Every major climate organization endorsed the ice age scare, including NCAR, CRU, NAS, NASA – as did the CIA.” The two decade run up to the 1940 peak was over .3 C per decade.
I simply choose to take the CAGW proponents at their word. They clearly were disturbed by the 1940s blip. They stated it would be “GOOD” to remove the blip. They have been ever sense. They talked about the “cause” and changing the peer review process if necessary.
Beyond that the predictive ability and therefore policy implications of climate models should be based on future forecasting, not hind casting to vague proxies. Here the models fail completely.
http://www.energyadvocate.com/gc1.jpg
What is the 28 year trend of RSS?
http://www.woodfortrees.org/graph/rss/last:312/plot/rss/last:312/trend/plot/rss/last:312/trend/detrend:0.3222544/plot/rss/last:312/trend/detrend:-0.3222544/plot/rss/from:1996.65/trend/plot/rss/from:1996.65/trend/detrend:0.20096/plot/rss/from:1996.65/trend/detrend:-0.20096
Let us see again after the AMO reverses…
Here is the link to the below pasted Bill Illis comment.
Sometimes they cool the past in large jumps, but often .01 degrees at a time, a death to any real history by 1000 cuts.
Here are the changes made to GISS temperatures on just one day this February. Yellow is the new temperature assumption and strikeout is the previous number. Almost every single monthly temperature record from 1880 to 1950 was adjusted down by 0.01C.
I mean every freaking month is history suddenly got 0.01C colder. What the heck changed that made the records in 1880 0.01C colder. Did the old thermometer readers screw up that bad?
http://s2.postimg.org/eclux0yl5/GISS_Global_Adjustments_Feb_14_2015.png
GISS’ data comes from the NCDC so the NCDC carried out the same adjustments. They have been doing this every month since about 1999. So 16 years times 12 months/year times -0.01C of adjustments each month equals -1.92C of fake adjustments.
Lots of opportunity to create a fake warming signal. In fact, by now it is clear that 1880 was so cold that all of the crops failed and all of the animals froze and all of the human race starved to death or froze to death and we went extinct. 135 years ago today.
end of Bills post.
=============================================
Brandon, here is how you can verify these changes….
http://wattsupwiththat.com/2015/03/06/can-adjustments-right-a-wrong/#comment-1877500
Brandon, I will give you one thing, the models are informative. We are informed by their 97% wrongness in the SAME direction. This informs us that some fundamental aspect of their physics is wrong Occam’s razor would indicate that they are fundamentally wrong in CO2 climate sensitivity.
David A,
Been going on for a long time: We use a multiproxy network consisting of widely distributed high-quality annual-resolution proxy climate indicators, individually collected and formerly analysed by many palaeoclimate researchers (details and references are available: see Supplementary Information). The network includes (Fig. 1a) the collection of annual-resolution dendroclimatic, ice core, ice melt, and long historical records used by Bradley and Jones 6 combined with other coral, ice core, dendroclimatic, and long instrumental records. ~Mann, et al. (1998)
MBH98 weren’t the first to use the multi-proxy approach either. Your argument really doesn’t make sense to me because all these data form the entirety of what we think we know about past climactic changes. In my mind, the best science is done when multiple lines of evidence converge on same answer. In the case of multiple proxies I understand that they serve as checks against each other, strengths of one offset weaknesses of others, etc. I don’t pretend to understand all of it.
I do know from my own number crunching that figuring out rates of change on proxy data for sub-century timescales is a bitch, so I am reading the supplemental for this paper with a great deal of interest.
They even tossed in a borehole study for you: Pollack, H.N., and J.E. Smerdon, 2004: Borehole climate reconstructions: Spatial structure and hemispheric averages. J. Geophys. Res., 109 (D11), D11106, doi:10.1029/2003JD004163
Dunno if you know, but he updated it about a week ago: http://www.drroyspencer.com/2015/02/on-natural-climate-variability-and-climate-models/
http://www.drroyspencer.com/wp-content/uploads/90-CMIP5-models-vs-observations-with-pause-explanation.png
His choice of baseline and zero-year remain … creative:
http://1.bp.blogspot.com/-i_B5dDr7jz8/VPO2oxQbQII/AAAAAAAAAW8/ObX8s9Bw4s4/s1600/90-CMIP5-models-vs-observations-with-pause-explanation%2Brebaselined.png
Dr Roy is right, they under estimated natural temperature dynamics, cranked sensitivity to Co2 up to compensate for what they didn’t know (the PDO for instant), and now models run way to hot.
And surface temps agree with this, without all of thecreative edits to the data.
Brandon, please pick up the logical connection in consecutive sentences.
What I said…”Nope. You cannot mix disparate proxy. Most proxies have very poor decadal resolution, Ice cores at best have nothing less then 100 year resolution. Proxies to determine decadal trend is a poor idea to start,”
Your out of context comment…“
Quoting me. Nope. You cannot mix disparate proxy.
Brandon says… Been going on for a long time:
===============================================
Brandon the team proxies of climate science are well known. After much criticism from rational skeptics, they, in those emails, admitted amongst themselves that many of the skeptic criticisms were valid. (Mann was the exception to this.) (Climate Audit has many good posts on this)
In the mid 2000s talking about their best team effort at a proxy history, using all the proxies in this report, they said they would know “fuck-all” about decadal variation. Proxies can work to a degree but the decadal error bars are far bigger then the smoothed error bars.
Brandon, that is not an updated Dr. Spencer chart you showed, it is a different chart, and shows the broken models across the board. The one I showed you is mid tropospheric and if updated to this month, the flaws in the models continue to grow. 18 to 26 years now for this.
Brandon, why do you mention bore-holes. Bore-hole temperatures are only sensitive to climate variations at multi-decadal or longer time scales due to the attenuation by the diffusion process.
David A,
I do data for a living, and you would not believe how badly it can get b0rked up by careless lusers, bad code, horrible data governance policies. You bet your ass I’ve written routines to reconcile accounts and make balancing journal entries. One place had what appeared to be an entirely separate set of books for the same business entities, turns out that they didn’t know how to use the system properly, and those entries were part of their consolidation process for doing quarterly and annual financials. “But they don’t tie to each other,” I challenged. “We know that … we manually balance them in a spreadsheet, which is part of our audit package,” I was assured. Somewhat.
As much a wizard as I am at that job, I can’t look at those temperature data and tell you why those adjustments were made. I don’t know enough about it. I suggest reading the vast array of papers on the topic, or send someone at GISS an enquiry if you really wish to know. Bill Illis already has his answer: Lots of opportunity to create a fake warming signal. In fact, by now it is clear that 1880 was so cold that all of the crops failed and all of the animals froze and all of the human race starved to death or froze to death and we went extinct.
It’s not that I’m not skeptical about these sort of things, but it does occur to me that it would be desirable to get the models to match the faked temperature records a little better, and on that note: tweaking the model output would be a heck of a lot easier to do, don’t you think? That, and data-fakers tend not to preserve the raw data, publish papers telling you how they fudged it or release the source code for the algorithms that do it so that any Tom, Dick or Harry can download the whole kit and kaboodle and go through it with a fine-tooth comb themselves.
Do as you will, of course. I’m just saying there are more interesting things to discuss than fantastically implausible conspiracy theories. Like the science itself. I think it’s incredibly fascinating.
David A,
All models are always wrong. I don’t particularly care that one is mid-tropospheric and the other is surface — they’re both going to be wrong, else they wouldn’t be models.
My gripe, which you’ve ignored, is that Spencer has manufactured on the order of a 0.08 K discrepancy between observation and model ensemble projection simply because he doesn’t use the 1986-2005 reference period as published by the IPCC. That may sound like peanuts until you consider that the standard deviation of the model-actual residual for 5-year running means from 1860 through 2005 is 0.077 K.
IOW, he’s making the CMIP5 ensemble look nearly a whole standard deviation worse than it is.
His caption, “Agreement in early years between climate models and observations led modellers to believe their assumed forcings (mostly CO2) and climate sensitivity were correct …” is egregiously wrong for two reasons I can think of off the top of my head:
1) Sensitivity is an emergent property of the model output, not a parametrized input. They are not “tuned” by dialling in some desired forcing for CO2. Here’s a reference: http://www.mpimet.mpg.de/fileadmin/staff/klockedaniel/Mauritsen_tuning_6.pdf
2) “Early observations” include further back than 1983 as Spencer would have you believe: http://cmip-pcmdi.llnl.gov/cmip5/getting_started_CMIP5_experiment.html
Long-term (century-scale) climate experiments include
Baseline paleoclimatic, preindustrial (pre-1850), and historical (post-1850) climate simulations (Table 3);
Future projections of climates associated with different atmospheric greenhouse gas (GHG) scenarios specified by several “representative concentration pathways” (RCPs) (Table 4);
Coupled carbon-climate [i.e. “Earth System Model (ESM)”] simulations of historical and future climates (Table 5);
Experiments for diagnosing the model representations of selected climate mechanisms (Table 6);
Simulations designed to facilitate climate-change detection and attribution studies (Table 7).
David A,
Yes, that’s why I mentioned them.
The 1986-2005 reference period as published by the IPCC is a living breathing document. They change the baseline.
 ?w=700
The models diverge from the observations at any time, every time they are run from the present to forward. Saying, ” all models diverge” is a very weak statement. The idea is to improve the models, to learn from the errors. When the errors all run in one direction, way to warm, then in any other field you would understand you have something fundamentally wrong.
Instead the IPCC and climate science is attempting to adjust the data to match the models. The records of climategate are clear, and in context. If you studied them you would see that scientist do not speak that way. If you study the IPCC you will see they use the projected harms from the ensemble mean of consistently wrong in ONE direction models (meaning the purposely choose a model mean further away from the observations then their best, but still to warm model runs) to predict future harms. This is piss poor science.
It is akin to an altimeter manufacture, knowing his altimeters all tell the pilot the plane is 1000 feet higher then it is, to go ahead and fly over the mountains anyway, and to trust his altimeter.
The data formerly showed .3 per decades shifts, warm and cold in this century. They have changed that. My links to the consistent .01 degree adjustment shifts in the past have no explanation. No station changes, no instrument changes, no TOBS changes are responsible for this. Making an analogy to the stock market is irrelevant nonsense. These changes happen regularly without explanation. This is not science. It is setting science back. The political aspects of monetary influence, peer pressure, confirmation bias, and political pressure, are well known and studied features and it does not take a conspiracy nut to understand these corrupting influences.
The fact that a great deal of excellent peer reviewed literature is ignored by the IPCC is a shame, but not surprising. If you wish to better understand the political influence on CAGW science, study the book “Blue Planet in Green Shackles” Then you will begin to comprehend climate gate, the IPCC using articles from the WWF and Greenpeace, while ignoring peer reviewed science, etc.
Brandon says, “His caption, “Agreement in early years between climate models and observations led modellers to believe their assumed forcings (mostly CO2) and climate sensitivity were correct …” is egregiously wrong for two reasons I can think of off the top of my head:
1) Sensitivity is an emergent property of the model output, not a parametrized input. They are not “tuned” by dialling in some desired forcing for CO2. Here’s a reference:”
==================================================================================
Climate sensitivity “emerges” in the models based on CO2 sensitivity. Based on the physics of CO2 sensitivity including the positive feed backs based on their best understanding of the physics. This is consistent in all the model runs, influenced disparately depending on other assumptions in the models, ocean cycles, particulates etc. To pretend that the reported physics of climate sensitivity are not in the models is arm waving. Changing this one factor, would greatly improve the climate models.
David A commented on
I believe the key area they used to jack up warming is the effect of humidity very near the surface, I believe they allow for super saturation of water vapor (ie over 100% rel humidity), this isn’t likely a real physical effect.
I will note that, while monitoring Tsky with an IR thermometer and comparing the cooling rate through the night, I have seen humidity rise into the upper 80% or higher, and the cooling rate slows, but it doesn’t super saturate, it condenses out as dew and or fog.
David A,
Excellent comments. You know the issue very well, indeed. Thanks.
Thank you guys, And yes Mio the feedback of water vapor is a part of “climate sensitivity” where all feedbacks are supposedly incorporated. There is so much evidence against this. Water Vapor, even in clear sky conditions greatly reduces surface insolation.
Brandon dismisses the influence of political goals in the field of climate science. He forgets that CAGW is the poster child of “Post Normal Science” which by definition is the comingling of science with politics. The child from that union is the IPCC.
David A,
The RCPs for the CMIP5 model runs used in AR5 begin in 2006. Hence the 1986-2005 reference period. Do you get it now?
No, it’s 100% true. Until you recognize that claiming the models are broken because they diverge from observation is a useless argument (because you’ll always be able to make it), you will continue to have useless input in this debate on this topic.
No kidding, genius. Tell me something nobody knows.
David A contradicts himself. Can he figure out how?
Brandon quotes me.
“The models diverge from the observations at any time, every time they are run from the present to forward.”
Brandon says, “The RCPs for the CMIP5 model runs used in AR5 begin in 2006. Hence the 1986-2005 reference period. Do you get it now?
=================================================
It matters not what the base line is, nor does the initialization, nor does the hind cast. Models, to be useful, must have predictive ability. When they all run off the rails in the same direction, they fail Yes, the error is teaching them something, unless they are climate scientist.
Brandon quotes me…
“Saying, ” all models diverge” is a very weak statement.”
Brandon says, “No, it’s 100% true. Until you recognize that claiming the models are broken because they diverge from observation is a useless argument (because you’ll always be able to make it), you will continue to have useless input in this debate on this topic.”
Brandon quotes me again…”The idea is to improve the models, to learn from the errors.”
Brandon bloviates,
No kidding, genius. Tell me something nobody knows.
===================================================
Poor lass, and I am beginning to think you to be quite young, because if you had an iota of classical training your would not make such inane logical blunders.
Yes, all models have some error. That is irrelevant to what I am saying. If I run a computer model of the physics behind an altimeter, it will likely have some extremely small divergence from the realties it encounters.
However the climate models do not have hemi/demi/semi/minute errors.
“The climate models are akin to an altimeter manufacture, knowing his altimeters all tell the pilots their plane is 1000 feet higher then it is, to go ahead and fly over the mountains anyway, and to trust their altimeter, even though the manufacture knows all the altimeters read wrong in the same direction, and will cause the plane to crash into the mountains.
Both the above analogy and below are what you failed to read, as you consistently quote me out of context.
I must repeat myself, because you learn slowly. I will make caps of the cogent facts you missed.
“If you study the IPCC you will see they use the projected harms from the ENSEMBLE MEAN of consistently wrong in ONE direction models (MEANING THEY PURPOSEFULLY CHOOSE A MODEL MEAN FURTHER AWAY FROM THE OBSERVATIONS, RATHER THAN USE THEIR BEST MODEL RUNS.
THEN, FROM THE ENSEMBLE MEAN OF CONSITENTLY WRONG MODELS, NOT OBSERVATIONS, THEY PREDICT FUTURE CLIMATE AND SPECULATIVE HARMS. (Just like the bad altimeter manufacturer.)
So clearly Brandon you need to tell the IPCC “the idea is to improve the models, to learn from the errors.” because clearly they ignore their errors, and treat the known to be wrong in one direction ensemble mean as reality.
For a detailed and technical work up of this try this link.
http://www.science20.com/virtual_worlds/blog/guest_comments_gcms_and_global_warming_prof_robert_g_brown_duke_university-115271
David A,
I’m talking about how the comparisons are presented, wrongly, by Spencer …
http://1.bp.blogspot.com/-i_B5dDr7jz8/VPO2oxQbQII/AAAAAAAAAW8/ObX8s9Bw4s4/s1600/90-CMIP5-models-vs-observations-with-pause-explanation%2Brebaselined.png
… by choosing a five year baseline zeroed at 1983 when the projection portion of those model runs begins all the way out in 2006. As usual, you change the subject.
If you’re looking for an AOGCM to tell you if it will rain on August 28, 2035 at 6:34 PM in Toronto, you’re gonna be able to call them junk forever.
Odd argument, since the CMIP5 ensemble misses on either side of the observations over the course of the instrumental record.
I do study the IPCC. The models are not “consistently wrong” in “ONE direction” only:
http://3.bp.blogspot.com/-fRV6ymzCb7A/VQCAQnsE63I/AAAAAAAAAYQ/SDw5lXjU4GA/s1600/CMIP5%2Bto%2BGISS%2BNov%2B2014%2B12mo%2BMA.png
http://www.energyadvocate.com/gc1.jpg
Ya, they pretty much all run way to warm, and only the forward projection portion is relevant to public policy, and that is where they are very bad, in a consistent and informative way.
You really should read the links I posted giving the detailed commentary.
In honor of pi day (3.14.15), I’m surprised they didn’t mention that they rounded pi to 1,000,000 digits for all their calculations, thereby increasing the accuracy of their models by 1,000,000 times.
However the IPCC is a changeable breathable document.
http://wattsupwiththat.files.wordpress.com/2014/01/clip_image022.jpg
However the are not even adequate fortune tellers
Brandon quotes me…
“Models, to be useful, must have predictive ability.”
————————————————
Brandon bloviates nonsense while ignoring my cogent related comments which were not , of course quoted by him…
“If you’re looking for an AOGCM to tell you if it will rain on August 28, 2035 at 6:34 PM in Toronto, you’re gonna be able to call them junk forever.”
=================================================================
What I actually said
“Yes, all models have some error. That is irrelevant to what I am saying. If I run a computer model of the physics behind an altimeter, it will likely have some extremely small divergence from the realties it encounters.
However the climate models do not have hemi/demi/semi/minute errors.
“The climate models are akin to an altimeter manufacture, knowing his altimeters all tell the pilots their plane is 1000 feet higher then it is, to go ahead and fly over the mountains anyway, and to trust their altimeter, even though the manufacture knows all the altimeters read wrong in the same direction, and will cause the plane to crash into the mountains.
Both the above analogy and below are what you failed to read, as you consistently quote me out of context.
I must repeat myself, because you learn slowly. I will make caps of the cogent facts you missed.
“If you study the IPCC you will see they use the projected harms from the ENSEMBLE MEAN of consistently wrong in ONE direction models (MEANING THEY PURPOSEFULLY CHOOSE A MODEL MEAN FURTHER AWAY FROM THE OBSERVATIONS, RATHER THAN USE THEIR BEST MODEL RUNS.)
How long will this first stage of grief over the loss of man-bear-pig last for the warming cultists?
.2 degreesper decade up and down is natural, but .3 degrees per decade up and down is unnantural and frientghtning and will destroy Earth. Hmmmm what are the error bars for the .2 degrees per decade? It’s worse than we thought.
Around 1733 to 1740 there was a change of -0.33C/decade change in Central England Temperature.
We adapted to these ‘temperature changes’ a very long time ago.
A few days ago it was reported that a 2.8 million hominid jawbone was found in the Afar Depression – Ethiopia.
It is a land of terrible heat, sulphur, salt and lava.
http://ngm.nationalgeographic.com/2012/01/afar-depression/morell-text
If you repeat a falsehood loud enough and often enough, some people will believe it.
Even those doing the repeating