Guest Opinion: Dr. Tim Ball
We were told in October, before 2014 was over, that it was heading toward being the warmest year on record (Figure 1). The visual link of Polar Bears underscored the message. In fact, 2014 was among the coldest 3 percent of years of the last 10,000, but that doesn’t suit the political agenda.

Figure 1
We know the headline referred to NOAA’s projection, but the public only remember “warmest year”. It is a routine of manipulation of headlines practiced by bureaucrats and supporters of the Intergovernmental Panel on Climate Change (IPPC), from the start. The claim was not surprising, because NOAA was pushing 2014 as warm beginning in January with this headline “NOAA: January 2014 fourth-warmest on record.” Various months were identified during the year, for example, “NOAA: August 2014 Was The Warmest On Record,” noting August was the warmest by a fraction. But they had already reported,
The summer of 2014 is officially the hottest since the modern instrumental record began more than 130 years ago, according to the latest state of the climate report from NOAA’s National Climatic Data Center.
By October they were summarizing the year.
“This makes the first ten months of 2014 the warmest January to October period on record and puts 2014 on track to be the warmest year recorded in the NOAA archive, which dates back to 1880.”
Bob Tisdale provided an excellent summary of the “Anticipation” for two surface records from GISS and NCDC. He was not surprised when these records appeared, showing 2014 was the warmest, according to them, by 0.02°C. Remember, this is from a record that is restricted by the historic record to measurements of 0.5°C. We also know the two satellite records, RSS and UAH, both show it was not the warmest year.
To counteract the headline you need something very dramatic, because there is nothing significant about the 2014 temperature as Tisdale plans to identify in an upcoming article titled, The Uptick in Global Surface Temperatures in 2014 Doesn’t Help the Growing Difference between Climate Models and Reality. He is interested in seeing how Gavin Schmidt, who replaced James Hansen at the Goddard Institute for Space Studies (GISS), is carrying the torch. History shows that GISS readings are consistently higher than all other sources. It is just one indicator of the temperature adjustments made so the AGW hypothesis fits the political agenda.
Challenges and IPCC Fixes
How valid is the 2014 claim? In the 10,000 – year context, it is significant because it is among the 3 percent coldest years, which is far more significant than the 100-year warm alarmists proclaim. There are two major reasons: Highest readings occur in the most recent years of a rising temperature record. Every alteration, adjustment amendment and abridgment of the record so far, was done to create and emphasize increasingly higher temperatures.
1. The instrumental data is spatially and temporally inadequate. Surface weather data is virtually non-existent and unevenly distributed for 85 percent of the world’s surface. There are virtually none for 70 percent of the oceans. On the land, there is virtually no data for the 19 percent mountains, 20 percent desert, 20 percent boreal forest, 20 percent grasslands, and 6 percent tropical rain forest. In order to “fill-in”, the Goddard Institute for Space Studies (GISS), made the ridiculous claim that a single station temperature was representative of a 1200 km radius region. Initial claims of AGW were based on land-based data. The data is completely inadequate as the basis for constructing the models.
2. Most surface stations are concentrated in eastern North America and Western Europe and became the early evidence for human induced global warming. IPCC advocates ignored, for a long time, the fact that these stations are most affected by the urban heat island effect (UHIE).
The UHIE was one of the first challenges to the claim of AGW evidenced in the instrumental record. Two graphs produced by Warwick Hughes were the most effective and appeared in 1991, shortly after the first IPCC Report in 1990. Figure 2 shows temperature at six major Australian cities.

Figure 2
A most likely explanation for the increasing UHIE, is expansion of the suburban area until it encompassed airport weather stations originally outside the city. The automobile made this possible. Figure 3 provides a comparison with 26 rural stations.

Figure 3
The difference is marked. What is equally interesting is that temperatures were higher in the first part of the record from 1880 and 1900.
3. There is a consistent revision of the record to lower historic readings. This increases the gradient of supposed warming. It is apparent in the New Zealand record(Figure 4).

Figure 4
A search of WUWT, using the term “Temperature adjustments”, yields a plethora of evidence. Every adjustment serves to change the gradient of the curve making today warmer than the past. Explanations, when given, usually provide little justification for the adjustment. The other tell tale sign is that virtually all adjustments occur before the UAH satellite temperature record began in 1991.
4. Policy anticipated that satellite data would replace the need for surface weather stations. As a result many weather stations were abandoned (Figure 5), or at least not included in the calculation of the global average.
“The figures below indicate
a the number of stations with record length at least N years as a function of N ,
b the number of reporting stations as a function of time,
c the percent of hemispheric area located within 1200km of a reporting station.”

The number of surface stations was inadequate in 1960, but was further reduced in 1990. Notice that only approximately 1000 stations cover 100 years.
But how accurate can the global temperature be when Antarctica is omitted. Consider the IPCC conclusion
Most of the observed increase in global average temperatures since the mid-20th century is very likely due to the observed increase in anthropogenic GHG concentrations. It is likely that there has been significant anthropogenic warming over the past 50 years averaged over each continent (except Antarctic).
Antarctica is 14 million km2, an area almost equal to Russia, (17 million km2), the largest country on Earth.
Add to that the 14 million km2 of the Arctic Ocean, for which there is no data, as the Arctic Climate Impact Assessment (ACIA) Report notes (Figure 6).

Figure 6
Extent of these regions is one thing, their role in world climate is another, and arguably far more important than almost any other region.
6. Figure 6 shows that fewer stations are a contributing factor to higher temperatures.

Figure 6
Stations NOAA used from the Global Historical Climate Network (GHCN) in Canada illustrate the problem. (Figure 7).

Figure 7
There are 100 stations north of the Arctic Circle, but NOAA only uses Eureka, a known warm anomaly, to cover 1/3 of the second largest country on Earth. Even the 1200km measure doesn’t apply.
7. Alteration of the historic record includes the infamous hockey stick, in which a member of the Climatic Research Unit (CRU) group is reported to have told Professor David Deming, “We have to get rid of the Medieval Warm Period? That involved creating the handle of the hockey stick. The blade was formed from CRU Director Phil Jones’ data that showed an increase of 0.6°C in approximately 120 years. The problem was the error factor was ±0.2°C or ±33 percent.
8. 20th century temperature trends begin with warming from 1900 to 1940, cooling from 1940 to 1980, warming from 1980 to 1998 and a slight cooling trend to 2014. Alarmists attributed the cooling to human addition of sulphate, but that failed when temperatures began to rise, with no decline in sulphate levels.
9. If we accept overall warming from 1900, which is reasonable as the Earth emerges from the Little Ice Age (LIA), then the highest temperatures will occur in the most recent record (Figure 8).

Figure 8
Identifying that 2014 was fractionally warmer than any other in the record does not change the trend of the “pause”. It does not enhance the CO2 causation claim.
10. The claim is 2014 is 0.02°C warmer than any other year. It is reasonable to assume that the US temperature record is among the best. Anthony Watts showed that only 7.9 percent of US stations are accurate to < 1°C. (Figure 9)

Figure 9
A Counter Headline Must Provide Perspective
Some form of the title for this article could work. “2014: Among the 3 percent Coldest Years in 10,000 year.” Figure 10 shows the Northern Hemisphere temperature for the period variously called the Climatic Optimum, the Hypsithermal, and the Holocene Optimum.

The red line, added to the original diagram, imposes the approximate 20th century temperatures (right side) against those of the last 10,000 years. As CO2Science noted from Dahl-Jensen (1998),
After the termination of the glacial period, temperatures increased steadily to a maximum of 2.5°C warmer than at present during the Climatic Optimum (4,000 to 7,000 years ago).
The key phrase in the 2014 claim is, “in the record”, but that only covers approximately 100 years. In the climatologically meaningful 10,000-year context, it is among the coldest.
The claim that 2014 was the warmest on record was politically important for proponents of the Intergovernmental Panel on Climate Change (IPCC) story that human CO2 was causing global warming. Central to that argument was the need to prove late 20th century temperatures were the “warmest ever”. This is why the 2014 claim conveniently appeared before the Conference of the Parties (COP) meeting in Lima Peru, at which the false IPCC claim was desperately promoted. Political importance of the measure was accentuated by the continued, 18+ years lack of increase in global temperature.
Evidence keeps contradicting the major assumptions of the anthropogenic global warming (AGW) hypothesis. As T.H. Huxley (1825 – 1895) said,
The great tragedy of science – the slaying of a beautiful hypothesis by an ugly fact.
The problem is the facts keep piling up and the AGW proponents keep ignoring, diverting, or stick-handling (hockey terminology), their way round them. We know the science is wrong because the IPCC projections are wrong. Normal science requires re-examination of the hypothesis and its assumptions. The IPCC removed this option when they set out to prove the hypothesis. It put them on a treadmill of fixing the results, especially the temperature record. As Chinese General Tao Kan said, “It is like riding on the back of a tiger and finding it hard to get off.”
(A wasted posting effort by a banned sockpuppet. Comment DELETED. -mod)
It is just fantastic. This could be a classic. Surely beats the interpolation in gistemp.
(A wasted posting effort by a banned sockpuppet. Comment DELETED. -mod)
rooter
wow you let icouldhelpit beat you! how much did that cost you to be second.
Sounds like Climatologists and MSM should get a GRIP on past temps before declaring current high temps as historic
rooter
“It is just fantastic. This could be a classic. Surely beats the interpolation in gistemp.”
—————
Yes rooter it is fantastic…..especially while it shows that people like your self can not distinguish between climate and weather, or yearly cycles.
Estimating and evaluating the particular 2014 in the format of 10,000 years is a climatic evaluation.
I know this make no heads or tails for you thus far….be patient.
A climatic evaluation or estimation is not calculated only on temp variations,….. like the measured amount of warming or cooling during the year…..but actually through the CS metric…. the amount of temp variation in accordance to CO2 emissions.
Whatever value of CS you fancy, according to the reality this is the higher CO2 emission-concentration year for the last 10,000 years with an amount of warming that makes this year with the less ever “amplifying” of warming, meaning that the 2014 regardless of so much CO2 in atmosphere shows no “amplifying” and therefor showing that there is no warming whatsoever but actually the climatic signal is one of cooling, to the extent of it been the higher COOLING CLIMATIC signal for this year than any other year for the last 10,000 years.
Sorry but you know we have this thing the CS you know, and it has a meaning and a use for, is not a figment of imagination…….it is the main climatic metric, for better or worse.
So in the climatic estimation, like when you say the warmer or colder year ever (evah), or for any time with a length beyond a 100 years, this year belongs to the 3% of the coldest years for the last 10,000…..actually with a very very high possibility of it been the coldest ever (evah) for the last 10,000 years.
In a weather or yearly or even a decade time span estimation… it could be whatever you or any one else fancies to be….and I would not really care, as I my self more interested in the climate and climate change than weather……..But when claiming an estimation in the bases of the term “since the records began” than you are in a climatic estimation by default, so to speak.
So no matter how many record warming years you have according to the simple weather or yearly cycles estimations, or how many such record years you may “produce”, it does not really mean anything in climate terms,…………… that is why these crazy records make not even a dent to the plateau or the hiatus…or put another way….these record years can not give you back that large amount of the missing heat, no matter what, because that is all to do with climate and not weather…….
hope this is not very complicated in principle..
cheers.
(A wasted posting effort by a banned sockpuppet. Comment DELETED. -mod)
@rooter and icouldnthelpit
Hey root/pit! You two have quite a dynamic-duo, tag-team act going here! My compliments! And since you two puckish hive-wits are obviously the hive’s go-to-guys for smart-lip snark (not to mention your unequaled skill at positioning your opening comments at the very tippy-top of the comments section of “denier” posts (again, my compliments)), let me ask you two, knee-slapper-genic pros to help me out a bit, by allowing me to draw on that special, snot-nosed, dork-humor gift of yours.
-You see, HotWhopper’s latest blog post (January 21, 2015) has “Sou” all fluffed up and “pecking” away at David Rose (yes!–that David Rose!), in the course of which Sou/HotWhopper, like some free-range, purloo-pot-qualified, tragic-victim-of-overly-strict-fusspot-training, mono-maniac headless-chicken, continues to defend that big, fat “egg” she laid in an earlier, well-scrambled post, declaring 2014 to be the hottest year on record–even though the data she cites, IN HER VERY OWN, RELEVANT POSTS, clearly shows either a 62% (NASA) or 52% (NOAA), likelihood that 2014 is NOT–REPEAT NOT!!!–THE HOTTEST YEAR ON RECORD!!! And, of course, the comments section of her latest post is a cock-a-leekie cacaphony of useless-pecker, capon-groupie, castrato shrieks.
So, like, I’m trying to capture this whole testosterone-free, egg-head, bird-brained deal, that’s going on over at HotWhopper’s blog in a comment that features some of that snappy snark you guys are so famous for. You know, that sort of thing. So could you two put your fore-fingers to work, on my behalf–PLEASE! PLEASE! PLEASE!–and grope up a coupla, choice, drippin’ snark-goobers I could use in my little zinger-project?
Thanks in advance.
On a personal note, I see that HotWhopper critiqued my topside comment in her January 23, 2015 post addressing Dr. Ball’s guest opinion, above. And let me say (on this blog, I mean, since it would be a fool’s errand for me to make a chit-chat “run” at HotWhopper’s blogI) that I truly appreciate HotWhopper’s unstinting (even gushing) praise for my comment, stylistically speaking.
On the other hand she did “rip” me with a well placed zinger, “(Mike [curious that HotWhopper makes such an issue, in her blog-post, of the proper employment of upper-case/lower-case letters in acronyms, but, then, inappropriately capitalizes my “handle”–yet another example of the hive’s in-your-face, hypocritical double-standards? I think so] may be good [SEE!!!–didn’t I tell you HotWhopper just loves my stuff?!!!] at language from the gutter [a sensitive issue here since it involves a lady, and everything (and we all have had some episodes in our past, I dare muse, that–shall we say– benefit from the application of one or more, memory-gap, figurative, fig-leaf pasties), but I sense that HotWhopper speaks with real authority here, and (unlike your typical hive, B. S.-er type) can truly appreciate and savor the fine points that separate “good” gutter-language from “not-so-good” gutter-language)…but [ah! the fatal “but”] he’d [reference to moi] never pass a stats test [ZIIIIIINNNNNGuh!!!THUNK!!!].)”
Well now, I could try and brazen-out HotWhopper’s whole exposure of one of my most shameful secrets by raising the technical objection that I “have-too!” passed “stats tests” and, indeed, have never failed even one (but there’s a story there, that I’d rather not go into (and no!!! I didn’t cheat on any tests)). But the sad truth is that HotWhopper’s characterization of my “stats” skills is close enough so that I’m not gonna argue the point.
O. K. so now that I’ve eaten a good helping of humble-pie (more to come) and all that other good stuff, let me now convert my public humiliation into a quality-time teachable-moment:
-NASA assigns 2014’s claim to the “warmest year” (of those under consideration) a probability of 38% (see the chart that is a part of WUWT’s January 19, 2015 blog-post “GISS and NCDC Need To Be More Forthcoming…etc.”). So naturally, being a complete stats-dolt, I did a little subtraction from 100% and came up with (I wince to say this!) the notion there’s an implicit, NASA-sourced, 62% probability that 2014 is NOT the hottest year (please, excuse me–I’m experiencing some transient (I hope!) emotional trauma here, so I ask you to bear with me while I take a moment to ball up my right hand into a fist, look at myself in the bathroom mirror, strike myself repeatedly on the forehead, and intone, “STUPID!!!STUPID!!!STUPID!!!)!
-Feelin’ better now, thank you. And off to the final step in the healing process. So what then is the real skinny, stats-wise? What is the NASA probability that 2014 is NOT the hottest year (and, please, I don’t mean 2014 in comparison with any other, ONE-PARTICULAR YEAR (where HotWhopper would like to take the discussion (yes! I saw your little trick, there, HotWhopper))). Simple answer, right? A two-digit percentage, right? (unless, of course, the hive’s agit-proppers have cooked up yet another of their famous, flim-flam, >100% deals, like they did with their slicko, Gruber-booger attribution-“trick”). Anybody?
Mike, one quick personal question if you’d be so kind.
[middle is trimmed]
What an honour that would be. .
Far more evidence than that for considerably warmer earlier temps. Take a minute to look it up before spouting off.
(A wasted posting effort by a banned sockpuppet. Comment DELETED. -mod)
icouldnthelpit, Dr Ball wasn’t spouting, so go from there. But I guess youcouldnthelpit.
Well, youcouldn’thelpit, what with all the whining about polar bears and receding ice and Arctic Warming and Suzuki-Claus and Greenland melting faster than we originally thought and stuff, it’s nice to know that greenland has something to say about all of that. Now go and harvest some firewood from under that Alaskan Glacier, would you? There’s a good fellow.
I do not know why there so many tedious troll comments in this particular post, almost exclusively of the depth and wisdom of “Yah, boo! Sucks to you” variety.
Anthony, can’t you create a tedious trolls section in which to put these comments? On the main thread, leave the pathetic handles these individuals hide behind and say, “please find full comment in the Tedious Troll section”
These comments appear to be part of a petty alarmist conspiracy to interrupt the free flow of intelligent discussion. They are designed to pxxx off the other readers and to try and turn any sensible debate into a shambles.
Good point! But, unfortunately, the ice core data is the only and best data we have for the past 10 000 years. However, as discussed in this article, the surface station records are NOT the best we have for the last 30 years. As Anthony’s paper showed, they are in fact horrible, and should not be used in serious scientific discussions. However, the CAGW people insist on using them because they support the approved narrative.
It doesn’t matter if they have a margin of error, since there are many thousands of them. What matters is whether or not they are biased in one direction, and if that bias has been changing over the course of the record. I don’t recall Anthony’s paper showing that, other than some anecdotal examples.
Not only the stations, but the measuring instruments also.
http://notrickszone.com/2015/01/12/university-of-augsburg-44-year-veteran-meteorologist-calls-climate-protection-ridiculous-a-deception/
Interviewed was meteorologist Klaus Hager. He was active in meteorology for 44 years and now has been a lecturer at the University of Augsburg almost 10 years. He is considered an expert in weather instrumentation and measurement.
One reason for the perceived warming, Hager says, is traced back to a change in measurement instrumentation. He says glass thermometers were was replaced by much more sensitive electronic instruments in 1995. Hager tells the SZ
” For eight years I conducted parallel measurements at Lechfeld. The result was that compared to the glass thermometers, the electronic thermometers showed on average a temperature that was 0.9°C warmer. Thus we are comparing – even though we are measuring the temperature here – apples and oranges. No one is told that.” Hager confirms to the AZ that the higher temperatures are indeed an artifact of the new instruments.
– See more at: http://notrickszone.com/#sthash.Dm2Z36NY.dpuf
And then they adjust.
Dr. Ball, you crossposted a note the differences between
Version 3 and Version 2 GLOTI annual-averages data is 18% +/- 143%, ranging from -1280% (year 1947) to 629% (year 1960).
I see V3 & V2, which leads me to believe there was a V1 and wonder what that adjustment was.
Tell it to Phil Jones – he insists you can determine the temperature of the Southern Hemisphere to an accuracy of one-thousandth of a degree on the basis of one thermometer.
Good point. Phil Jones is engaged in “magical thinking” on determining the average temperature of the Southern Hemisphere with one thermometer, or he is engaged in decietful thinking.
Once you accept the CAGW dogma that temperature change can be predicted by the change in a single predominant factor CO2 (actually the difference in the logarithms of CO2) then whether you use Hanson’s model of Monckton’s model, if you assume that CO2 is well-mixed (which we now know it isn’t) then the change in temperature does not depend on where you measure it. This is just a mathematical consequence of the equations, given that CO2 at a fixed point in time is taken as a global constant.
Indeed, ice cores and d18O is the most reliable of climate proxies, bar none. These show a temperature decline for the past 6-8,000 years. It is the inevitable step-down into another ice age. Ever hear of Ice Age? No?
(Another long, wasted posting effort by a banned sockpuppet. Comment DELETED. -mod)
it is the best proxy. See d18O proxies for the Tertiary. Do you despise these?
also for the Pleistocene, from ice cores. Do you despise these?
You are reliable for a troll.
(That was targeted at icouldnthelpit)
(A wasted posting effort by a banned sockpuppet. Comment DELETED. -mod)
Upsidedown Tiljander turned rightside up.
“Are they reliable for local or global temps?”
It is hard to answer a question that uses undefined terms… Reliable with respect to what? Reliable for use as what?
If you want to rely on the data as an excuse to manage and manipulate society, then sure, why not? Any excuse is as good as the next for those still wearing blinders.
If you want to rely on the data to try to project what may be happening in the near future, then no … but it the projections from the ice core data shows that you shouldn’t be relying on the other data either; one runs counter to the other … best advice is not to blindly rely or depend any on either.
(A wasted posting effort by a banned sockpuppet. Comment DELETED. -mod)
icouldnthelpit, the earliest ‘thermometers’ were made after the 15th century. The first artificial Earth satellite was Sputnik – 1957. How else do you propose we infer global or regional temperatures before then? We have proxies, archeology / history. They can useful as long as you don’t resort to trickery and hide declines and accept their shortcomings.
(A wasted posting effort by a banned sockpuppet. Comment DELETED. -mod)
See Climate Audit for an exploding of the egregious science behind PAGES 2K.
mpainter. What’s better than PAGES 2K?
No more ridiculous than claiming 2014 was the warmest on record by .02 deg C.
(A wasted posting effort by a banned sockpuppet. Comment DELETED. -mod)
icouldn’thelpit:
So it is a 62% chance that 2014 was not the warmist year. I am with you there.
In fact, we can add in the Satellite data and it becomes a 98% chance that 2014 was not the warmist year.
How about that!
Oh? You don’t like satellite data?
Icouldthelpit
Man you must really like your job! how much do you get paid to be the first one to post on every single article? Either you are really desperate for cash or trolling pays really well. let me in on who you are connected to I could do a great job of sound like fool for the right amount of cash.
(A wasted posting effort by a banned sockpuppet. Comment DELETED. -mod)
The polar regions are where climate change is felt first, right? before it reaches the rest of the world?
Exactly. Note that the record ice extent in Anarctica. Note the rebound of ice extent in the Arctic. Note that Greenland stopped losing mass in 2013-14. Oxidize that Carbon, they say that will save us. Hasn’t yet, unfortunately.
icouldnthelpit
Why yes it was, even a dummy can see you [are] a troll! Now don’t be greedy let the rest of us cash in too!
How does it feel like having the brain of a [trimmed]?
So without any evidence, proxy or otherwise, but just on your say so the whole Earth has been a lot colder in the past 10,000 years. Got it.
Even your brilliant cohort rooter’s graph shows a couple centuries of warmer temperatures over 2,000 years ago.
Not that this is of any matter, this constant back and forth of my graph is better than your graph, this data is better than your data, my speculation is better than your theory just proves the obvious, nobody knows. And if climate activists did not steadily vomit fear-mongering for political power and Al Gore did not discover he could make a $100 million on climate alarm-ism no one would care.
[Please do not insult seagulls. .mod]
Not the brain, but the aim of a seagull.
He pollutes the thread with his splatters.
(A long but wasted posting effort by a banned sockpuppet. Comment DELETED. -mod)
Oh, look. It IS always jerks who use “whilst”.
(A wasted posting effort by a banned sockpuppet. Comment DELETED. -mod)
Actually, that’s seems a fairly rational criticism. Care to comment Dr. Ball? Of all the flawed temperature records I doubt the most, paleo proxy reconstructions are the ones I trust the least. Yamal get what I’m sayin’?
Just like using Moana Loa for measuring CO2.
GASES ARE WELL MIXED IN THE ATMOSPHERE !
And of course the fluctuations are well matched in the Vostok ice core.
Of course you can easily disprove this by enumerating some areas where there is evidence that the early-mid Holocene was colder than the present day.
But I’m not holding my breath.
Well you also have the Antarctic ice cores, alpine ice cores, O18 isotopes from all over the Earth, as well as other forms of proxy data which all suggest approximately the same Holocene temperature reconstruction, save for certain tree ring proxies which make for horrible thermometers.
The GISP2 Ice Core shows over a 3°C difference over many years. The post was critical of 0.02°C global average difference between years being treated as significant.
icouldnthelpit
Oh! So you ignore the article under discussion and particularly its Figure 10.
Instead of discussing the data in the article you pretend that the repeatedly refuted bunkum from Marcott et al. has some merit. What next; resurrect the Mann, Bradley & Hughes ‘hockey sticks’?
This thread is about the above article from Tim Ball. The evidence in that article is the subject of discussion. I recognise that you would prefer to troll discussion onto warmunist propaganda of your choosing; but this thread is about the above article from Tim Ball.
Richard
Oh, come. Have you even read enough paleo studies to actually understand what he is saying? If he really wanted drama he could have used the GEOCARB series and stated that the present global temps are within the lowest 0.01 % of the Phanerozoic (last 500 million years). It doesn’t change even when you use the lower error boundary.
In fact, the Holocene cooling is a big enough problem in science that it constitutes a puzzle for climate modelers:
http://www.pnas.org/content/111/34/E3501.abstract
The key words for that abstract BTW are “global temperature, Holocene temperature, model-data inconsistency”
(A wasted posting effort by a banned sockpuppet. Comment DELETED. -mod)
icouldnthelpit
If you go down you get lower.
Cooling is temperature going down (the “opposite” is warming).
The cooling has been making temperatures lower for a long time so the lowest 3% are recent.
Can you now see the point or is it still too difficult for you?
Richard
(A wasted posting effort by a banned sockpuppet. Comment DELETED. -mod)
icouldnthelpit
My answer to you is not in the right place. Sorry.
This link jumps to it.
Richard
We are presently in the coolest part of the Holocene because the trend has been a cooling trend, with slight fluctuations. Recent warming does not alter the fact that temperatures are stepping down into a new ice age. We need the benefits of more warming. So far, CO2 has let us down.
(A wasted posting effort by a banned sockpuppet. Comment DELETED. -mod)
(A wasted posting effort by a banned sockpuppet. Comment DELETED. -mod)
Any textbook on climate will verify the temperature decline of the Holocene. What you SKS types will never realize is that you are being fed a steady diet of swill which you lap up. When you encounter real science, you suffer culture shock.
pit: “Do you have a source for that?”
Wikipedia should be reliable enough for you (fiercely guarded by a troll named Connelly):
http://en.wikipedia.org/wiki/File:Holocene_Temperature_Variations.png
Hmm, the Holocene temp history didn’t plot, just a little icon showing. Let’s try again:
http://upload.wikimedia.org/wikipedia/commons/c/ca/Holocene_Temperature_Variations.png
Yes, the troll seems to have spliced a ‘hockey stick’ onto the end, but didn’t make much effort to make it look ‘real’.
The above is a plot of all histories, as rendered by various proxies, with varying sensitivities. So even the 2004 splice is still within the noise of uncertainty.
I wonder in 100 years how they will adjust the data of this time. It will be the same temperature as now, but now was actually a lot colder than we think.
I think it will depend on whether “science facts” as the focus of our K-12 education program or “social facts” prevails. Right now academia, the media, and think tanks are working very hard and the new Next Generation Science Standards require (I read the NAS workshop program that came out recently) that the focus be on changing beliefs about climate change and new values in ways that discredit the rational mind completely.
http://www.invisibleserfscollar.com/blending-sustainability-and-education-to-gain-arational-nonlinear-minds-and-new-behaviors/ was written a few years ago, but the RSA in the UK came out with its “Seven Dimensions of Climate Change” just this morning making this same distinction. RSA is also working with the Roosevelt Institute and others to create the Next American Economy. Our actual world is thus being reshaped to fit false beliefs about climate change and temps. Perceptions of the past 100 years from now will be greatly influenced by all this mind arson going on unless it is better understood and more widely appreciated.
“Education is what remains after one has forgotten what one has learned in school.” This is going to be more so in the future.
Andy, if you have any mercury lab thermometers, hold on to them. I plan to check the calibration of any new ones I buy using mine. Hard to say how the standard might change.
Thanks Tim. Figure 10 says it all.
What is the source of this graph? There is not even a caption, so how can it “say it all”?
Well, Barry, the fact that you are apparently in the ‘GRIP’ of blindness, says it all.
Sorry, but I would prefer to see figures with clear captions (and references) that stand on their own. These blogs seem to often be hastily written and posted, with poor attention to detail and technical writing standards. This site could really use an editor (I understand Anthony cannot do it all himself).
[Send money. .mod]
So tell me, skeohane, what does Figure 10 say? That we are still in the little ice age? The figure does not show any dip below the 20th century mean (the lower red line) in the last 6000 years. Do you really believe that?
Ice core d18O temperature proxy is the most reliable. The last 6-8000 years have seen a decline in temperatures. This decline has been established in climatology for a long time. You really need to get up to speed on this.
So your saying 97% of all previous years in the last ten millennia agree it’s cold now.
Damn that’s a good one. Kudos!
It is a consensus of years.
I suggest you take time off from the hair-splitting, conspiracy theorizing, and sophistry to take a trip up north in Canada or Alaska, where the warming is undeniable even to the most skeptical observer.
It may be warmer, but aren’t you missing the point? Warmer than what? Any of the last 100 years, or any of the last 10000 years? Which is most important?
So prove we had anything to do with it.
This is addressed in Figure 8 under bullet point 9. There is little doubt the earth’s surface temperature has measurably warmed over the last 100 years. Dr. Ball never says otherwise.
Alaska land air surface temperature CRUTEM 4 Jan 1977 – Feb 2013 trend MINUS 0.025 Deg C /decade……Sir Harry…you are blowing smoke ?
flash man is blowing ignorance. He swallows it at Hot Whopper and spits it out here, thinking to impress. Well, he does impress.
For arguments’ sake, let’s assume we’re still in the warming trend since the LIA. So what? What’s your larger point? Any evidence that a warmer climate is more dangerous to humans than a cooler one? Any evidence that reducing atmospheric CO2 makes climate & weather safer? Show us. Historical examples would be nice.
And while you’re at it, what exactly is the importance of Arctic ice to human safety?
Historical examples will be a challenge since there’s no period in the historical record when CO2 levels have been as high as they are now.
But the risk is certainly real – while there may be benefits to warming in parts of the world, any kind of significant, long-lasting climate change to a world of >7billion people optimized for current temps will be dangerous. We may at some point be able to grow wheat on the tundra, but it’s not going to happen fast enough to offset the loss of arable land in Africa, or the disappearance of water sources in Asia. If climate change is a bust, we can all breathe a sigh of relief. But if not, we’re gonna be pooched and by the time it’s obvious it will be way too late to do anything about it.
For Sir HF:
there’s no period in the historical record when CO2 levels have been as high as they are now In planetary history? That’s laughable. In human history? Still debatable.
7 billion people optimized for current temps WTF does that even mean?
the loss of arable land in Africa, or the disappearance of water sources in Asia Speculation, not fact.
Still waiting for real, verified data if you care to try again.
Reply to Sir Harry Flashman,
If we follow your lead we and our children and grandchildren will be pooched. It’s already obvious, but I hope it’s not too late to do anything about it. I’d rather not cause real harm to the present and future generations to avoid imaginary harm such as you’ve listed. Quite a list of scaremongering without any real scientific support …
[trimmed] He will never post a fact or backup a claim.
Sir Har har; (I have a temporary stutter)
Just where do you get these delusions?
There is currently no loss of arable land in Africa!
All claims to the contrary are based on false assumptions and bad models, not direct observations.
Water sources in Asia are not disappearing! They’re not even declining!
Again, all claims to the contrary are based on false assumptions and bad models, not direct observations.
Perhaps, if your memory goes back this far, you remember the gray paper source problems of the IPCC reports? The IPCC happily allowed activists and green organizations to ‘write’ articles for their summaries and reports. These activists included very dodgy claims from the weakest of articles.
Science? Not even close!
SHF, you can completely ignore the “historical record” and turn to the geological record instead. If you do that, well thats a fish of a different scale – just to mangle a metaphor. The present CO2 levels are the lowest in 400,000,000 years. Refer to GEOCARB III which is the gold standard for CO2 estimates over the Phanerozoic. The present (Pleistocene-Holocene and maybe toss in the Pliocene as well) is also the coldest period since the end of the Permian at the end of the Paleozoic. If you are concerned about planetary climate, then it behooves you to consider the “history” of the planet before singling out something as paltry as the warming since the end of the Little Ice Age.
I would. But I would freeze to death. I’m not acclimated.
And where do you do your hair-splitting, Flashman? I suppose you can feel 0.02 degrees on the edge of your ice floe?
And I suggest you google “confirmation bias” before attempting to draw conclusions about global climate from your own personal observations.
You say Alaska, I say the UK, let’s call the whole thing off. See Spain and Canada brrrrrrr!
25 Jan 2015 – UK
http://i.dailymail.co.uk/i/pix/2015/01/21/24E6BA0300000578-2919826-This_was_the_scene_at_the_airport_10am_today_and_hour_after_the_-a-77_1421843730264.jpg
http://i.dailymail.co.uk/i/pix/2015/01/21/24E846A300000578-2919826-image-m-134_1421852317155.jpg
http://www.dailymail.co.uk/news/article-2919826/Snow-causes-travel-chaos-UK-roads-blocked-car-breaking-TWO-SECONDS-runways-closed-s-plenty-come.html
Hey Sir Harry, about 8 days ago the BBC reported on snow in the Saudi Arabian desert.
http://news.bbcimg.co.uk/media/images/80207000/jpg/_80207230_snowman.jpg
Saudi Arabia should host the Iditerod next year!
isn’t Anchorage supposed to drop to -20C by the weekend?
http://akclimate.org/ClimTrends/Change/TempChange.html
Flashman, the chart in your link doesn’t support the kind of ‘global warming’ that you warmists preach: it’s not proportional with the Keely CO2 curve. Instead it shows a ‘step’ increase in average temp around 1976, and almost flat after that (if anything, cooling after 2009). But it is consistent with the gradual warming since LIA that even skeptics accept as ‘settled’ science. No ‘compelling’ proof of GHG warming here.
http://akclimate.org/sites/default/files/StateWide_Change_1949-2012_F.png
Indeed, the conclusion reached by the authors of this chart (akclimage.org) is:
In fact, if you look at my posting below you can actually see this “warm moist air advection” from the Pacific taking place as we speak!
Sir Harry Flashman, I see a downward trend for Alaska since around 2000.
SHF says:
…in Canada or Alaska…
Cherry-picking at it’s finest.
Global T has fluctuated by only 0.7ºC — over a century and a half. That is NOTHING.
Just prior to our present Holocene, temperatures have changed by TENS of whole degrees! And within only a decade or two!
Compare that ‘climate change’ with what we’re in now. Even the most wild-eyed Chicken Little alarmist finds it impossible to make the case that what we are seeing now is anything except natural climate variability. Global T has jiggled by a tiny 0.7ºC. So what? How can you possibly morph that non-event into a giant scare?
You should have picked a credible scare story, because CAGW fails:
http://myweb.westnet.com.au/ncgstokes/blog/ind5_12.jpg
Very bad graph.
The X-axis has no numbers, and the label is confusing.
yeah, db, what do you mean, confusing poor socrats like that ? For shame.
Thank you so much David Socrates for demonstrating so well the low intellect of climate alarmists.
To this simple retired airline pilot and idiotic “climate denier”, moi, the graph is not confusing at all and the title is absolutely clear. Read the title and generate your own “numbers” (or words), for the x axis, in an instant. If you can not do this you really should stop embarrassing yourself by writing about things totally outside your comprehension.
acementhead says:
Thank you so much David Socrates for demonstrating so well the low intellect of climate alarmists.
Truer words have rarely been written. A low intellect appears to be a basic requirement of the climate alarmist crowd, and D. Socrates sets the bar.
When Socrates says the graph is “confusing”, then it is — to him.
OK Mr acementhead
” the graph is not confusing ”
…
From your experience flying aircraft, please tell all of us, what the dark ticks on the graph represent, and what the light ones represent. (hence the interval of each tick) Then, tell us when the graph starts and when does it end.
Yes, on occasion Socrats admits the truth. Rare occasions, that is.
Socrates:
“dark ticks (sic) on the graph…light ticks (sic)…and intervals between the ticks (sic)”
###
Easy to tell that Socrates is sicked..er, ticked off.
mpainter,
the graph is bad, there’s no point denying.
Hugh? Hugh are ugh?
What isit that you don’t understand about the graph?
Tell us. We are here to help…if you can be helped.
Flashman:“Alaska, where the warming is undeniable even to the most skeptical observer.”
I’m skeptical. So whenever I see a claim like above about warming in Alaska I jump to the current weather charts to see what’s going.
Looking at CWOP (a NOAA network of QC’d backyard thermometers) I do see some curiously warm areas along the coast, but just north of Anchorage the temps drop sharply.
http://i59.tinypic.com/2iqjs0o.png
Hmm, sharp temperature gradient. That suggests a ‘front’ of some kind. Let’s look at the current surface analysis:
http://i60.tinypic.com/16c3uyv.png
I was right. Stationary and occluded fronts hanging over the coastal areas, with really warm temps to the South. But this is Alaska in the winter. Where is the warm air coming from? Should we conclude (like Flashman et al.) that finally here is ‘compelling’ proof of Global Warming?
No, it’s just a conveyor belt (‘atmospheric river’?) of warm moist air blowing off the mid-latitude Pacific Ocean.
http://www.ssd.noaa.gov/goes/west/nepac/flash-wv.html
But are these temps ‘weather’ or ‘climate’? Well, the average temperatures for central Alaska in January ranges from a max of -1F to a min of -10F. It’s some where between those extremes just a few miles north of Anchorage. So I’d say the expected temps are what we are seeing currently (along with some ‘weather’ fronts)
http://www.climate-zone.com/climate/united-states/alaska/fairbanks/
Ok, how about Anchorage, Alaska, today?
Here’s the weather almanac for today:
http://www.wunderground.com/history/airport/PAMR/2015/1/20/DailyHistory.html
Max Temperature 21 °F
Avg Max 22 °F
Record Max 36 °F (2001)
Min Temperature 12 °F
Avg Min 9 °F
Record min -15 °F (2012)
Today’s temperature is right in the normal range. Notice that the record low for today was only 3 years ago, in 2012. But the record high was 14 years ago, in 2001.
What’s your point Sir?
What hair splits here? What’s the conspiracy? What’s your sophist theory?
How about Ketchikan’s temperature, in the warm area today:
Today’s High 46 °F
Avg High 39 °F
Record high 57 °F (1981)
Today’s Low 43 °F
Avg Low 29 °F
Record Low 7 °F (1982)
Ketchikan is still 13 degrees F cooler than the record high–which occurred nearly 35 years ago, in 1981.
Thanks for bringing up Alaska, Sir.
Examining reality is very instructive when considering your alarmist theory that my SUV is killing the planet with trapped heat.
Welcome to the real world!
Ok, how about Anchorage, Alaska, today?
Here’s the weather almanac for today:
http://www.wunderground.com/history/airport/PAMR/2015/1/20/DailyHistory.html
Max Temperature 21 °F
Avg Max 22 °F
Record Max 36 °F (2001)
Min Temperature 12 °F
Avg Min 9 °F
Record min -15 °F (2012)
Today’s temperature is right in the normal range. Notice that the record low for today was only 3 years ago, in 2012. But the record high was 14 years ago, in 2001.
What’s your point Sir?
What hair splits here? What’s the conspiracy? What’s your sophist theory?
+1
Flashy
Or greenland were we all know that you can farm and live and have grand old time, oh wait that was 500 years ago. I am so confused what time period was warming and which was cooling!
@ur momisugly Sir Harry Flashman
You say “I suggest you take time off from the hair-splitting, conspiracy theorizing, and sophistry . . . .”
Pot calling kettle. Actually, we all thought the tree-hugging alarmist community were ‘sophists’. Our ‘Rationalist’ (reliance on reason and truth rather than intuition to justify one’s beliefs or actions) WUWT community are certainly not ‘Sophists’ (a person who uses clever or quibbling arguments that are fundamentally unsound).
We are easily able to tolerate a 15 degree C change in temperature between freezing cold kitchen conservatory and warm lounge. We survive. We can adapt. Even the dog is still alive. It is not catastrophic. It is not Armageddon.
Now, please, please, come back only when you have a ‘rational’ argument.
So many people complaining about so many things, so little time to reply. Also, the blog format doesn’t allow me to reply to all replies; someone should get on that. So in no particular order, some facts:
Reduced water resources in Asia (present and future) – http://www.gwp.org/Global/About%20GWP/Publications/Colombo%20Synthesis%20Report%20Climate%20Change%20Food%20and%20Water%20Security%20in%20South%20Asia,%20final.pdf
Desertification in Africa (there are dozens of articles and scholarly papers on this, I don’t know if anyone here is familiar with “Google”: http://www.rtcc.org/2012/04/27/climate-change-desertification-and-migration-connecting-the-dots/
High temps in the Arctic: http://www.cbc.ca/news/technology/eastern-arctic-temperatures-likely-at-120-000-year-high-1.2251709
http://www.livescience.com/40676-arctic-temperatures-record-high.html
Benefits of a low-carbon economy (dozens of economists have already pronounced on this, again, Google is your friend) -http://www.theclimategroup.org/_assets/files/Macroeconomics-effects-of-the-Low-Carbon-Economy.pdf
While I hate to appear negative, I now expect to see a host of comments shouting about conspiracies, data falsification, biased sources, and all the other things to which an argument is reduced when you’re on the wrong side of it. I expect that because it’s what normally happens.
FM:
Get up to date. Ice is increasing at both poles. Global warming is over and global cooling is upon us.
We will see drier conditions and a shorter growing season with consequent crop failures, food shortages and famine, food riots and mass migrations of the desperate for warmer climates and an increase in winter mortalities due to power shortages.
So now you have something better for handwringing.
Flashman:“eastern-artic-temperatures-likely-at-120-000-year-high”
Whatever is going on on Baffin Island it doesn’t seem to be due to rising CO2, else why don’t you see the Keeling Curve imprint on late 20th Century temps?
http://www.john-daly.com/stations/frobishr.gif
More likely soot and aerosols are to blame for the recent ice melting.
I live in Canada, I am THE most skeptical observer. You are out to lunch!
In order to “fill-in”, the Goddard Institute for Space Studies (GISS), made the ridiculous claim that a single station temperature was representative of a 1200 km radius region.
This statement seems misleading. As I understand it, the claim is that the “trend”/anomoly (rather than absolute temperature) at a station is representative of trends at other stations within a 1200km radius region. While I don’t necessarily agree (UHI, for example), the difference in the two statements is distinctive and provocative.
A trend is a series of absolute temperatures in point in time. but so what? It is still making gross assumptions in the data. It is equivalent to assuming that since the temperature in Florence, South Carolina is down this January from last January this must also be the case in Boston Massachusetts and Chicago, IL both about 1200 km away in different directions. Anyone familiar with US geography immediately knows how ridiculous an assumption this is.
It’s a bit more nuanced that that. When a daily reading at a station is missing, the trend of a closeby station which does include the daily reading, is used to interpolate the missing value. Closeby is chosen to be within 1200km of the station with the missing value. In the vast majority of cases, close is within 100km and usually is much less.
Nobody will use an ORD station trend to infill missing data at LGA, as EWR , JFK or even BOS would be a much better choice, for example.
That said, one must first remove any UHI signal from the trend, and that’s a much more complicated thing to do. There are also, I believe, nonlinearities around coastal regions and the arctic that may affect the viablility of the adjustment.
Joe Kbetcha, that might work in in heavily populated regions. How about where settlements can be sparse?
Sparse regions (e.g. the arctic) are of course an issue. As is the 75% of the planet covered by water with no station data.
I was objecting to Dr. Ball’s characterization of the algorithm.
Even the claim that the anomaly is representative out to 1200 km is extremely shaky if you actually go back to the 1987 Hansen paper where the claim was originally made. 1200 km is the range where correlation has dropped to 0.5 (not very impressive) north of 45 degrees latitude in the the northern hemisphere. Everywhere else it is worse. In the tropics there is practically no correlation even a few hundred kilometers away.
In the vast majority of cases, the trend used for adjustment comes from within a few klicks. The only place that 1200km would be used are in the arctic, generally, if even then.
Regularly up in the Arctic rather. And, more importantly, regularly out across the Arctic Ocean for 1200 km for most of the Arctic.
But, the DMI daily summer temperatures for 80 north – you know, the time of the year when the sun is actually visible up there – shows 0.0 change in temperature since records started in 1959. (A very slight decline actually.) But Hansen/GISS absolutely needs (craves ?) higher RED zones all across his Mercator projection of the Arctic, so they will continue projecting one station across 1200 km of ice and snow.
Is the tundra getting warmer? Most likely: EVERYTHING growing across the tundra is growing 12% to 27% faster, taller, longer, deeper, stronger, more drought resistant, with wider deeper greener leaves and far more branches and shoots and twigs. Of course the tundra (Arctic land area between 60 deg north and 70 deg north) is warmer! It is 25% darker now for longer periods of the year.
anyone that looks at an ice core..and can’t figure it out…..to quote Steve….is a moron
http://www.foresight.org/nanodot/wp-content/uploads/2009/12/histo3.png
“I think we risk becoming the best informed society that has ever died of ignorance.” -Reuben Blades
That graph is not unlike Fairbridge’s curve of Holocene sea level change (pub. in 1976).
The source for Fig. 10 is http://www.principia-scientific.org/temperature-change-in-a-nutshell.html
“Facts are stubborn things; and whatever may be our wishes, our inclinations, or the dictates of our passions, they cannot alter the state of facts and evidence.” John Adams
Sure they can as far as the typical person knows. This 2013 initiative gives more detail on the certed effort to use education, social media, and digital media like gaming to create a popular perception that disregards actual facts. http://www.open.ac.uk/researchcentres/osrc/files/osrc/NARRATIVES.pdf
By the way, pages 19-20 seem to be referring in particular to WUWT, Jo Nova, and Bishop Hill. The geography is identified elsewhere. Also annoyed by skeptical Canadians.
Yes, facts.
Wow….what a pretty graph.
..
Did you make it with Excel ?
…
Your “facts” don’t point to a source.
More ^impotent nonsense^ from D. Socrates.
If sox could deconstruct that graph, he surely would have done so, no?
Instead, he emits his nonsense pixels as usual. So the chart stands… unfalsified. And as usual, Socks has no data of his own.
A new Ice Age could descend on us all, but Socrates would still be looking for ways to keep his alarmist faith in man-made runaway global warming alive.
Religion is a great comfort, isn’t it? Socks has it in abundance.
One cannot falsify or verify a chart that comes out of thin air.
…
You do realize that you should cite the source of the chart so that we all know where it came from. It’s a lot like the list of references in a scientific paper. Ever see them?
The work-shy Socrates says:
One cannot falsify or verify a chart that comes out of thin air.
Wrong once again. Further, the only thin air is between socks’s ears. That chart has a provenance that I can supply. But why bother? Socks cannot accept anything outside of his cult’s teachings.
Socrats hates ice ages. He likes warming so that he can thump his drum.
Socrates gets no respect and complains to … thin air.
You are a real piece of work, socpuppetry!
You have yet to falsify anything! You have also indicated absolutely zero verifications!
You do throw nitpicks, irresponsible claims and nonsense around; a tactic that reminds me more of an immature pubescent girl trying to be catty without the wit necessary.
When your specious claims are rebutted, you ignore the science and logic and instead focus on triviality as if your rep depends on having a rejoinder no matter how useless those words are.
So it isn’t that you post a legitimate comment, just that you manage to throw enough words into a comment framework that people almost understand.
It isn’t that your arguments are easily torn to shreds with observational evidence. Just that you pretend to be superior, aloof and oleaginously quick to post a shallow response with another misdirection or false claim.
Responses with all the illogic, opaqueness and tortured dreamworlds of Lewserandbaddoodlowsky and his irresponsible melting oleaginous buddies…
unless you alter the facts and evidence
What is great about this point in time is going forward we are going to have prolonged solar minimum conditions versus an increase in CO2 and we will see which way the climate goes.
My bet is with solar.
My “little voice inside” keeps saying that Spaceweather makes Earthweather. the Heliosphere is much more energetic than the Atmosphere. Be thankful for the Magnetosphere.
And what if the Climate Reference Network? What does it show?
The plot presentes af figue 10 here looks strange. It must be Alley’s gisp2. The one Latitude has plotted here.
It still has not dawned upon Ball that this icecore proxy ends in 1855. But it is worse than that. The plot here ends with LOWER temperatures to end. That is not the case for the data from gisp2. What is this? Has the data been brought up to date with lower temperature after 1855?
Anyone can understand that is just …. wrong. Will Tim Ball correct that graph (figure 10)? Too much to ask?
And then he can explain his method for extrapolating that proxy to represent the whole earth.
Rooter, you are not making any sense. Perhaps you should be a bit more self-editorial (just a suggestion) before pressing ‘post comment’. It doesn’t become you (or maybe it does) to lurch into the debate with a poorly-composed set of questions, when the person you are trying so wisely to undermine has taken the time to be concise.
Does it make sense to you Mike that the temperature on Greenland is lower now than in 1855.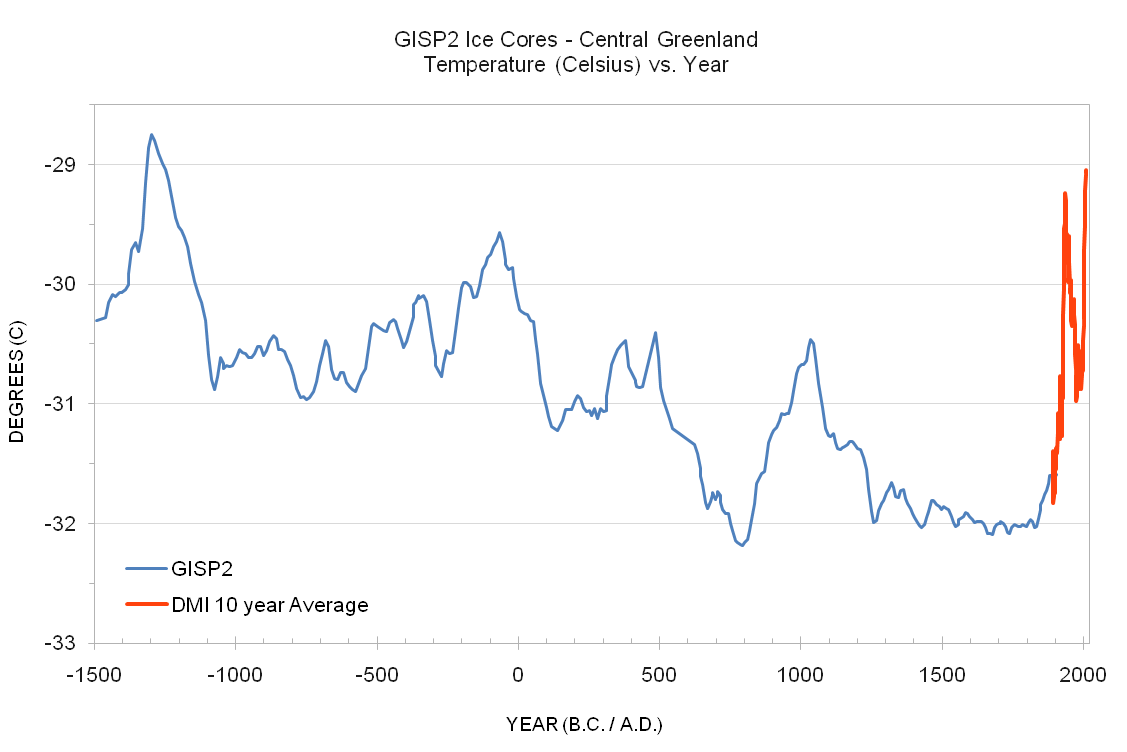 ?w=640&h=427
If so, please show it. Here is measured temperature in Greenland after 1855:
Show what, rooter? That the temperature hasn’t risen to as high as 1300 BC? Nice try at a puny hockey stick. You misconstrue the points being made in Dr. Ball’s post. I don’t have to “show it”, you already did. Bravo!
rooter at 9:47 am: Here is measured temperature in Greenland after 1855:
/var/folders/8w/2q4ypj0x4lq34yjmkfgj8jvm0000gn/T/com.apple.mail/com.apple.mail.drag-T0x7f9228d02d20.tmp.A2kheo/3500years.png
==========================
LOL, not only does that graph appear to graft proxies and instrumental but the proxies eyeball at around 100 year resolution (or more) while what looks like instrumental notes 10 year averages.
Look how the graph that rooter links to shows peaks right at the Minoan, Roman, and Medieval Warm Periods, with the last peak being the Modern Warm Period. Although the last peak looks contrived.
rooter seems to be accusing Dr. Ball of infilling. Don’t you like infilling, rooter?
I would be careful with infilling the whole globe from one proxy record.
How about you mpainter? Ok for you?
rooter says:
I would be careful with infilling the whole globe from one proxy record.
Yes. Like YAD061, for example?
That single proxy record — one tree in one location — changed a boring record of natural climate variability into an alarmist scare. Sort of like using the GISS record to scare people.
That is how desperate they are. And you? You are so in need of validation for your beliefs that you constantly cherry-pick similar examples, trying and resuscitate the dying climate alarmist scare.
It isn’t working, rooter. The man-made global warming scare is a hoax, and it needs shenanigans like YAD061 and the GISS record to keep it alive.
(A wasted posting effort by a banned sockpuppet. Comment DELETED. -mod)
rooter says he loves infilling. He just doesn’t like Dr. Ball.
icouldnthelpit
…
Using the word “hoax” when discussing the climate is also a good indication of an ulterior motive.
“Ulterior motive” is what’s called ‘projection’. The entire alarmist crowd posting here has ulterior motives.

Let’s look at some global T records from other sources:
And:
And:
Planet Earth is telling a completely different story from the alarmist cult’s. Which one should we accept? Planet Earth’s record, or the propaganda emitted by the handful of climate alarmists here?
Me? I think the planet is correct. The alarmist clique thinks the planet is lying. Which?
Dbstealey….
…
Examine your chart very closely
..
Notice the label on the y-axis. Now look at the label on the x-axis.
…
Too funny!!!!
…
You must be suffering from chart-dyslexia.
Dbstealey..
..
From your chart
..
…
Can you tell all of us with inquiring minds what a “sector” is ?
Socks says to Babsy:
I appreciate the fact that you seem to feel the need to respond to my posts
More projection. That is what socks does regarding my own comments: he endlessly bird-dogs them.
I appreciate that sox feels the need to try and find anything he can in my comments that might be a misteak. And he found one! Apparently, whoever put together the chart with the min/max data made a typo, and mixed up the labels for years and temperature. Was anyone really confused about that?
Since that’s what socks is complaining about, it is clear that it is the best thing he could find to criticize. But as usual, socks refuses to answer the important questions.
Socks feels the need to respond to every informative comment I make. But socks is flat wrong, as usual: there is nothing either unusual or unprecedented happening. But we all know why socks avoids discussing that fact: if he did, he would be forced to admit that the climate scare is a hoax. Yes, it is only a hoax, kept alive only by the immense taxpayer funds propping it up. It is not reality. Without money CAGW would be old news within 24 hours.
Finally, here is another chart for socks to scrutinize, as he continues to post throughout everyone else’s work day. Find a reason for alarm here, socksie. If you can:
Dbstealey.
…
I’m sorry, but your misteak is an obvious mistake.
[Well, now that you addressed the meat of his comments … .mod]
(Moderators, please do not delete comments or parts of comments that do not violate site policy. – sr. mod.)
dbstealey is consistent if nothing else. There is a pattern to his posts. It goes like this…
1. Say nothing is happening, you can’t prove it, it’s all a lie.
2. Get into a discussion and the facts start flying.
3. Post a few graphs that look like they came out of the cornflakes packet (some good examples above).
4. Get called on them.
5. Say nothing is happening, you can’t prove it, it’s all a lie.
Entertaining if nothing else.
Sockrates says:
…your misteak is an obvious mistake.
This tickles me no end! ☺
Anyone of average intelligence can see that I was making fun of myself. If there is anything in which I am better than 99.9% of the population, it is in my speling ability.
Socks needs to get a job. He’s too close to this debate; he can’t see the woods for the trees. But sometimes he does provide some amusement. ヅ
Thanks mr sox for a great example of being clueless. That made my morning.
@Simon:
May I add you to the list of clueless commentators? Thank you. Added.
Nothing in your post is anything other than a baseless assertion, criticizing links that I’ve posted. Therefore, you can be disregarded as trolling.
If you wish to be credible, post some verifiable facts like I did, or discuss the links I posted. Anything less, and you are down to soxie’s level. No one wants that.
“Entertaining if nothing else.”
…
Thank you Mr Simon, that about sums it all up in a few words.
Socks, you aren’t even entertaining. Where does that leave you?
Go get a job, and quit bothering the grown-ups.
Hey… where’s rooter? At work?
“Where does that leave you?”
…
It leaves me waiting for you to post more of your funny charts.
I like the dyslexic one……
Simon sez:
dbstealey is consistent if nothing else.
Thank you. That is correct.
Others are not consistent, however. Nor are they posting verifiable facts. Their opinions are constantly asserted instead. They simply David Socrates will not listen. Socks says:
From your experience flying aircraft, please tell all of us…
Cementafriend, please don’t bother with him. Socrates is the only reader here who is confused [OK, maybe Simon, too], and you will never be able to convince him of anything. He desperately combs through each and every little fact and every chart, hoping to find something to criticize. But Socrates asserts very little that is not simply his baseless opinion. Thus, his credibility is about as low as it can be. Nitpicking is his best and only argument.
Socks always misses the Big Picture: the entire ‘man-made global warming’ scare has been so thoroughly debunked that people like socrates have nothing else to post but their baseless assertions. They must attack any minor non-events they can find, such as a chart with a typo — while completely ignoring the central fact that the chart deconstructs everything they believe in. That deflection is only a tactic, covering up the fact that they’ve got nothin’.
When someone is desperately criticizing small, insignificant factoids — while completely ignoring the important information; the Big Picture — then they have hopelessly lost the debate. Socks and Simon are the only ones who do not realize how pathetic their arguments have become. But the rest of us see their desperation.
Finally, socks’ endless complaining about ‘insults’ indicates a serious mental problem. It goes beyond being just a crybaby. Labeling someone an airhead is not a problem, so long as numerous examples support the adjective. In sox’s case, there are so many examples of confused thinking that labels like that are pretty much a requirement for expressing an opinion.
If socks wants to see insults, he should read Michael Mann’s tweets. Skeptics regard being labeled as “deniers” living in the “denial-o-sphere”, etc., as insults. But Socrates has no problem at all with those insults, because Mann et al are his kinda people. So now socks is even cherry-picking his insults.
Skeptics are not crybabies about comments like the alarmist crowd is. Socrates should visit Hotwhopper, or SkS, or realclimate, or Scientific American, or the Guardian to understand how badly scientific skeptics are treated. Or look at some of the vicious cartoons posted of Anthony. Then even the soxmeister might understand what a crybaby he has turned into. That is just another tactic that deflects from the fact that socrates has got nothin’.
My message to D. Sockrates: grow up. Skeptics have been called worse; much worse. If you can’t stand the heat, stay out of the kitchen. There are thousands of blogs you can post at, they don’t need your schoolboy whining here. Suck it up, and do what I do: post verifiable facts. Quit deflecting. Stick with the subject of the discussion. And most importantly: when you have been proven wrong, man up and admit it. That would be a first for you.
[Snip. See previous comment. -mod.]
Unlike you Mr Dbstealey, I will not call you names nor will I insult you. I will keep your feet to the fire whenever you post charts that are funny looking, or when you make your frequent errors.
..
(Snip. Enough. – mod.)
Socrates, it insults me when you refuse to man up and admit it when you’re wrong — and you are wrong plenty. Most of the time, in fact.
Your alarmist propaganda insults me. Stop it. Furthermore, you are convincing nobody here of your weird world view. Start discussing verifiable facts, or give it up. You aren’t going to change anyone with your Saul Alinsky tactics, so quit trying.
Unless Planet Earth changes her ways, you have decisively lost the debate. That is what you should really be worrying about: the planet is making you wrong. She is debunking your beliefs.
Skeptics are right about the man-made global warming scare. Quit deflecting, and admit that you’ve got nothin’. You were wrong. That’s all.
Dbstealey it is hilarious when you refuse to man up and admit it when you’re wrong
“those of us up to speed on the subject know that global temperature (T) rises or falls the most at night”
..
http://wattsupwiththat.com/2014/12/31/2014-in-review/#comment-1825830
@D. Socrates,
You have probably posted that link a half dozen times now. It appears to be one of your endless nitpicks, but honestly, I do not know why you have a problem with the fact that it is colder at night than during the day.
I guess when you’ve got nothin’, anything will do, eh?
I will admit that your mind is strange, and that you see something enormous there that no one else sees. I mean, it must be something *very* important for you to keep posting it. Or, maybe you’ve just run out of worthwhile arguments…
Hey, I have an idea! Get a job.
RE: Get a job
..
See item #3
http://wattsupwiththat.com/2015/01/10/portents-in-paris/#comment-1834875
Socks says:
No, it’s Wednesday in Austrailia
That indicates socks is based in Australia. And:
…there are people in the world that have rich fathers that left them a boatload of money when they died.
Then my advice is doubled and squared: get a job.
dbstealey thinks the Yamal treerings have been used in the same way as Ball uses the gisp2 or the grip borehole proxy.
I think it is best for dbstealey to continue to hold that belief.
Simon says:
1. Say nothing is happening, you can’t prove it, it’s all a lie.
I don’t say it’s a lie, I say the onus is on the alarmist crowd to support their conjecture. Try to understand the Scientific Method, “Simon”.
2. Get into a discussion and the facts start flying.
Yes, I let the facts fly. Folks like you and socks just assert what you want to believe is true.
3. Post a few graphs that look like they came out of the cornflakes packet.
More than ‘a few’ graphs and charts. Literally, hundreds. And your only response is to try and denigrate them with comments like that. No wonder you’ve lost the debate.
4. Get called on them.
If by ‘get called’ you mean more baseless assertions, then OK…
5. Say nothing is happening, you can’t prove it, it’s all a lie.
Repeating yourself does not make you right.
Face it, you’ve got nothing. Really. You look at a completely normal situation, and see doom, disaster and despair. It must be hell living in your world.
rooter,
I’ve treated you with respect because you at least try to discuss facts, unlike others who just emit their baseless opinions here. If you’re going to start acting like that, though, all bets are off.
You say I used Yamal “in the same way” that Dr. Ball uses Gisp-2. That is wrong.
I used YAD061 to show you that one proxy like that is no good. Do you really think YAD061 was a representative proxy?
dbstealey says:
“That single proxy record — one tree in one location — changed a boring record of natural climate variability into an alarmist scare. ”
Might I ask which record?
(A wasted posting effort by a banned sockpuppet. Comment DELETED. -mod)
Yes, it does. Here are 150 world temperature records. Nothing either unusual or unprecedented happening, is there?
(A wasted posting effort by a banned sockpuppet. Comment DELETED. -mod)
icouldnthelpit:
You are correct. It is getting warmer. You are also correct that it is not unprecedented.
Excellent! Maybe you’re learning after all.
As we see in the chart above, global T has fluctuated by only about 0.7ºC, since the 1800’s. That panics some folks. They are either ignorant, or man-made global warming is their religion. Which one identifies you?
The source of the data appears to be: Dahl-Jensen, D., Mosegaard, K., Gundestrup, N., Clow, G.D., Johnsen, S.J., Hansen, A.W. and Balling, N. 1998. Past temperatures directly from the Greenland Ice Sheet. Science 282:268-271. I am afraid I can’t provide a direct link. It is likely pay-walled.
This is not isotope data, as one usually sees from ice cores. It is based on temperature profiles. I am skeptical of the results since they say that temperatures at last glacial maximum were 23 C colder than present. That is 3 times the usual estimate. Also, the graph that Ball gives shows a much larger temperature range than normal estimates. I too wondered if the data could resolve the last century. It looks the authors claim they can and their Figure 4 shows a pronounced recent T increase that does not appear in Ball’s version of the graph and would seem to destroy his claim that current temperatures are in the lowest 3%.
But this is from a quick scan. I have not yet given the paper a careful reading.
Ball’s article appears to be intellectually dishonest. As others have noted, he disses the claim that anomalies correlate over perhaps 1000 km, while misstating what is claimed. Then he takes data obtained by an unusually methodology and blithely picks one of the of the two locations reported to represent the entire planet.
rooter,
I hate to point out the obvious, but Dr. Spencer knows far more about this subject thanyou ever will.
Dr. Spencer?
Whenever did he enter this discussion? I am quite confident Dr. Spencer would not present 1855 as now. Or even worse like here: Present a downadjusted 1855 value as “now”.
Not even wrong.
http://berkeleyearth.lbl.gov/auto/Regional/TAVG/Figures/global-land-TAVG-Counts.pdf
in 2014 there are now 14,000 stations reporting.
Whether you use 300 stations or 3000 or 14000 the answer doesnt change.
You can eliminate all urban stations, stations with any population and the answer stays the same.
You can compare the land surface record to a satillite version of SAT ( provided by AIRS ) and find
NO difference.
Yes its getting warmer.
The LIA was real and we are no longer skating on the river Thames.
Ball needs to stop denying the LIA
Hard to believe that, Mosher. Take the UHI out of California and report back with the results, please and thank you.
‘Yes it is getting warmer’…. than the coolest periods in this interglacial. BFD
It is warmer only in a very narrow context of a few hundred years. When put into a thousand or ten thousand year time frame, it is not warmer — it’s even cooler than average. When comparing this Interglacial to the previous (Eemian), the overall behavior of the climate is not unusual, extreme, or abnormal.
It’s only warmer in specific locations, not everywhere. Mosher can only get his “same answer” by averaging temperatures from unrelated locations. Can’t do that. But everyone seems to insist on such idiocy.
Mosh
I spent a lot of time defending you in the past even though your conclusions are not mine, but you have really lost my respect in the last few months.
I recall reading on Roy Spencer’s blog that at least one set of satellite data imply a trend about about 20% smaller than the surface T measurements. The reason is not understood and the satellite data sets do not all agree with each other.
There do seem to be enough issues with the surface T data that it is plausible that the difference is due to an exaggerated trend in the surface T data. But a 20% difference does not change anything qualitatively. The real issue is not whether there is a warming trend, or whether CO2 can cause warming, it is how much of the warming is due to CO2.
Mosher are you then disputing the accuracy of Figs 2 and 3 above? If they are wrong what do your records show for identical breakdown?
Mosher
LIA was a period of a few centuries long, not a year long period like the 2014, where actually your argument starts.
I hope you “sober” enough to spot the huge difference on the two main terms of your argument.
Climatically they can not be compared, especially not in your “sobber” fashion.:)
You miss the point Mosh, as always, Tim is not talking about yearly cycles or weather or a year to year comparison or estimation….is actually addressing the issue by a climatic angle
And yes, while considering it in climate terms, strangely enough, the 2014 ends up as colder than any year during the LIA, with a far much higher climatic cooling signal than any of those years then.
Hard for some to really see the difference between weather and climate.
The missing heat budget for 2014 will be much higher than for such budget in any one year during the LIA, and that makes it clearly colder in comparison while considered in climate terms.
hope you understand the point.
cheers
LOL–Mosher! What a blatantly incorrect post. You should know better by now. But you don’t .
stop denying the LIA…first they trick you into believing the LIA stopped in 1850..and 1850 was the perfect temperature
Mosh, get back to us when you figure out why you can’t average temperatures and come up with anything meaningful.
Apparently there were 7 major Frost Fairs and a number of minor ones on the Thames in the two hundred years between 1607 and 1814.
There was a big freeze-up in 1947. The most recent was 1963.
Removal of the old London Bridge, construction of embankments, effluent discharge conspire to reduce expectation of the Thames freezing now.
Oh yeah! That and global back-radiation +.
Sir Harry,
as you are so informed, please explain to this ignorant fellow, why is it when driving into Hamburg Germany from the suburbs in the morning, within 3km there is a 2c in shift into a higher temperature ?
Steven, read the article please and then advise again about “Ball needs to stop denying the LIA”.
You need to stop denying the MWP and the fact that Greenland was green at that time and being farmed.
Thanks, Dr. Ball. Very good article.
Friends:
Can anyone explain why this thread has been blitzed by a swarm of trolls throwing mud?
Is it that the trolls have been hurt by the truth of the article from Tim Ball?
or
Has ‘Troll Central’ issued an order?
or ?
Richard
Apparently so! And the responses have that visceral, gutted tone. Oh dear.
I have to agree. Whatever happened to the rational commenters who used to debate here using facts and evidence? Now they’re gone, and the ones taking their place are just trolling.
I think I know why: they have run out of credible facts and evidence. Planet Earth is busy debunking their beliefs.
A stand-up guy admits it when he realizes he was wrong. So the handful of alartmists posting here are ipso facto not stand-up guys, that’s all. Their tactics have devolved into trolling.
That says nothing about scientific skeptics, but it says everything about them.
Actually it looks like WUWT was singled out for an AGW-faithful bombing run. Its rather like having earnest missionaries of (name your religious poison) knock at the door and then start screaming when you tell them you are interested/think their book makes no sense/are unwilling to cease eating meat/etc.
dbstealy,
Why don’t you just ignore them?
Much more like the false echo of an online list of rebuttals for non-entity trolls to try and use in climate discussions.
One has to be amused by how they all show up at the same time. They couldn’t be working from the same location or school, could they?
Shallow.
Terminally weak.
Disastrously deployed, (for the alarmists)
Along with long trails of silly posturing, ugly language and sheer bad science left forever on the Internet record of the extremes alarmist trolls go to.
Eventually, someone will wise up (if that haven’t already) and start documenting the who what and where of CAGW activists.
History will reveal the miscreants, their particular activities and methods, and brand them forever as either easily misguided gullible morons or terrible parasitic creatures of evil.
It will be ever so hard to do the Renewable Tax Credit and other EPA, Redistribution actions Pres. Obama plans with this site and others putting out the facts and proving it up. Myself and others in Texas have been in contact with a former House Member who is close to Ted Cruz for three years, That guy is out of the House now but he put us in contact with Ted Cruz’s people. (that and my wife has lots of contact around Texas where Ted’s father makes his talks). So Ted and his staff are way up to date on the truth more than almost any other in D.C..
Obama and the likes of G.E. know they can not swing the graft unless they take on this site and others.
They will stop at nothing as the Climate Change Lie is so easy to disprove and the R’s may just act.
For sure if Ted takes it to the floor like he does and force hearings where the light can shine at last.
So here they are. They will try to fowl the air and will if possible use the courts and or something like the FCC or Justice Dept. to side line any truth session.
Greenpeace does not play by the rules, keep that in mind too.
COP Paris Dec. 2015 – a call to arms…
Looks like “Troll Central” is just trying to apply the ‘extreme meme’ to win their arguments.
Note that in the past, ‘climate’ meant ‘average weather’. So computing the ‘expected value’ for temperature, rainfall, etc was equivalent to averaging these values from weather reports.
But apparently the warmists were not happy that mean temps didn’t rise in proportion to the Keeling Curve. The expected values for climate disappointed them because recent mean temps (over the last 2 decades) don’t support the CAGW Hypothesis (“Man-made CO2 causes climate disasters”).
So they moved the goal-posts and changed the way climate is presented to the world (via MSM etc), from ‘expected values’ to ‘extreme values’. The ‘extreme meme’ has been quite successful I must admit. Everyone, including many skeptics, seem to have accepted this new way of defining climate blindly without questioning its validity.
So, does the increasing variance of weather parameters (colder “coldests” and warmer “warmest” etc) mean the same thing as saying “the climate is warming because of man-made CO2”?
Here’s a simple counter-example, graciously provided by Sir Harry in one of the posts above (thanks!):
http://i60.tinypic.com/nxjm1f.jpg
Note that expected value for temperature rose in 1976 and created a step increase in climate temperature. It’s slightly warmer, most likely due the combined effects of gradual warming since the LIA and the latest positive PDO phase change.
But, using this newfangled ‘extreme meme’, I’ll bet we could fool some of the MSM gullibles into thinking it’s getting cooler, because the latter half of the graph has more frequent and deeper cold extrema (blue oval) than the earlier half (red oval).
I wasn’t clear:
“… because the latter half of the graph has more frequent and deeper cold extrema (blue oval) than the earlier half’s (red oval) warm extremes. So, the warm extrema were less frequent and shallower (red oval) than the more frequent and deeper cold extrema (blue oval). ”
Sure, it’s a bunch of hand-waving BS. That’s my point about this whole ‘extreme meme’ theme. :-]
Updated graph:
http://www1.ncdc.noaa.gov/pub/data/cmb/images/us/2014/ann/timeseries02-050-00-191801-201412.gif
Yet Another Update:
http://i62.tinypic.com/14w63b7.png
So we conclude that climate estimates computed from sampled measurements depend a lot upon which samples are used.
All of these ‘updates’ are from NOAA.
These guy got their orders for sure. Start trolling en masse………..
They are worse that the ISIS fundamentalists preaching their Sharia Law
Let’s not get carried away there. At least for the present AGW faithful only “wish” they could direct violent acts against dissidents.
Slim,
You’re a little out of date. ISIS has moved beyond preaching.
10,000 years, hah that’s only weather
Good point.
It would be nice if someone could force the “Goddard Institute for Space Studies” to go back to studying space sciences rather than wasting money on political activism.
Steven like so many others in climate science only go with trends and can not forecast or fathom a turn.
Remember the 1970’s.
The trolls’ interest in sources of data strikes me as analogous to the interest shown by king Herod and his mates in the location of the Christ child.
Happy hunting.
No – you don’t like people making their own copies of climate data, especially palaeo data, do you?
“Notice that only approximately 1000 stations cover 100 years.”
Has anyone taken the average of these stations to see what their data shows. Perhaps they could be grouped by rural and urban. I would be really curious to see that.
Excellent! Well worth requoting! The tiger quote comparison is also very good.
Thanks, Dr. Ball.
I’m preparing to include some of this article in my pages, as a preface to the thermometer records that I show.
Thank you Dr Ball. Judging from some comments it evoked, we know now more what’s up with the alarmist sheep’s skin. Keep on the good work.